

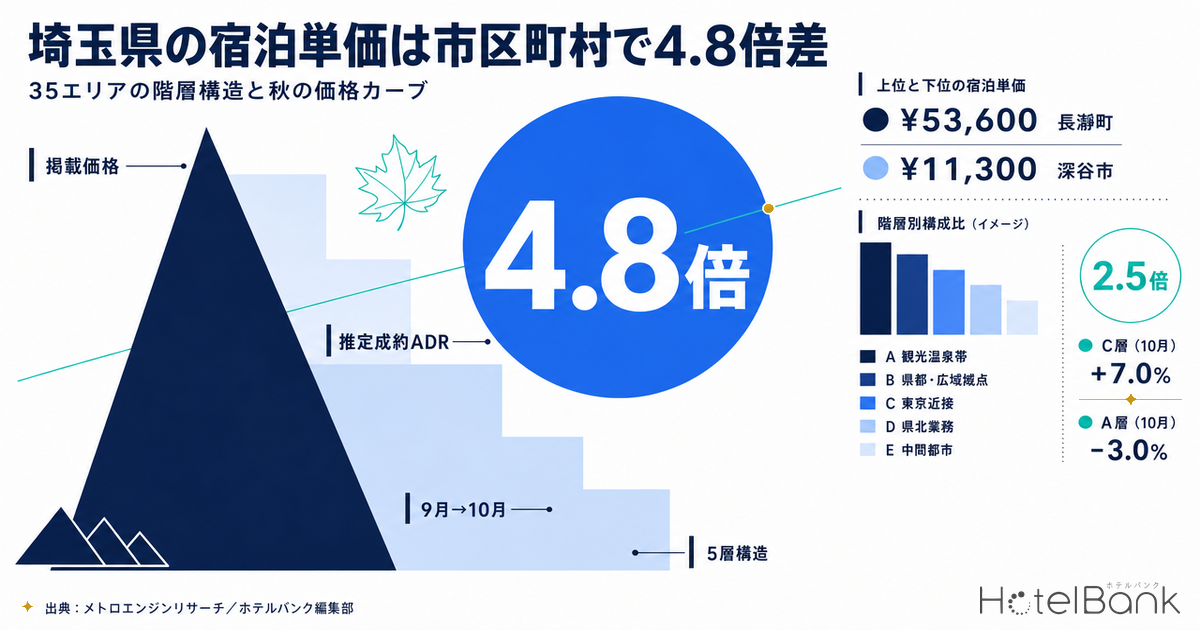
In Saitama Prefecture, what a room costs depends heavily on where in the prefecture it sits. Ranking the 35 municipalities with sufficient coverage for September 2026 using MetroEngines Research data, the highest listed price (all-plan average) is Nagatoro Town at roughly ¥53,600 and the lowest is Fukaya City at roughly ¥11,300 — a gap of 4.8x. Re-sort those same 35 areas by estimated settled ADR, however, and the gap narrows to 2.5x. This article breaks down, municipality by municipality, where the divergence between “the tier structure seen through listed prices” and “the tier structure seen through settled rates” comes from, and separates which tiers see rates rise and which see them fall across autumn 2026 (September and October).
Note on scope: this article deals with the prefecture-wide rate tier structure and the autumn monthly curve. It does not cover MICE demand or site-level investment potential in any single sub-market; the cross-sectional comparison of all 35 municipalities is the sole focus here.
Metric Definitions Used in This Article
- ADR (average daily rate) = estimated settled ADR: an estimated settled rate (tax-exclusive equivalent) derived by applying category-specific correction coefficients to each property’s publicly listed lowest plan level (double occupancy, per-room rate, tax included). Cross-checked against property-level disclosures by a listed hotel REIT (Invincible Investment Corporation, 184 property-months, April–May 2026), the median error is approximately 7.5%. These are estimates and differ from each property’s actual transacted prices or accounting figures. Area-level ADR is the median of the properties covered (the level of a typical property in that area).
- Listed price (all-plan average, tax included): the average publicly offered selling price across all plans, from room-only through meal-inclusive. Per-room rate at double occupancy. This is a different metric from estimated settled ADR, and this article always shows it in a separate column.
- OCC (occupancy): sold rooms as a share of total rooms in the area (an estimate based on OTA-listed inventory). Used only at the prefecture and property-category level.
- LT (lead time): days remaining until the check-in date. LT0 = same day.
- Data source: MetroEngines Research
- — Measured by listed price (all-plan average), the intra-prefecture gap is 4.8x (Nagatoro Town ¥53,600 vs Fukaya City ¥11,300). Re-sorting the same 35 areas by estimated settled ADR narrows it to 2.5x.
- — The gap narrows because the spread multiple itself — “listed price ÷ estimated settled ADR” — is stratified. Nagatoro Town runs at 2.67x and Minano Town at 2.53x, against Misato City at 1.25x and Soka City at 1.26x.
- — What drives the rate tiers is property-category mix and asset scale. Rooms per property run from roughly 18 in Nagatoro Town to roughly 123 in Kumagaya City — a 7x difference — and the spread multiple lines up by category too, from 3.08x for resort hotels down to 1.46x for limited-service hotels.
- — The autumn monthly curve points in opposite directions by tier. The onsen-tourism belt (Tier A) moves -3.0% from September to October, while the prefectural capital belt gains +6.7% and the Tokyo-adjacent belt +7.0%. The five-day holiday run of 19–23 September is the pivot.
- — Of the nine new properties added in 2026, six are limited-service hotels totalling 1,194 rooms. All sit in Saitama-Shintoshin, Kumagaya, Tokorozawa, Urawa, Ageo and Fukaya — concentrated entirely in the prefectural capital business belt (Tier B) and the northern Saitama business belt (Tier D).
The prefecture-wide level — listed prices up roughly 20% in two years
Start with where the prefecture as a whole sits. Saitama’s listed price (all-plan average) rose from ¥14,300 in September 2024 to ¥17,100 in September 2026, a gain of roughly 19% in two years. Overlaying the years to expose seasonality shows Saitama takes a twin-peak shape: highs in midsummer (August) and late autumn (November), with a trough in early summer (June–July). As a leisure destination for the Tokyo metropolitan area, it has two demand peaks — summer river play and camping, and autumn foliage.
Source: created by the HotelBank Editorial Team from MetroEngines Research (observed properties N=213–343 per month)
The observed property count does require care, however. In June 2026 coverage within the prefecture expanded from 273 to 343 properties, so part of the apparent step down in listed price that month reflects relatively low-rate small properties entering the observation base. The trajectory across June 2026 cannot simply be read as a price decline. Conversely, from September 2026 onward the dates fall within the forward selling window, so observed property counts taper off (311 properties in September down to 213 in December). September and October — the months used for the municipal comparison in this article — were both captured under identical observation conditions.
4.8x across municipalities — but 2.5x on settled rates
Now to the tier structure itself. As of September 2026, 35 municipalities in the prefecture met the threshold of three or more observed properties. Ranked by listed price, the top of the table is Nagatoro Town at ¥53,600, Minano Town at ¥47,800, Ogano Town at ¥34,100, Yokoze Town at ¥33,400 and Chichibu City at ¥31,300 — the Chichibu basin and the upper Arakawa river gorge belt monopolise the top. The bottom runs Fukaya City ¥11,300, Iwatsuki Ward ¥11,300, Misato City ¥11,700 and Toda City ¥11,900. Top to bottom, the gap is 4.8x.
Look at the same areas through estimated settled ADR, though, and the picture changes. Restricting to the 27 municipalities with three or more properties underpinning the settled ADR calculation, the top is Nagatoro Town at ¥20,100 and the bottom Fukaya City at ¥7,900 — a gap of just 2.5x. Close to half of the 4.8x step visible in listed prices disappears at the settled level. How wide intra-prefecture gaps run at the municipal level varies by prefecture, and where Saitama sits within the national distribution is laid out in “Japan Intra-Prefecture ADR Gaps Reach 5.2x: 368 Municipalities Ranked”.
Source: created by the HotelBank Editorial Team from MetroEngines Research (September 2026; the 27 municipalities with three or more properties underpinning estimated settled ADR)
Why the step narrows — the listed-to-settled spread is itself stratified
Why does it narrow? Take the ratio of “listed price ÷ estimated settled ADR” for each municipality, and that ratio turns out to be cleanly stratified in its own right.
Source: created by the HotelBank Editorial Team from MetroEngines Research (bubble size = observed properties; N=27 municipalities)
In Nagatoro Town the listed price is 2.67x the estimated settled ADR, in Minano Town 2.53x, in Ogano Town 2.10x and in Chichibu City 2.18x. Against that, Misato City runs at 1.25x, Soka City 1.26x, Tsurugashima City 1.28x and Kasukabe City 1.30x — barely any spread at all. In other words, the further into the onsen-tourism belt you go, “the wider the band of prices on public display.”
This is explained by differences in property-category composition. In Nagatoro Town the properties showing active inventory are three ryokan with 53 rooms in total, roughly 18 rooms per property. Ogano Town has five ryokan, one minshuku and one guesthouse, 97 rooms in total. Chichibu City mixes 15 ryokan (212 rooms) at its core with five minshuku, two cottages, two resort hotels and three limited-service hotels among others — 29 properties, 650 rooms in total, 22 rooms per property. Ryokan-type properties publish plans across a wide price band simultaneously, from room-only through two-meal packages to rooms with a private open-air bath, so their all-plan average sits well above the actual settled level.
By contrast, the business belts of northern Saitama and the Tokyo fringe are dominated by limited-service hotels, and the assets are larger. Kumagaya City has 14 properties with 1,715 rooms (of which ten limited-service hotels account for 1,181), roughly 123 rooms per property. Omiya Ward has 13 properties and 1,397 rooms, roughly 108 per property. Fukaya City has 14 properties and 816 rooms. Limited-service hotels carry few plans across a narrow price band, so listed price and settled level nearly coincide. Against Nagatoro Town’s 18 rooms per property, Kumagaya City runs 123 — a roughly 7x difference in rooms per property, and this difference in asset composition governs how the rate tiers appear in the first place.
Key reading point: when discussing rate gaps between areas, the size of the conclusion changes twofold depending on which metric you are looking at. Comparing listed prices describes “how wide the band of prices available in that area is”; comparing estimated settled ADR describes “the level at which business is actually transacted.” For competitive benchmarking the latter is the guide; for product design and plan composition, the former.
A five-tier structure — Saitama’s room rates read geographically
Bundling the 35 municipalities by function, Saitama’s accommodation market resolves into five tiers.
| Tier | Main areas | Municipalities | Observed properties | Listed price median (Sep) | Estimated settled ADR median (Sep) | Sep to Oct |
|---|---|---|---|---|---|---|
| A. Chichibu / Okumusashi onsen-tourism belt | Nagatoro, Minano, Ogano, Yokoze, Chichibu, Namegawa | 6 | 81 | ¥33,700 | ¥17,600 | -3.0% |
| B. Prefectural capital & regional hub belt | Omiya, Urawa, Chuo, Kawagoe, Tokorozawa | 5 | 58 | ¥18,700 | ¥12,400 | +6.7% |
| E. Mid-size city & suburban belt | Hanno, Higashimatsuyama, Ageo, Kasukabe, Kuki, Sayama, Satte | 7 | 38 | ¥15,700 | ¥11,200 | +3.5% |
| D. Northern Saitama business hub belt | Kumagaya, Fukaya, Honjo, Gyoda, Hanyu, Kazo | 6 | 48 | ¥13,700 | ¥8,400 | +0.2% |
| C. Tokyo-adjacent commuter belt | Kawaguchi, Koshigaya, Soka, Toda, Warabi, Asaka, Wako and others | 11 | 57 | ¥12,300 | ¥9,700 | +7.0% |
Source: created by the HotelBank Editorial Team from MetroEngines Research (September / October 2026; the 35 municipalities with three or more observed properties, aggregated by function)
On median listed price, Tier A (¥33,700) is 2.7x Tier C (¥12,300). On median estimated settled ADR, though, Tier A ¥17,600 against Tier C ¥9,700 narrows that to 1.8x. Here again, the choice of metric drives the size of the conclusion.
Plotted on a map, these five tiers align almost exactly with the prefecture’s topography. The Chichibu basin and the upper Arakawa highlands (Tier A) sit at the top, the central line of Saitama City, Kawagoe and Tokorozawa (Tier B) in the middle, and the southeast bordering Tokyo (Tier C) together with the northern Tone river belt (Tier D) form the base.
Source: created by the HotelBank Editorial Team from MetroEngines Research (circle size = observed properties, colour = tier)
The autumn monthly curve — rising tiers and falling tiers point in opposite directions
Movement from September into October splits clearly by tier. The median listed price of the onsen-tourism belt (Tier A) falls 3.0%, while the prefectural capital belt (Tier B) rises 6.7% and the Tokyo-adjacent belt (Tier C) rises 7.0%.
Source: created by the HotelBank Editorial Team from MetroEngines Research (change in listed price from September to October 2026, N=35 municipalities)
There is a reason for this opposing movement. September 2026 contains a five-day holiday run from Saturday 19 September through Wednesday 23 September: 21 September is Respect for the Aged Day (the third Monday), 23 September is Autumn Equinox Day, and Tuesday 22 September between them becomes a Citizens’ Holiday. For the onsen-tourism belt, September is the peak of holiday demand and October settles back by comparison. For the prefectural capital and Tokyo-adjacent belts, where business demand dominates, September is a month in which weekdays are consumed by the holiday run — October, with weekday occupancy restored, is the easier month in which to hold rate. This split between holidays and weekdays shows up not only in price but in how bookings arrive, with leisure areas filling earlier for holiday runs and urban properties filling earlier on weekdays.
At the municipal level, Minano Town is an exception within the tourism belt, moving from ¥47,800 in September to ¥54,400 in October (+13.9%), followed by Satte City (+19.0%), Kuki City (+15.0%) and Urawa Ward (+10.3%). Falling the other way are Namegawa Town (-28.5%, though with only one property underpinning its estimated settled ADR, a reference value), Kawaguchi City (-11.0%) and Nagatoro Town (-8.1%).
How far have September bookings progressed?
To see how autumn demand is actually building, follow the remaining inventory. We tracked remaining rooms at properties with observable inventory in the prefecture across three dates: Saturday 19 September 2026 (the first day of the five-day run), Monday 21 September (Respect for the Aged Day), and — as a control — Wednesday 16 September (an ordinary weekday).
| Check-in date | LT90 | LT75 | LT60 | Latest observation | Observed properties range |
|---|---|---|---|---|---|
| Sat 19 Sep — first day of the five-day run | 76.9% | 78.4% | 81.5% | 84.0% LT48 | 168–192 |
| Mon 21 Sep — Respect for the Aged Day | 74.2% | 75.4% | 77.2% | 78.3% LT50 | 171–188 |
| Wed 16 Sep — control weekday | 67.3% | 67.1% | 68.2% | 69.0% LT45 | 173–198 |
Source: created by the HotelBank Editorial Team from MetroEngines Research (occupancy = an estimate based on OTA-listed inventory. Covering 17,448 rooms across 229 properties in the prefecture; observed property counts at each point shown as a range)
For 19 September, the first day of the holiday run, 76.9% of inventory had already been absorbed by LT90 (21 June), reaching 84.0% by LT48 (the survey date). Listed price over the same window rose from ¥23,100 to ¥25,600. The control weekday of 16 September ran essentially flat from LT90 to LT45, 67.3% to 69.0%, with listed price unmoved at around ¥15,000. The result is a 15pt gap in occupancy and roughly ¥10,000 in listed price between the holiday date and the weekday. Note that occupancy here is an estimate based on the absorption of inventory sold via OTAs and differs from a property’s actual overall occupancy.
By property category — ryokan and resorts carry rate, limited-service carries rooms
Viewed by property category, the prefecture’s supply splits cleanly between what carries rate and what carries room count.
Source: created by the HotelBank Editorial Team from MetroEngines Research (listed price and estimated settled ADR are September 2026; occupancy is an estimate for the July 2026 operating month)
| Category | Listed price (Sep 2026) | Estimated settled ADR (Sep 2026) | Spread multiple | Observed properties | Occupancy (Jul 2026, est.) |
|---|---|---|---|---|---|
| Resort hotel | ¥40,700 | ¥13,200 | 3.08x | 7 | 85.1% |
| Ryokan | ¥34,600 | ¥13,700 | 2.51x | 44 | 80.5% |
| City hotel | ¥23,200 | ¥11,600 | 2.00x | 11 | 90.0% |
| Business hotel (limited-service) | ¥14,300 | ¥9,800 | 1.46x | 146 | 88.0% |
Source: created by the HotelBank Editorial Team from MetroEngines Research (occupancy is an estimate for July 2026. Business N=127 properties, city N=12 properties, resort N=6 properties, ryokan N=27 properties)
The spread multiple between listed price and estimated settled ADR runs 3.08x for resorts, 2.51x for ryokan, 2.00x for city hotels and 1.46x for limited-service — neatly ordered by category. The stratification of the spread seen at municipal level was, in effect, reflecting each area’s category mix.
Estimated July 2026 occupancy, meanwhile, runs 90.0% for city hotels, 88.0% for limited-service, 85.1% for resorts and 80.5% for ryokan — the reverse of the rate ordering. On a room-count basis the prefecture’s accommodation demand is anchored in business travel, while the onsen-tourism belt earns through rate. Ryokan occupancy sits relatively low because weekday demand is limited and demand concentrates on holidays and weekends, consistent with the 15pt holiday-versus-weekday gap seen in the previous section.
The strength guests reward — rooms with a private open-air bath in the Chichibu belt
Behind the onsen-tourism belt’s ability to hold high rates lies a clear product-level strength. Looking at guest reviews aggregated by the HotelBank Editorial Team (trailing 24 months) for mentions of “rooms with a private open-air bath,” seven properties in the prefecture were identified as matches, and the leaders were concentrated in the Chichibu area.
| Property | Mention rate | Mentions | Total reviews |
|---|---|---|---|
| Hoshine no Yado Baieru (星音の宿 ばいえる), Ogano Town | 12.5% | 24 | 192 |
| Chichibu Onsen Hananoya (ちちぶ温泉 はなのや), Chichibu City | 10.5% | 33 | 314 |
| Chichibu Ogano Onsen Ryokan Ryozanpaku (秩父小鹿野温泉旅館 梁山泊), Ogano Town | 6.9% | 12 | 173 |
| Wado Kosen Yu no Yado Wado (和銅鉱泉 ゆの宿 和どう), Chichibu City | 3.5% | 19 | 543 |
Source: HotelBank Editorial Team research (NLP analysis of guest reviews, trailing 24 months, the top four of the seven matching properties in the prefecture)
In every case the mentions appeared in positive contexts. Comments in the vein of “the room itself simply amazed us” are representative: the experiential value of the room is the axis on which these properties are judged. That the Chichibu area — within day-trip range of the Tokyo metropolitan area — can sustain room rates above ¥30,000 reads as a function of having productised a room experience that a day trip cannot substitute for.
The supply side — roughly 1,200 rooms added to the business belt in 2026
Supply movements matter to reading the rate tiers as well. Within the scope tracked by MetroEngines Research, nine new properties were confirmed in operation in Saitama Prefecture during 2026.
| Property | Category | Rooms | Confirmed |
|---|---|---|---|
| APA Hotel Saitama-Shintoshin Ekinishi (アパホテル〈さいたま新都心駅西〉) | Limited-service | 389 | June 2026 |
| APA Hotel Kumagaya-Ekimae Kita (アパホテル〈熊谷駅前北〉) | Limited-service | 245 | June 2026 |
| Toyoko Inn Tokorozawa-eki Nishiguchi (東横INN所沢駅西口) | Limited-service | 245 | February 2026 |
| Hotel Global View Urawa (ホテルグローバルビュー浦和) | Limited-service | 140 | February 2026 |
| APA Hotel Saitama Ageo-Ekimae (アパホテル〈埼玉上尾駅前〉) | Limited-service | 126 | June 2026 |
| HOTEL R9 The Yard Hanazono Inter | Limited-service | 49 | May 2026 |
| Grand March Base Higashimatsuyama (グランマーチBase東松山) | Cottage | 29 | February 2026 |
| Earthboat Saitama Kawajima | Cottage | 8 | April 2026 |
| LODGE URAWA | Rental villa | 1 | June 2026 |
Source: MetroEngines Research & Consulting (based on confirmed OTA listing, N=9 properties)
The six limited-service hotels total 1,194 rooms. Their locations — Saitama-Shintoshin, Kumagaya, Tokorozawa, Urawa, Ageo and Fukaya (Hanazono IC) — sit entirely within Tier B (the prefectural capital and regional hub belt) and Tier D (the northern Saitama business belt). It was, in short, the year Saitama’s major chains moved to thicken their capacity for business demand. The 389 rooms at Saitama-Shintoshin are large by prefectural standards in particular, a sign that the catchment potential of Omiya, Urawa and Saitama-Shintoshin treated as a single wide-area hub is being valued.
In 2025, 16 properties were confirmed, weighted toward smaller formats: alongside limited-service hotels, two ryokan (Yuyado Hanaizumi with 20 rooms and Yuyado Yaegaki with 10 rooms), capsule hotels, guesthouses and cottages. In Chichibu, APA Hotel Saitama Chichibu-Ekimae (63 rooms) was confirmed in October 2025, so limited-service product is beginning to enter the tourism belt as well. Adding room-only, lower-rate options to Chichibu’s largely ryokan-based product mix could widen the base for extending traveller length of stay.
On a building-confirmation-application basis, meanwhile, only three projects can be identified within Saitama Prefecture. Two of them (389 rooms in Shintoshin, Chuo Ward, Saitama City and 257 rooms in Tsukuba, Kumagaya City) appear to correspond to properties already open in the table above, and the remaining one is 121 rooms in Ekiminami, Honjo City (completed May 2025). Note that this is on a confirmation-application basis as of the survey date; counts and room numbers are expected to rise as further applications are filed, so it should be read as a floor for the currently confirmed pipeline.
All 35 areas by municipality
| Municipality | Tier | Listed price Sep 2026 | Listed price Oct 2026 | Sep to Oct | Estimated settled ADR Sep 2026 | Observed properties total / settled |
|---|---|---|---|---|---|---|
| Nagatoro Town | A. Chichibu / Okumusashi onsen-tourism | ¥53,599 | ¥49,282 | -8.1% | ¥20,107 | 9 / 4 |
| Minano Town | A. Chichibu / Okumusashi onsen-tourism | ¥47,751 | ¥54,373 | +13.9% | ¥18,898 | 6 / 3 |
| Ogano Town | A. Chichibu / Okumusashi onsen-tourism | ¥34,057 | ¥32,668 | -4.1% | ¥16,252 | 9 / 6 |
| Yokoze Town | A. Chichibu / Okumusashi onsen-tourism | ¥33,365 | ¥31,997 | -4.1% | ¥11,237※ | 6 / 2 |
| Chichibu City | A. Chichibu / Okumusashi onsen-tourism | ¥31,282 | ¥32,759 | +4.7% | ¥14,378 | 47 / 25 |
| Namegawa Town | A. Chichibu / Okumusashi onsen-tourism | ¥30,439 | ¥21,755 | -28.5% | ¥17,088※ | 4 / 1 |
| Chuo Ward (Saitama) | B. Prefectural capital & regional hub | ¥23,471 | ¥24,082 | +2.6% | ¥12,443 | 5 / 5 |
| Hanno City | E. Mid-size city & suburban | ¥22,550 | ¥21,112 | -6.4% | ¥12,110 | 9 / 6 |
| Hanyu City | D. Northern Saitama business hub | ¥21,478 | ¥21,246 | -1.1% | ¥12,023※ | 3 / 2 |
| Kawagoe City | B. Prefectural capital & regional hub | ¥19,079 | ¥18,434 | -3.4% | ¥11,875 | 21 / 11 |
| Omiya Ward | B. Prefectural capital & regional hub | ¥18,674 | ¥19,918 | +6.7% | ¥11,902 | 19 / 15 |
| Urawa Ward | B. Prefectural capital & regional hub | ¥18,611 | ¥20,529 | +10.3% | ¥12,455 | 6 / 4 |
| Tokorozawa City | B. Prefectural capital & regional hub | ¥18,447 | ¥18,388 | -0.3% | ¥12,584 | 7 / 4 |
| Higashimatsuyama City | E. Mid-size city & suburban | ¥16,315 | ¥16,221 | -0.6% | ¥12,277 | 6 / 4 |
| Wako City | C. Tokyo-adjacent commuter | ¥16,312 | ¥15,917 | -2.4% | ¥11,746 | 3 / 3 |
| Ageo City | E. Mid-size city & suburban | ¥16,216 | ¥17,237 | +6.3% | ¥10,589 | 5 / 5 |
| Kuki City | E. Mid-size city & suburban | ¥15,667 | ¥18,022 | +15.0% | ¥11,589 | 3 / 3 |
| Kawaguchi City | C. Tokyo-adjacent commuter | ¥15,452 | ¥13,747 | -11.0% | ¥10,002 | 12 / 8 |
| Gyoda City | D. Northern Saitama business hub | ¥14,802 | ¥14,872 | +0.5% | ¥7,979※ | 5 / 2 |
| Kasukabe City | E. Mid-size city & suburban | ¥14,494 | ¥13,721 | -5.3% | ¥11,184 | 7 / 4 |
| Koshigaya City | C. Tokyo-adjacent commuter | ¥14,219 | ¥14,592 | +2.6% | ¥9,223 | 8 / 5 |
| Honjo City | D. Northern Saitama business hub | ¥14,073 | ¥13,460 | -4.4% | ¥8,903 | 10 / 7 |
| Asaka City | C. Tokyo-adjacent commuter | ¥13,880 | ¥13,180 | -5.0% | ¥9,798 | 4 / 4 |
| Satte City | E. Mid-size city & suburban | ¥13,531 | ¥16,100 | +19.0% | ¥8,863 | 3 / 3 |
| Kazo City | D. Northern Saitama business hub | ¥13,351 | ¥13,351 | +0.0% | ¥7,191※ | 3 / 2 |
| Warabi City | C. Tokyo-adjacent commuter | ¥13,182 | ¥13,242 | +0.5% | ¥11,728※ | 3 / 2 |
| Kumagaya City | D. Northern Saitama business hub | ¥13,093 | ¥14,013 | +7.0% | ¥8,433 | 17 / 14 |
| Sayama City | E. Mid-size city & suburban | ¥13,085 | ¥13,079 | -0.0% | ¥8,490 | 5 / 3 |
| Tsurugashima City | C. Tokyo-adjacent commuter | ¥12,322 | ¥12,352 | +0.2% | ¥9,662 | 6 / 3 |
| Minami Ward (Saitama) | C. Tokyo-adjacent commuter | ¥12,309 | ¥13,188 | +7.1% | ¥8,969 | 3 / 3 |
| Soka City | C. Tokyo-adjacent commuter | ¥12,247 | ¥12,593 | +2.8% | ¥9,711 | 4 / 3 |
| Toda City | C. Tokyo-adjacent commuter | ¥11,874 | ¥11,856 | -0.2% | ¥9,356※ | 3 / 2 |
| Misato City | C. Tokyo-adjacent commuter | ¥11,656 | ¥11,575 | -0.7% | ¥9,313 | 3 / 3 |
| Iwatsuki Ward | C. Tokyo-adjacent commuter | ¥11,333 | ¥10,463 | -7.7% | ¥9,305※ | 8 / 1 |
| Fukaya City | D. Northern Saitama business hub | ¥11,260 | ¥11,454 | +1.7% | ¥7,907 | 10 / 8 |
Source: created by the HotelBank Editorial Team from MetroEngines Research (the 35 municipalities with three or more observed properties as of September 2026. ※ marks reference values where fewer than three properties underpin the estimated settled ADR)
Conclusion
Breaking Saitama’s accommodation market down by municipality brings three things into view.
First, the rate tiers look twice as steep or twice as flat depending on the metric. On listed price (all-plan average), the gap between top-ranked Nagatoro Town and bottom-ranked Fukaya City is 4.8x; on estimated settled ADR it narrows to 2.5x. This is not measurement error but a reflection of product structure — ryokan-type properties publish plans across a wide price band simultaneously. Which of the two you look at when benchmarking competitors can materially change how you read your own position.
Second, what the rate tiers actually reflect is category mix and rooms per property. Nagatoro Town runs roughly 18 rooms per property against Kumagaya City’s roughly 123 — about 7x — and the spread multiple lines up neatly by category, from 3.08x for resorts to 1.46x for limited-service. An area’s rate level is set not by location alone but by what kind of assets have accumulated there.
Third, autumn demand points in opposite directions by tier. With the five-day run of 19–23 September ahead of it, the onsen-tourism belt peaks in September and gives back 3.0% in October, while the business-led prefectural capital and Tokyo-adjacent belts rise 6.7% and 7.0% as weekdays return in October. Looking only at the prefecture-wide average, these opposing movements cancel out and disappear. There is practical value in drawing the monthly curve only after specifying the area and the guest segment.
2026 was also the year roughly 1,200 new rooms were added to the business belt. That is the result of the hub status of the prefectural capital and the north being highly valued, and the thicker the supply, the more it matters which demand each tier designs its product around. The onsen-tourism belt has a clear axis of evaluation in rooms with a private open-air bath; the business belt has a stable foundation in weekday demand. Starting from those respective strengths, there is considerable room to build differentiated pricing for holidays versus weekdays.
⚠ Note on prices for future dates: all figures in this article are based on an aggregation as of 2 August 2026. September and October 2026 fall after that aggregation date, so both listed prices and estimated settled ADR are estimates based on the selling prices published at the time of the survey. They shift as new plans are added and prices are adjusted closer to the check-in date. Prices set high at present may be adjusted downward at the last minute, and equally may rise as inventory is absorbed. Note too that in areas with thin coverage of three to six properties, the September-to-October change has been observed to move by more than ±10% between re-captures, so month-on-month changes for individual municipalities should be read as an indication of direction.
Related reading
- Japan Intra-Prefecture ADR Gaps Reach 5.2x: 368 Municipalities Ranked
- Hotel Investment in Japan’s “Second-Tier” Cities: ADR, Supply & Yield Across 5 Markets
- Chosen for the Water: Japan’s Top 30 Onsen Inns by Review Mentions
- Gunma Hotel Market 2026: Four ADR Tiers and a ¥5,700 Upper-Mid Gap
References and sources
■ Data sources
The base data is MetroEngines Research’s monthly area aggregation (Saitama Prefecture, by municipality, September 2024 to December 2026), covering the 35 municipalities that met the threshold of three or more observed properties as of September 2026. Listed price is the all-plan average (double occupancy, per-room rate, tax included); estimated settled ADR is the median across the covered properties after applying category-specific corrections. Remaining-inventory progression and occupancy are estimates based on OTA selling inventory. Review metrics are the HotelBank Editorial Team’s NLP analysis of guest reviews (trailing 24 months). The aggregation reference date is 2 August 2026.
■ Calculation assumptions
The five-tier classification is not an administrative division but a reconstruction based on observed rates and regional function (onsen tourism / prefectural capital and regional hub / mid-size city and suburban / northern Saitama business / Tokyo-adjacent commuter). Tier-level values are the median of the municipal values belonging to each tier, not a weighted average by property count. Spread multiple = listed price ÷ estimated settled ADR. Remaining-inventory progression covers only properties with observable inventory for each check-in date, with observed property counts at each point shown as a range. New supply treats confirmed commencement of OTA listing as “confirmed in operation,” which is not the opening date itself.
■ Limitations and caveats
Estimated settled ADR carries a median error of approximately 7.5% when cross-checked against disclosed results from a listed hotel REIT (Invincible Investment Corporation, 184 property-months, April–May 2026), and differs from each property’s actual transacted prices or accounting figures. Municipalities marked ※ are reference values, with fewer than three properties underpinning the estimated settled ADR. September and October 2026 are future dates relative to the aggregation reference date, and listed prices shift with each re-capture as new plans are added and prices revised. In areas with thin coverage of three to six properties in particular, the September-to-October change has been observed to move by more than ±10% depending on the capture date. Month-on-month changes for individual municipalities should be treated as an indication of direction and not used as definitive forecasts. Note also that the observation base within the prefecture expanded from 273 to 343 properties in June 2026, so trajectories spanning that point include a base-population effect.
■ Market data
- MetroEngines Research — listed price and estimated settled ADR for 35 municipalities in Saitama Prefecture (September 2024 to December 2026), pricing by property category, remaining-inventory progression and occupancy estimates
- MetroEngines Research & Consulting — newly opened properties (based on confirmed OTA listing; 16 in 2025, 9 in 2026)
- Prepared by MetroEngines Research & Consulting from the Ministry of Land, Infrastructure, Transport and Tourism “Building Construction Statistics Survey” (建築動態統計調査) — building plan pipeline within Saitama Prefecture (3 projects)
- HotelBank Editorial Team research — NLP analysis of guest reviews (trailing 24 months, mention analysis for rooms with a private open-air bath)
■ Public statistics and municipal materials
- Japan Tourism Agency, “Overnight Travel Statistics Survey”
- Saitama Prefecture, “Results of the Tourism Visitor Statistics Survey”
- Saitama City, “Tourism Data for Saitama City”
- Kawagoe City, “Kawagoe City Tourist Arrivals”
- Chocotabi Saitama, “Saitama Prefecture Tourism Statistics”
■ Validation basis for estimated settled ADR
- Cross-checked against Invincible Investment Corporation monthly operating results (184 property-months, April–May 2026), the median error of estimated settled ADR is approximately 7.5%