

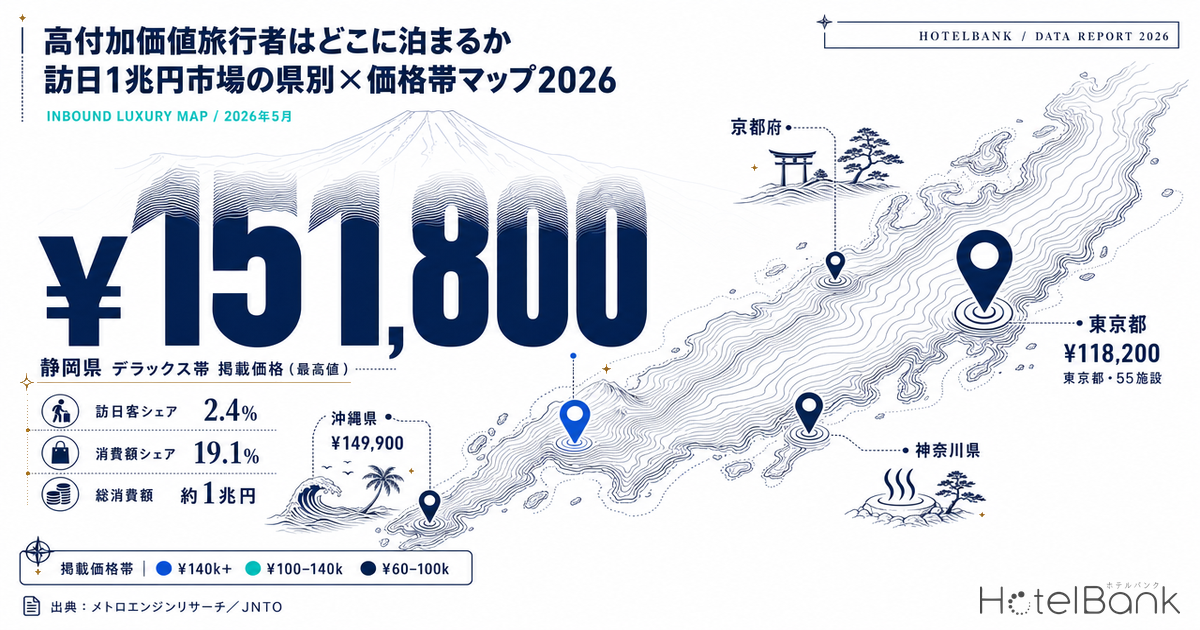
Among all inbound visitors to Japan, only about 590,000 qualify as “high-value travelers” — those who spend ¥1 million or more per trip. That is a mere 2.4% of all inbound visitors, yet their spending reaches roughly ¥1 trillion, accounting for 19.1% of total inbound consumption (both figures for 2023, Japan National Tourism Organization). Two percent of the headcount moves twenty percent of the money — and this extraordinarily concentrated demand is not spread evenly across the map of Japan. This article aggregates advertised prices in the deluxe band (the luxury-equivalent tier) by prefecture using OTA public price data from MetroEngines Research, and visualizes as a map the question of “which prefecture, and at which price band, do they stay?” Overlaying JNTO statistics and the trends discussed at Japan Luxury Showcase 2026, we read the geography of affluent demand.
Metric Definitions Used in This Article
- Advertised price (all-plan average, tax included): The average of sale prices publicly listed on OTAs. It is the per-room rate for double occupancy (tax included), averaged across all plans from room-only through meal-inclusive. It differs from actual transacted prices and structurally runs higher than transacted rates (partly because unsold high-priced plans remain listed on OTAs). The “luxury-band / deluxe-band prices” in this article are on this advertised-price basis; they represent the supply side’s price positioning rather than the actual transacted rate of any individual property.
- Deluxe band: The highest tier in the property category classification (deluxe). We use it as a proxy indicator for luxury-equivalent high-price supply.
- Estimated transacted ADR: The estimated transacted rate (tax-exclusive equivalent) for the resort category, referenced in part of the analysis. Cross-checked against property-level disclosures by listed hotel REITs, the median error is approximately 7%.
- Data source: MetroEngines Research (of the domestic properties tracked, approximately 27,000 properties confirmed as active on OTAs form the analysis universe)
- — High-value travelers are only 2.4% of inbound visitors, yet their spending of roughly ¥1 trillion accounts for 19.1% of total inbound consumption (2023, JNTO).
- — The price peak sits with destination resorts — Shizuoka (approx. ¥151,800) and Okinawa (approx. ¥149,900) — while the depth of supply concentrates in cities: Tokyo with 55 properties, Kyoto with 35. The “most expensive prefecture” and the “prefecture with the most choice” are not the same place.
- — Demand peaks diverge by prefecture: Okinawa peaks in summer (approx. ¥170,000 in July–August), while Kyoto and Tokyo peak in spring and autumn.
- — On actual transacted resort rates, regional prefectures such as Ehime, Kanagawa and Hiroshima rank at the top. White space for lifting price bands around experiential value remains in the regions.
A market where 2% of the people move 19% of the money
First, the contours of the market. According to JNTO, a high-value traveler is defined as a traveler whose in-country spending per trip to Japan is ¥1 million or more. In 2023 there were 590,000 such travelers, up 83.2% versus pre-pandemic 2019. Their share of all inbound visitors more than doubled, from 1.0% (2019) to 2.4%. Their spending reached ¥1.0 trillion (up 50.6% versus 2019), and their share of total inbound consumption expanded from 14.0% to 19.1%.
In other words, this market is a numerical minority that nonetheless pulls the whole forward through the sheer height of its per-trip spend. Because these travelers move in a different price zone from general visitors, understanding which prefecture and which price band they choose bears directly on both product design at the property level and destination readiness at the regional level. By market, China, the United States and Taiwan lead on both spending and headcount, and those three markets alone approach a majority of total spending. Taiwan in particular has recently taken the top position in inbound consumption; that nationality shift and its sensitivity to hotel pricing are analyzed in detail in Taiwan Tops Inbound Spending.
Source: JNTO “Estimates of the High-Value Travel Market” (2023), compiled by the HotelBank Editorial Team
| Market | Share of spending | Share of travelers |
|---|---|---|
| China | 23.0% | 24.6% |
| United States | 16.3% | 16.5% |
| Taiwan | 13.1% | 12.7% |
| Top 3 markets, total | approx. 52% | approx. 54% |
Source: JNTO “Estimates of the High-Value Travel Market” (2023), compiled by the HotelBank Editorial Team
The prefecture × price-band map — where does luxury supply sit, and at what price
The map below covers prefectures where a meaningful number of deluxe-band (luxury-equivalent) properties can be confirmed (three or more), showing the advertised price band by color and the depth of supply (number of properties) by circle size. The data are aggregated as of May 2026. What emerges at a glance is a structure in which the “price peak” and the “center of supply” sit in different places.
The highest advertised prices are found in Shizuoka (approx. ¥151,800) and Okinawa (approx. ¥149,900) — a super-premium band of the “destination” type, driven by auberge-style resorts in Izu and Atami and by beach resorts in Okinawa. Kyoto (approx. ¥119,900), Tokyo (approx. ¥118,200) and Kanagawa (approx. ¥107,300) follow in the low ¥100,000s. The color coding of the map makes visible how differently price is constructed in cities versus resorts.
Circle size = number of deluxe-band properties; color = advertised price band. Only prefectures with three or more deluxe-band properties are shown. Source: MetroEngines Research, compiled by the HotelBank Editorial Team
Note: In Tochigi, Nara, Shiga and Kumamoto, properties with advertised prices reaching ¥160,000–¥250,000 can also be confirmed, but each of these prefectures has only a single deluxe-band property, so they were excluded from the map as single-property signals. These levels reflect an individual property rather than a prefectural market rate.
“Height of price” and “depth of supply” are two different maps
When thinking about where affluent travelers stay, looking only at the height of price leads to the wrong judgment. Break the map down one further step and Shizuoka and Okinawa — the price peaks — have just 8 properties each, so the choice set itself is limited. Tokyo, by contrast, has 55 properties, Kyoto 35 and Osaka 24: on depth of supply, the cities dominate. The “prefecture offering the most expensive experience” and the “prefecture offering the most choice” do not coincide.
This gap translates into traveler behavior. For a one-off commemorative trip or a once-in-a-lifetime destination, single-showpiece locations such as Izu, Okinawa or Hakone are chosen; for multi-night stays, repeat visits and touring bases, cities with a wide choice set do the work. Seen from the destination side, the thinner the supply, the higher the “scarcity per property,” while cities operate inside a “competition to offer a full range of price bands” — the two charts show that even within the same affluent segment, the way to compete differs.
Advertised price (all-plan average, tax included) | Source: MetroEngines Research
Number of deluxe-band properties | Source: MetroEngines Research
Same affluent traveler, different destination by season
The price-band map is a still image, but actual demand moves with the seasons. Tracking the monthly trajectory of deluxe-band advertised prices shows that each prefecture has a clearly distinct “earning season.” Okinawa peaks in summer: in both of the past two years, advertised prices jumped to ¥150,000–¥170,000 in July and August. This is the classic pattern of seaside resort demand concentrating in particular months.
Kyoto and Tokyo, by contrast, form peaks in autumn (October–November) and spring (March–April). Kyoto exceeds ¥135,000 in April during cherry-blossom season (April 2026) and rises to around ¥120,000 in the October–November foliage season. This is the shape of high-value travelers whose purpose is culture and landscape gathering in cities with pronounced seasonality. Even where the map shows “equally high-priced prefectures,” the demand calendar is an entirely different thing. The two charts below show Okinawa’s year-on-year comparison (summer peak) and the trailing 12 months for three prefectures (divergence in peak timing).
Okinawa, deluxe-band advertised price (all-plan average, tax included), year-on-year comparison | Source: MetroEngines Research
Three prefectures, deluxe-band advertised price (all-plan average, tax included), trailing 12 months | Source: MetroEngines Research
Regional headroom seen through actual leisure-band rates
So far we have looked at deluxe-band advertised prices — the supply side’s positioning. Lining up estimated transacted ADR (tax-exclusive equivalent) for the resort category by prefecture, as a measure closer to real demand, produces a different map again. Ehime (approx. ¥30,600), Kanagawa (approx. ¥26,800), Hiroshima (approx. ¥24,600), Hyogo (approx. ¥22,200), Kyoto (approx. ¥21,800), and Mie and Aomori (approx. ¥21,000) come out on top. It is worth noting that beyond the big-city names, onsen and scenic resorts of the Seto Inland Sea, northern Tohoku and central Japan show real presence on transacted rates.
This is where the trends discussed at Japan Luxury Showcase 2026 connect. The 2026 edition was held for the first time in Osaka (Waldorf Astoria Osaka), with 40 luxury travel companies from Europe, North America, Australia and Singapore taking part. What overseas buyers said pointed to interest shifting from “prestigious accommodation” toward “special experiences available nowhere else”: samurai experiences and iaido, Ainu cultural guides, private tours of Koyasan, sake-brewery visits, regional art — demand for experiences that cannot be templated and can only be had in that particular place. The timing was also moved from the traditional February to May, in the green season, with seasonal dispersion and regional visitor attraction in mind.
The more experiential value becomes the axis of luxury, the more room there is for high-value demand to flow to regions beyond the price-peak cities and famous resorts. Regional resort prefectures that hold their own on transacted rates have room to grow by combining experiential content to lift their price band — that is the direction this body of data points toward. The white space lies in prefectures “where high-price supply is still thin, but real demand and experiential assets exist.” Kanazawa is one such area, where the gap in high-value supply looks set to be filled by the coming development pipeline.
Resort category, estimated transacted ADR (tax-exclusive equivalent, May 2026), leading prefectures | Source: MetroEngines Research
| Prefecture | Deluxe-band advertised price | Deluxe-band properties | Resort estimated transacted ADR | Type |
|---|---|---|---|---|
| Shizuoka | ¥151,800 | 8 | ¥18,500 | Destination resort |
| Okinawa | ¥149,900 | 8 | ¥16,400 | Destination resort |
| Kyoto | ¥119,900 | 35 | ¥21,800 | City + culture |
| Tokyo | ¥118,200 | 55 | ¥12,900 | City (largest supply) |
| Kanagawa | ¥107,300 | 10 | ¥26,800 | City + Hakone resort |
| Aichi | ¥78,800 | 4 | ¥12,900 | City |
| Chiba | ¥73,200 | 8 | ¥17,100 | Suburban resort |
| Hokkaido | ¥67,700 | 14 | ¥14,800 | Wide-area resort |
| Osaka | ¥51,600 | 24 | ¥16,700 | City |
Advertised prices and property counts are as of May 2026. Resort estimated transacted ADR is for the same month, tax-exclusive equivalent. Source: MetroEngines Research
Appendix: listed REIT operating results point to resilience in the luxury band
Let us confirm the resilience of demand against external data. Referencing a single data point from the monthly operating results of listed hotel REITs that include resort assets: Hoshino Resorts REIT (星野リゾート・リート投資法人, 3287) posted ADR of approximately ¥23,000 and occupancy of 80.1% for May 2026 (as of May 2026, Hoshino Resorts REIT portfolio), both up year on year (ADR +2.4%, occupancy +1.4pt). This is the performance of one specific portfolio and does not represent the market as a whole, but it serves as one piece of corroborating evidence that operations in the high-value band built around experiential value are running ahead of the prior year. Monthly disclosures from the seven listed hotel REITs — Ichigo Hotel REIT (いちごホテルリート投資法人, 3463), Invincible Investment (インヴィンシブル投資法人, 8963), Japan Hotel & Residential Investment (日本ホテル&レジデンシャル投資法人, 3472), Japan Hotel REIT (ジャパン・ホテル・リート投資法人, 8985), Hoshino Resorts REIT (星野リゾート・リート投資法人, 3287), Mori Trust REIT (森トラストリート投資法人, 8961) and Kasumigaseki Hotel REIT (霞ヶ関ホテルリート投資法人, 401A) — are useful as a supplementary line for reading demand trends by region and property type.
Conclusion — read the geography of affluent demand as both “points” and “planes”
Plotting the ¥1 trillion inbound market onto a prefecture × price-band map reveals three structures. First, the price peak sits with destination resorts such as Shizuoka and Okinawa, while the depth of supply concentrates in the cities of Tokyo, Kyoto and Osaka: the “most expensive prefecture” and the “prefecture with the most choice” are different things. Second, even among equally high-priced prefectures the demand calendar differs, with Okinawa peaking in summer and Kyoto and Tokyo in spring and autumn. Third, regional prefectures that hold their own on transacted resort rates have room to grow by tying price bands to experiential content.
The shift “from prestige to experience” signaled by Japan Luxury Showcase 2026 is likely to move this geography further. Affluent demand should be read both as the “points” of single-showpiece luxury and as the “planes” of a full range of price bands; for regions and properties alike, building product design suited to their respective position is the path to capturing opportunity within this ¥1 trillion market.
Further Reading
- Minpaku Hits 10% of Inbound Stays: Kyoto, Okinawa, Tokyo Analysis
- Taiwan Tops Inbound Spending: Q1 2026 ¥2.3T Shift and Hotel ADR Sensitivity
- China-Dependency Proxy: An Inbound ADR Resilience Map of 5 Markets
References and Sources
■ Data sources
Public advertised prices for approximately 27,000 properties confirmed as active on OTAs, among the domestic properties tracked by MetroEngines Research, aggregated by prefecture for the top property category (deluxe band) and the resort category (as of May 2026). The size and composition of the high-value travel market reference JNTO’s “Estimates of the High-Value Travel Market” (2023).
■ Calculation assumptions
Advertised prices are all-plan averages for double occupancy (tax included) and represent the supply side’s price positioning. The prefectural map covers only prefectures with three or more deluxe-band properties; single-property signals are excluded. Resort estimated transacted ADR is on a tax-exclusive-equivalent basis, with a median error of approximately 7% when cross-checked against property-level disclosures by listed hotel REITs.
■ Limitations and caveats
Advertised prices differ from actual transacted rates and structurally run higher (in part because unsold high-priced plans remain listed). Monthly REIT results are figures for a specific portfolio and do not represent the market as a whole. Prefectures are administrative divisions and do not necessarily coincide with demand areas (Izu = Shizuoka, Hakone = Kanagawa, and so on).
- JNTO, “High-value inbound travel market posts sharp gains in both spending and traveler numbers” (June 11, 2025)
- Japan Tourism Agency, “Promoting the attraction of high-value travelers to Japan”
- JNTO, “Promotion of high-value travel”
- Honichi Lab, “What do affluent travelers seek in Japan? Overseas buyers speak — covering JNTO’s Japan Luxury Showcase 2026” (June 24, 2026)
- Hoshino Resorts REIT (星野リゾート・リート投資法人, 3287), monthly operating status (May 2026)
- MetroEngines Research — OTA public price data (deluxe-band and resort-category aggregation by prefecture, as of May 2026)