

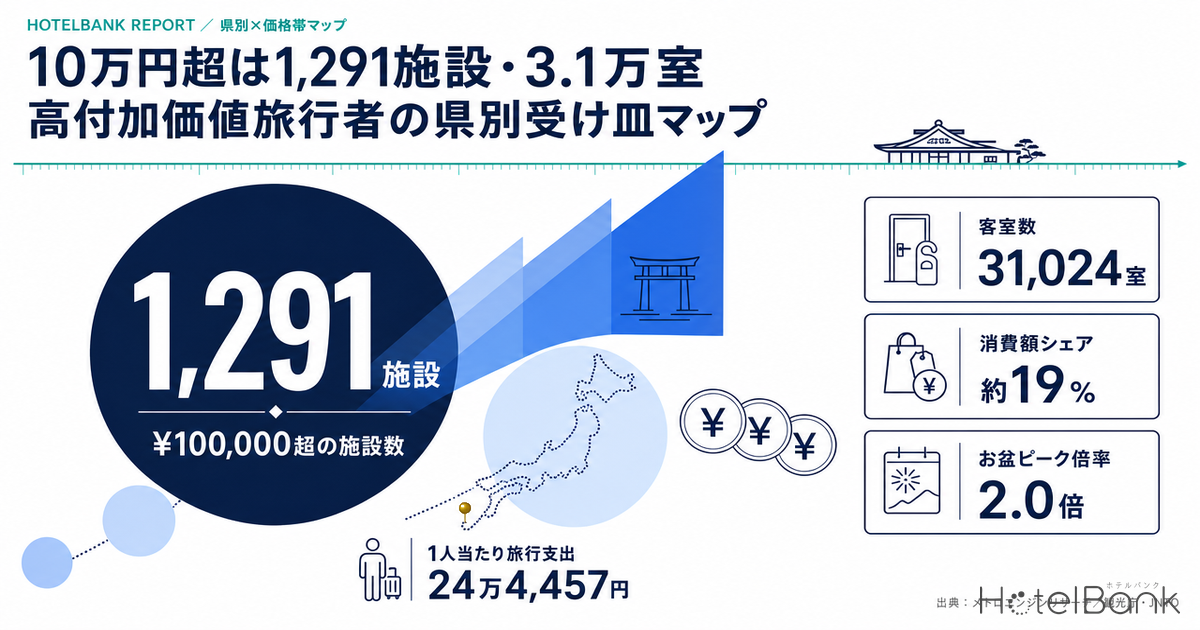
Inbound arrivals to Japan reached 21.08 million in the first half of 2026, down 2.0% year on year and effectively flat. Travel spending per visitor, however, rose to ¥244,457 (April–June 2026, +3.3% YoY), and market attention is shifting from headcount to yield. The clearest symbol of that shift is the high-value traveler — someone who spends ¥1 million or more per trip. They account for only about 2% of inbound visitors, yet roughly 19% (about ¥1 trillion) of total spending. This article maps where the supply that can accommodate them actually sits today, by prefecture and by price band, using published price data.
Metric Definitions Used in This Article
- ADR (Average Daily Rate): An estimated settled rate (tax-exclusive equivalent) calculated by applying property-type correction coefficients to the lowest published plan level each property lists on OTAs and similar channels (double occupancy, per-room rate, tax-inclusive). Cross-checked against property-level actuals disclosed by listed hotel REITs (91 properties, most recent 3 months), the median error is approximately 7%. These are estimates and differ from each property’s actual transacted prices and accounting figures. Area-level ADR is the median of the target properties (the level of a typical property in that area).
- Price band: The price bands used in the prefecture map in this article are based on listed prices. For each property, the listed prices for the target dates (average across all plans, double occupancy, per-room rate, tax-inclusive) are averaged, and properties are classified into five bands at that level: ¥150,000 and above / ¥100,000–150,000 / ¥60,000–100,000 / ¥30,000–60,000 / under ¥30,000. Because the basis differs from estimated settled ADR, the two sets of figures should not be compared directly.
- High-value traveler: A traveler whose total spending per inbound trip (excluding international airfare) is ¥1 million or more (Japan Tourism Agency definition).
- Data sources: MetroEngines Research (aggregation of published price data), Japan Tourism Agency and Japan National Tourism Organization (JNTO) statistics, HotelBank Editorial Team research (analysis of guest reviews)
- — Properties with listed prices above ¥100,000 number 1,291 nationwide, with 31,024 rooms. On a room basis that is 2.1%; widening the threshold to ¥60,000 and above still yields only 8.2% (September 16–17, 2026 check-in, N=31,604 properties).
- — 63.5% of those rooms (19,700) are concentrated in Tokyo, Kyoto, Okinawa, Osaka and Kanagawa. Tokyo alone accounts for 10,381 rooms, or 33.5% of the national total.
- — By property count, Okinawa (126), Kyoto (110) and Hokkaido (106) all exceed Tokyo (77), yet rooms per property run 134.8 in Tokyo versus 11.6 in Nagano and 11.5 in Hokkaido. Regional capacity is plentiful in number but small in scale.
- — The 26 prefectures tied to the 14 model tourism destinations hold 706 properties and 9,929 rooms — 0.96 times Tokyo’s 10,381 rooms. More than nine times the property count, but roughly the same room count.
- — At the Obon peak (August 14–16), the above-¥100,000 band expands to 2,571 properties and 59,520 rooms — 2.0 times the property count and 1.9 times the room count of the normal period. The ceiling price has real-world backing.
21.08 Million in the First Half: Yield Grew Faster Than Headcount
According to Japan National Tourism Organization (JNTO) estimates, inbound arrivals in June 2026 were 3,148,600, down 6.8% year on year, bringing the January–June cumulative total to 21,084,800 (down 2.0% YoY). While that marked the third consecutive month below the prior year, 15 markets including South Korea, Taiwan, the United States and India posted record highs for the month of June — the picture varies sharply by market.
The value side moved in the opposite direction. The Japan Tourism Agency’s Consumption Trend Survey for Foreign Visitors (April–June 2026, first preliminary figures) put total spending at ¥2.5096 trillion and per-visitor travel spending at ¥244,457, up 3.3% year on year, with the United States overtaking China as the largest market by spending. Even as growth in visitor numbers pauses, room to grow through yield clearly remains.
Within that picture, the Middle East deserves attention. In JNTO’s classification, the Middle East comprises Israel, Turkey and the six GCC countries (Saudi Arabia, the UAE, Bahrain, Oman, Qatar and Kuwait). June 2026 recorded 22,600 arrivals, up 29.7% year on year and a record for the month of June. May reached 39,000 (up 67.8%), an all-time single-month high. Look at the composition, however, and May’s growth was driven by Turkey at 24,300 (up 160%) and Israel at 11,100 (up 28.7%), while the six GCC countries accounted for 3,600 (down 31.8%). The accurate reading is that the Middle East is a growth market setting records as a region, and that GCC guests within it are still small in volume — a segment with substantial room to build from here.
| Category | May 2026 | YoY | June 2026 | YoY |
|---|---|---|---|---|
| Middle East, total | 39,000 | +67.8% | 22,600 | +29.7% |
| of which Turkey | 24,300 | +160% | — | — |
| of which Israel | 11,100 | +28.7% | — | — |
| of which the six GCC countries | 3,600 | -31.8% | — | — |
| Total inbound arrivals | approx. 3.56 million | — | 3,148,600 | -6.8% |
Source: Compiled by the HotelBank Editorial Team from Japan National Tourism Organization (JNTO) “Inbound Visitor Arrivals” and JETRO Business Briefs (Middle East breakdown). June country-level detail is shown only to the extent confirmable in published materials
The “2% for 19%” Segment and the Policy Design of Regional Dispersion Phase 2
The Japan Tourism Agency defines a high-value traveler as one who spends ¥1 million or more per inbound trip (excluding international airfare). As of 2023 they numbered only about 2% of all inbound visitors (roughly 590,000 people) yet accounted for about 19% of spending (approximately ¥1 trillion). Against an overall average of ¥244,457 per person, this segment carries roughly four times the yield or more.
The center of gravity in policy has shifted to how to route this segment into the regions. Under its program for “building high-value inbound tourism destinations in the regions,” the Japan Tourism Agency has designated 14 model tourism destinations: Eastern Hokkaido; Hachimantai and surrounding areas; Yamagata; Nasu and surrounding areas; Sado and Niigata; Hokuriku; the Mt. Fuji foothills; Matsumoto and Takayama; Ise-Shima and surrounding areas; the Kii Mountain Range and surrounding areas; Setouchi; Tottori and Shimane; Kagoshima, Aso and Unzen; and Okinawa and Amami. In addition, the Fifth Basic Plan for Promoting a Tourism-Oriented Country (fiscal 2026–2030), approved by Cabinet decision on March 27, 2026, sets targets of 60 million inbound travelers and ¥15 trillion in spending by 2030, and newly adds a target for overnight stays in regional areas. On the funding side, the International Tourist Tax rose from ¥1,000 to ¥3,000 per person for departures from July 1, 2026, positioned as a revenue source for overtourism countermeasures and for regional attraction and demand dispersion.
Actual lodging patterns point the same way. According to the Japan Tourism Agency’s Overnight Travel Statistics Survey, of the 15.36 million foreign guest nights recorded in April 2026, the three major metropolitan areas’ share fell from 69.2% a year earlier to 66.2%, while regional areas rose three points from 30.8% to 33.8%. Dispersion is visible in the numbers. The remaining question is straightforward: how many rooms capable of receiving high-value travelers exist, and in which prefectures?
Prefecture × Price Band Map: 1,291 Properties and 31,024 Rooms Above ¥100,000
Within the scope covered by MetroEngines Research, listed prices (average across all plans, double occupancy, per-room rate, tax-inclusive) were aggregated by property for check-in on September 16–17, 2026 (Wednesday–Thursday), a typical weekday in a normal demand period. The sample comprises 31,604 properties and 1,464,982 rooms across all 47 prefectures for which prices could be confirmed. Splitting these by price band, 1,291 properties with 31,024 rooms fall into the ¥100,000-and-above band, and 2,947 properties with 88,849 rooms into the ¥60,000–100,000 band. On a room basis, ¥100,000 and above represents 2.1% of the total, and even widening to ¥60,000 and above yields only 8.2%. The high-price tier remains a scarce layer within Japan’s lodging supply. Note that the sample is limited to properties whose prices can be confirmed on OTAs and similar channels; ryokan, minshuku and simple lodging houses not listed on OTAs are excluded.
Source: Compiled from MetroEngines Research and HotelBank Editorial Team data (September 16–17, 2026 check-in, listed-price basis, N=31,604 properties)
The concentration is unmistakable on a room-count basis. Tokyo holds 10,381 rooms, or 33.5% of the national total, followed by Kyoto at 2,952, Okinawa at 2,910, Osaka at 1,803 and Kanagawa at 1,654. The top five prefectures total 19,700 rooms, or 63.5% nationwide. In other words, roughly two-thirds of all rooms above ¥100,000 sit in Tokyo, Kyoto, Okinawa, Osaka and Kanagawa. Structurally, when high-value travelers visit the regions, these areas still tend to serve as the base for their stay.
| Price band (listed price, double occupancy, tax-incl.) | Properties | Rooms | Room share | Rooms per property |
|---|---|---|---|---|
| ¥150,000 and above | 502 | 13,547 | 0.9% | 27.0 |
| ¥100,000–150,000 | 789 | 17,477 | 1.2% | 22.2 |
| ¥60,000–100,000 | 2,947 | 88,849 | 6.1% | 30.1 |
| ¥30,000–60,000 | 8,712 | 318,604 | 21.7% | 36.6 |
| Under ¥30,000 | 18,654 | 1,026,505 | 70.1% | 55.0 |
Source: Compiled from MetroEngines Research and HotelBank Editorial Team data (September 16–17, 2026 check-in, all 47 prefectures, N=31,604 properties / 1,464,982 rooms)
Properties in the Regions, Rooms in the Cities — What Rooms per Property Reveals
Separating property count from room count brings the shape of regional high-price supply into focus. By property count in the above-¥100,000 band, Okinawa has 126, Kyoto 110, Hokkaido 106, Kanagawa 99, Shizuoka 93, Nagano 82 and Chiba 82 — several prefectures exceed Tokyo’s 77. Rooms per property, however, differ sharply: 134.8 in Tokyo, 100.9 in Aichi, 85.9 in Osaka and 48.6 in Fukuoka, versus 26.8 in Kyoto, 23.1 in Okinawa, 16.7 in Kanagawa, 13.2 in Shizuoka, 11.6 in Nagano, 11.5 in Hokkaido and 3.7 in Chiba.
That gap shows that the regional high-price tier has grown up in the form of small ryokan, whole-house rentals and villas. It serves small parties well, but a single property cannot easily accommodate a group traveling with an entourage, or an itinerary that needs several rooms secured together. The question in regional dispersion phase 2 can therefore be restated: not whether high-rate properties exist, but whether they can be bundled into meaningful room counts. Coordinated guest routing across multiple properties within a region, and a rethink of room scale at existing properties, follow naturally from this structure. Where regional-style supply that sustains high rates on a small number of rooms has taken shape is set out in our analysis of Japan’s adventure tourism luxury market, organized around Niseko and Koyasan.
Source: Compiled from MetroEngines Research and HotelBank Editorial Team data (bubble size = rooms in the above-¥100,000 band, top 22 prefectures)
The High-Price Tier Doubles in Peak Season — Normal Period vs. the Obon Peak
Price bands are not fixed. Applying the same method to check-in on August 14–16, 2026, the Obon peak, the above-¥100,000 band expands to 2,571 properties and 59,520 rooms — 2.0 times the property count and 1.9 times the room count of the normal period’s 1,291 properties and 31,024 rooms. By prefecture, Okinawa moves from 126 properties to 266, Shizuoka from 93 to 238 and Nagano from 82 to 190.
This means that when demand concentrates, many properties can lift pricing into the high-price band — in other words, the ceiling price at regional resorts has real-world backing. Conversely, the thinness of the high-price tier in normal periods can be read as ample remaining room in product design capable of sustaining high rates year-round. High-value travelers do not necessarily move in step with long holiday weekends; off-peak demand is where this segment offers the greatest upside.
Source: Compiled from MetroEngines Research and HotelBank Editorial Team data (normal period = September 16–17, 2026; peak period = August 14–16, 2026 check-in)
Prefecture Positioning Seen Through Price-Band Composition
The shape of each prefecture’s capacity reads more clearly when converted into price-band composition on a room basis. In Okinawa, the ¥60,000-and-above bands account for 18.3% of rooms — the most high-value-oriented composition among the major prefectures. Tokyo follows at 14.7%, Yamanashi at 13.2%, Nagano at 12.1% and Kyoto at 9.6%. Osaka, by contrast, stands at 4.8%, Fukuoka at 3.7% and Aichi at 5.4%, with compositions weighted toward the urban mid-price and economy bands.
The difference is one of role, not of merit. Osaka, Fukuoka and Nagoya carry volume as nodes for wide-area movement, while Okinawa, Kyoto, the Mt. Fuji foothills and Shinshu carry yield as stay destinations. Assuming high-value travelers tour multiple regions, the two work in combination. When reading the prefecture map, the more practical framing is not “which prefectures have a thin high-price tier” but “which role each prefecture is strong in.”
Source: Compiled from MetroEngines Research and HotelBank Editorial Team data (composition on a room basis, September 16–17, 2026 check-in, listed-price basis)
Language and Dietary Support — Depth as Reflected in Guest Reviews
Price bands alone cannot describe capacity. Receiving high-yield demand from overseas requires language and dietary support to come with it. The HotelBank Editorial Team analyzes guest reviews and aggregates, by property, mentions that touch on “service in English.” Breaking the national top 100 properties over the most recent 24 months (3,235 mentions in total) down by prefecture yields Tokyo 39, Kyoto 12, Osaka 7, Gifu 7, Kanagawa 7, Chiba 5, Hokkaido 3 and Gunma 3.
A concentration in urban areas is natural, but Gifu’s seven properties are telling. Inns in the post towns of the Nakasendo and in the Hida area rank highly, overlapping with the context of the Matsumoto–Takayama model destination. By mention rate, regional inns line up: Yurari Rokumyo in Oita (22.96%), Uchi Matsushima Guest House in Miyagi (20.47%), Izu Ito Onsen Yokikan in Shizuoka (9.47%), Uno Port Inn in Okayama (9.43%), Kusatsu Onsen Yado Nagataya in Gunma (7.69%), Shukubo Ekoin in Wakayama (6.13%) and Magome Chaya in Gifu (5.71%). Small as they are in scale, inns discussed in terms that overseas guests use are emerging across the country — an encouraging foundation for regional attraction. Mentions of language support are themselves scarce and geographically skewed, a pattern that shapes how thin this layer really is.
Source: HotelBank Editorial Team research (analysis of guest reviews, most recent 24 months, national top 100 properties / 3,235 mentions in total)
On dietary support, the observable range is still limited. Aggregating mentions that touch on halal support by the same method yields just 69 properties and 70 mentions nationwide, distributed as Tokyo 13, Osaka 9, Kanagawa 8, Kyoto 6 and Hokkaido 4 — roughly one mention per property. What matters here is that this measures “how often guests mentioned it in reviews,” not whether a property actually offers the service. A property may well provide meals suited to Muslim travelers, yet if the topic never comes up in reviews it will not appear in the figures. Given that the GCC market is still at the stage of building volume, this is an area with considerable room to communicate what is on offer and to make it visible in guests’ own words.
Counting the Capacity of the 14 Model Tourism Destinations
Summing the above-¥100,000 band across the 26 prefectures tied to the 14 model tourism destinations set out in policy gives 706 properties and 9,929 rooms. That is roughly the same scale as Tokyo alone, at 77 properties and 10,381 rooms (0.96 times). More than nine times the property count, yet on par with a single metropolis in room count. The “many but small” structure of regional high-value capacity appears in the same form at the level of the policy areas.
| Model tourism destination | Related prefectures | Properties above ¥100k | Rooms | Per property | Properties ¥60k–100k |
|---|---|---|---|---|---|
| Okinawa and Amami | Okinawa | 126 | 2,910 | 23.1 | 206 |
| Mt. Fuji foothills | Yamanashi, Shizuoka | 133 | 1,657 | 12.5 | 356 |
| Eastern Hokkaido | Hokkaido | 106 | 1,216 | 11.5 | 191 |
| Matsumoto and Takayama | Nagano, Gifu | 99 | 1,112 | 11.2 | 282 |
| Kii Mountain Range and surrounding areas | Wakayama, Nara | 36 | 556 | 15.4 | 65 |
| Setouchi | Hiroshima, Okayama, Kagawa, Ehime | 47 | 465 | 9.9 | 115 |
| Kagoshima, Aso and Unzen | Kagoshima, Kumamoto, Nagasaki | 41 | 435 | 10.6 | 132 |
| Ise-Shima and surrounding areas | Mie | 20 | 359 | 17.9 | 60 |
| Hokuriku | Ishikawa, Toyama, Fukui | 35 | 333 | 9.5 | 90 |
| Nasu and surrounding areas | Tochigi | 22 | 303 | 13.8 | 66 |
| Sado and Niigata | Niigata | 17 | 288 | 16.9 | 42 |
| Hachimantai and surrounding areas | Iwate, Akita | 8 | 123 | 15.4 | 16 |
| Yamagata | Yamagata | 8 | 103 | 12.9 | 20 |
| Tottori and Shimane | Tottori, Shimane | 8 | 69 | 8.6 | 45 |
| 14 destinations, 26 related prefectures, total | — | 706 | 9,929 | 14.1 | 1,686 |
| (Reference) Tokyo | — | 77 | 10,381 | 134.8 | 150 |
Source: Japan Tourism Agency, “Building High-Value Inbound Tourism Destinations in the Regions” (classification of model tourism destinations) / compiled from MetroEngines Research and HotelBank Editorial Team data (September 16–17, 2026 check-in, listed-price basis). Because model destinations span multiple prefectures, figures are approximate totals aggregated at the related-prefecture level
Where ADR Stands — Okinawa Up 15.8% Year on Year
Alongside the price bands of available capacity, it is worth checking the standard level across each area as a whole. Comparing estimated settled ADR for June 2026 (the median of target properties in each prefecture) with the same month a year earlier, Okinawa rose 15.8%, from about ¥9,800 to about ¥11,400 — the clearest gain among the major prefectures. Fukuoka was up 0.4% and Hokkaido up 0.1%, essentially flat, while Tokyo fell 3.9%, Kyoto 8.6% and Osaka 32.3%. Osaka’s decline includes the special factor of a rebound from major event demand in the prior year, so the level itself should be assessed with caution.
The ADR here reflects the standard level of properties within each prefecture, not a figure isolated to the high-price tier. Even so, two facts point in the same direction: Okinawa skews high-value in its price-band composition (¥60,000 and above accounts for 18.3% of rooms) and its standard level is rising as well. In markets where high-price product has accumulated, the prefecture-wide level is pulled up with it.
Source: Compiled from MetroEngines Research and HotelBank Editorial Team data (estimated settled ADR, median of target properties in each prefecture. N=1,137 properties in Tokyo, 588 in Kyoto, 505 in Okinawa, and others)
Conclusion: Three Opportunities Visible in the Market Map
First, rooms priced above ¥100,000 form a scarce layer — 31,024 nationwide, or 2.1% on a room basis — and 63.5% of them sit in Tokyo, Kyoto, Okinawa, Osaka and Kanagawa. In designing itineraries for high-value travelers, these five prefectures are indispensable as a base, and at the same time unmet demand remains widely outside them.
Second, the regional high-price tier is well developed in property count but characterized by small scale, at 10 to 25 rooms per property. Meeting itineraries that require blocks of rooms calls for approaches such as coordination among multiple properties within a region and a rethink of room composition. The fact that the 26 prefectures tied to the 14 model tourism destinations total 9,929 rooms — roughly the same as Tokyo alone — indicates how much headroom there is.
Third, the high-price tier nearly doubles in peak season. The ceiling price has real-world backing, and refining product design for normal and off-peak periods is the shortest path to higher yield. Mentions of language support are spreading to small regional inns, and dietary support still has considerable room to be made visible through communication. With new markets including the Middle East setting regional records, the return on investment in building capacity is improving.
⚠ Note on prices for future dates: The price-band map in this article is an estimate compiled from sale prices published on OTAs and similar channels at the time of the survey, for check-in on September 16–17 and August 14–16, 2026. Because plans are added and prices revised as the check-in date approaches, the distribution across price bands will change going forward. Please note that properties currently classified in a high-price band may move to a lower band through last-minute price adjustments, and vice versa.
Related Reading
- Five ASEAN and Indian Markets Hit Record Highs in May 2026 — Halal and Vegetarian Support in a Regional Dispersion Strategy
- Japan’s Adventure Tourism Luxury Market: The Regionally Dispersed Luxury Tier Formed by Niseko and Koyasan, and the White Spaces
- In the Era of a 10% Vacation-Rental Share, Which Price Bands and Guest Segments Does Distributed Supply Absorb? — Tested in Kyoto, Okinawa and Tokyo
References and Sources
■ Data sources
MetroEngines Research aggregation of published price data (price-band distribution = check-in on September 16–17 and August 14–16, 2026, all 47 prefectures, N=31,604 properties / 1,464,982 rooms; estimated settled ADR = median of target properties in each prefecture, as of June 2026, N=1,137 properties in Tokyo, 588 in Kyoto, 505 in Okinawa), published statistics from the Japan Tourism Agency and the Japan National Tourism Organization (JNTO), and HotelBank Editorial Team analysis of guest reviews (most recent 24 months; mentions of English-language support cover the top 100 properties with 3,235 mentions in total, and mentions of halal support cover 69 properties with 70 mentions in total).
■ Calculation assumptions
Price bands are derived by averaging each property’s listed prices for the target dates (average across all plans, double occupancy, per-room rate, tax-inclusive) and classifying properties into five bands: ¥150,000 and above / ¥100,000–150,000 / ¥60,000–100,000 / ¥30,000–60,000 / under ¥30,000. Because the basis differs from estimated settled ADR, the two should not be compared directly. Rooms per property is the room count in the relevant band divided by the property count, and prefecture positioning is calculated as composition on a room basis. Because model tourism destinations span multiple prefectures, totals are approximations aggregated at the related-prefecture level, with prefectures tied to more than one destination counted only once.
■ Limitations and caveats
The sample is limited to properties whose prices can be confirmed on OTAs and similar channels; ryokan, minshuku and simple lodging houses not listed on OTAs are excluded. Listed prices for future dates change as plans are added and prices revised up to the check-in date, so the distribution across price bands may shift. Review-derived tallies of language and dietary support measure “how often guests mentioned the topic in reviews,” not whether a property actually offers the service. Estimated settled ADR is an estimate and differs from each property’s actual transacted prices and accounting figures.
■ Market data
- MetroEngines Research — aggregation of published price data (price-band distribution: check-in on September 16–17 and August 14–16, 2026, N=31,604 properties / 1,464,982 rooms; estimated settled ADR: all 47 prefectures, January 2025 to June 2026)
- HotelBank Editorial Team research — analysis of guest reviews (most recent 24 months; mentions of English-language support across the top 100 properties with 3,235 mentions in total, and mentions of halal support across 69 properties with 70 mentions in total)
■ Government statistics and policy documents
- Japan National Tourism Organization (JNTO), “Inbound Visitor Arrivals (June 2026 estimates)”
- Japan Tourism Agency, “Consumption Trend Survey for Foreign Visitors to Japan, April–June 2026 (first preliminary figures)”
- Japan Tourism Agency, “Promoting the Attraction of High-Value Travelers to Japan” (the 14 model tourism destinations and the 2% / 19% figures)
- Japan Tourism Agency, “Basic Plan for Promoting a Tourism-Oriented Country” (Fifth Plan, Cabinet decision of March 27, 2026)
- Japan Tourism Agency, “Overnight Travel Statistics Survey” (guest nights, share of the three major metropolitan areas vs. regional areas)
■ News and related coverage
- JETRO Business Briefs, “Inbound arrivals from the Middle East in May up roughly 70% year on year, a record single month, driven by a sharp increase from Turkey” (July 2026)
- Travel Voice, “Inbound arrivals in June 2026 down 6.8% year on year at 3.15 million” (July 15, 2026)
- Travel Voice, “Inbound spending edges up to ¥2.5 trillion in April–June 2026; the United States overtakes China as the top market” (July 16, 2026)
- Nikkei, “International Tourist Tax to rise in July 2026 from ¥1,000 to ¥3,000 under government and ruling-party policy”
- Yamatogokoro.jp, “Inbound guest nights down 11% in April 2026 at 15.36 million; regional share up three points to 33.8%”