

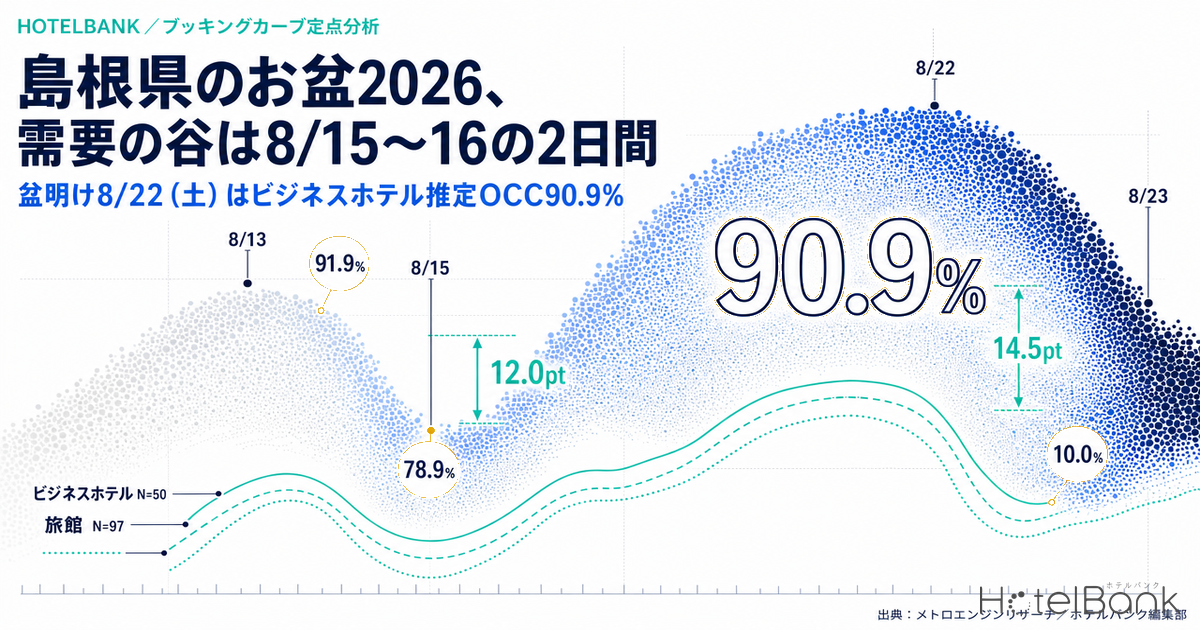
For Obon 2026, the window in which lodging demand actually drops away in Shimane Prefecture is confined to just two days in the back half of the holiday. Reading the prefecture’s booking curves from a single observation cut taken on August 3, 2026, business hotels (N=50 properties) show an estimated OCC of 91.9% for Thursday, August 13, against 78.9% for Saturday, August 15 and 78.4% for Sunday, August 16 — roughly 13pt lower. Yet Saturday, August 22, after Obon ends, comes in at 90.9%, a full 12.0pt above August 15. Ryokan (N=97 properties) show the same shape: August 15 stops at 71.8%, 20.1pt below the 91.9% recorded for August 13. And this gap did not open up at the last minute. At 45 days before the stay date (T-45), business hotels were already at 70.7% for August 15 versus 85.2% for August 22 — a 14.5pt spread that was in place from the start. The valley is not the residue of bookings that failed to materialize; it existed as a shape from 45 days out.
Scope: Shimane Prefecture (business hotels N=50 properties / 5,368 rooms; ryokan N=97 properties / 2,312 rooms; all properties N=262–264 properties / approx. 9,005–9,012 rooms). The metrics in this article are limited to occupancy estimated from OTA-listed inventory (estimated OCC) and the estimated sold-out property rate; price levels are not covered. Definitions appear at the end of the article. Data as of: August 5, 2026 (most recent stable observation date: August 3, 2026).
• Estimated OCC (occupancy) = the share of total rooms in the area that have been sold (an estimate based on OTA sales inventory). It is calculated as 100 − 100 × OTA-listed remaining rooms ÷ total rooms, and its definition differs from actual room occupancy (it reads higher).
• Sold-out property rate (estimated) = the share of properties for which no listed inventory can be confirmed on OTAs and similar channels. The denominator is the number of properties aggregated in the target category.
• This article covers inventory-progress metrics only; price levels (ADR) are not covered.
• Source: MetroEngines Research (continuous tracking of OTA public rates for approx. 168,000 properties in Japan, of which approx. 27,000 have confirmed occupancy data)
- — The Obon valley is only the two days of Aug 15–16. Business hotels (N=50 properties) post an estimated OCC of 91.9% on Aug 13 versus 78.9% on Aug 15 and 78.4% on Aug 16 (observation cut of August 3, 2026).
- — The week after Obon is not a slack period. Aug 18–22 returns business hotels to 88.0–91.7%, on par with Obon itself; the level only breaks down from Aug 23 (68.9%) onward.
- — The valley was set 45 days out. The gap between Aug 15 and Aug 22 was 14.5pt at T-45 and is still 12.0pt at the latest cut. Only 2.5pt of it closed over 45 days.
- — Aug 15 is a day with plenty of availability. The sold-out property rate for business hotels has been flat at 10–12% for 45 days, a completely different market density from the 52.0% recorded for Aug 22.
- — The two segments recover differently. Ryokan sink to 72.7–75.5% on the weekdays after Obon, and even on Saturday, Aug 22 they remain 11.1pt below business hotels.
August in Shimane: the valley lasts two days — the real drop starts on August 23
Start by lining up how full each stay date from August 8 through August 25 is, all read from the same observation date of August 3, 2026. Because the cut is taken on a single observation date, the set of properties being compared is largely identical, which makes the day-to-day highs and lows readable (observed property counts: business hotels 49–50 properties, ryokan 90–94 properties, all properties 246–251 properties).
Source: MetroEngines Research; compiled by the HotelBank Editorial Team
Business hotels hold a plateau of 91–94%, running from 94.0% on Saturday, August 8 through 91.9% on Thursday, August 13. From there they fall in two steps: 88.3% on Friday, August 14, 78.9% on Saturday, August 15, and 78.4% on Sunday, August 16. But the recovery begins at 86.8% on Monday, August 17, and the week after Obon returns almost exactly to peak-Obon levels — 90.9% on Tuesday, August 18, 91.7% on Wednesday, August 19, 90.5% on Thursday, August 20, 88.0% on Friday, August 21 and 90.9% on Saturday, August 22. The level genuinely breaks down only from Sunday, August 23 at 68.9%, moving into a separate range more than 20pt lower alongside Monday, August 24 at 69.1% and Tuesday, August 25 at 69.3%. The pattern in which August 15 is the only Saturday in August to sag is not unique to Shimane; the same structure appears in Hokkaido City Hotels: Only Aug 15 Trails at 78.7% OCC, 45 Days Out.
In other words, August in Shimane has its “Obon valley” and its “post-Obon valley” in two separate places. The valley runs across the two days of August 15–16, and then again from August 23 onward. The stretch sandwiched in between, August 17–22, is not a period of falling demand.
The difference in shape between segments is also worth noting. Ryokan recover as far as 84.0% on Tuesday, August 18, then sink again on weekdays — 75.5% on Wednesday, August 19, 75.1% on Thursday, August 20 and 72.7% on Friday, August 21 — before lifting on Saturday, August 22 alone at 79.8%. The gap versus business hotels on the same dates is 16.2pt on August 19, 15.3pt on August 21 and still 11.1pt on August 22. The post-Obon weekday recovery is weighted toward the business hotel side, while ryokan revert to a shape centered on weekends.
How four stay dates built up, read at the three fixed points T-45 / T-30 / T-14
Next, read the data at fixed points where the days remaining are aligned per stay date. The four columns are T-45 (45 days out), T-30 (30 days out) and T-14 (14 days out), plus the latest stable cut (observation of August 3, 2026). August 22 has not yet reached T-14, so that cell is left blank.
| Category / stay date | T-45 | T-30 | T-14 | Latest (Aug 3 obs.) | T-45 → latest |
|---|---|---|---|---|---|
| Business hotels Aug 13 (Thu) | 78.4% | 84.0% | 89.8% | 91.9% | +13.5pt |
| Business hotels Aug 14 (Fri) | 75.2% | 81.4% | 87.5% | 88.3% | +13.1pt |
| Business hotels Aug 15 (Sat) | 70.7% | 74.0% | 78.5% | 78.9% | +8.2pt |
| Business hotels Aug 22 (Sat) | 85.2% | 87.6% | — | 90.9% | +5.7pt |
| Ryokan Aug 13 (Thu) | 74.7% | 81.6% | 88.3% | 91.9% | +17.2pt |
| Ryokan Aug 14 (Fri) | 72.3% | 76.4% | 84.1% | 85.8% | +13.5pt |
| Ryokan Aug 15 (Sat) | 61.0% | 62.9% | 70.7% | 71.8% | +10.8pt |
| Ryokan Aug 22 (Sat) | 69.0% | 73.6% | — | 79.8% | +10.8pt |
| All properties Aug 13 (Thu) | 77.3% | 82.6% | 88.6% | 91.2% | +13.9pt |
| All properties Aug 14 (Fri) | 74.0% | 79.3% | 85.4% | 86.7% | +12.7pt |
| All properties Aug 15 (Sat) | 67.9% | 70.8% | 75.5% | 76.3% | +8.4pt |
| All properties Aug 22 (Sat) | 79.8% | 82.9% | — | 86.5% | +6.7pt |
Estimated OCC (OTA-listed inventory basis). Observed property count ranges: business hotels 42–50 properties, ryokan 77–94 properties, all properties 180–253 properties (across every column, including the latest cut). Source: MetroEngines Research; compiled by the HotelBank Editorial Team
Looking at business hotels, August 13 builds up 13.5pt, from 78.4% at T-45 to 91.9% at the latest cut. August 15, by contrast, stops at 8.2pt, moving from 70.7% to 78.9%. Breaking it into intervals makes the difference clearer still: over the 15 days from T-45 to T-30, August 13 advanced +5.6pt while August 15 managed +3.3pt. The valley had already begun widening in the early stretch between 45 and 30 days out.
The spread between August 22 and August 15 was 14.5pt at T-45, 13.6pt at T-30 and 12.0pt at the latest cut. It has narrowed slightly with the passage of time, but only 2.5pt of it closed over 45 days. Among ryokan, August 15 moved just +1.9pt from 61.0% at T-45 to 62.9% at T-30, with the build-up concentrated in the later stretch up to 70.7% at T-14.
Source: MetroEngines Research; compiled by the HotelBank Editorial Team
Overlaid as curves, the three lines run almost exactly parallel. The August 22 line starts high and the August 15 line starts low, and over 45 days their relative positions never swap. Read at the market level, the demand shortfall on August 15 was not the kind of thing that last-minute customer acquisition would overturn. How the level at 45 days out relates to the headroom left close in is examined segment by segment in Tochigi Booking Curves by Type: Resort 81.1% at T-45, Only +2.6pt Left.
What the sold-out property rate says about the breadth of choice on August 15
A second axis is the sold-out property rate — the estimated share of properties for which no listed inventory can be confirmed on OTAs and similar channels. It shows not just how high occupancy runs but what proportion of properties in the market still have availability.
Source: MetroEngines Research; compiled by the HotelBank Editorial Team
| Sold-out property rate (estimated) | T-45 | T-30 | T-14 | Latest (Aug 3 obs.) |
|---|---|---|---|---|
| Business hotels Aug 13 (Thu) | 22.0% | 30.0% | 30.0% | 46.0% |
| Business hotels Aug 15 (Sat) | 12.0% | 10.0% | 10.0% | 10.0% |
| Business hotels Aug 22 (Sat) | 42.0% | 44.0% | — | 52.0% |
| Ryokan Aug 13 (Thu) | 27.8% | 35.1% | 46.4% | 53.6% |
| Ryokan Aug 15 (Sat) | 24.7% | 16.5% | 19.6% | 20.6% |
| Ryokan Aug 22 (Sat) | 18.6% | 21.6% | — | 27.8% |
| All properties Aug 13 (Thu) | 44.5% | 51.0% | 54.4% | 61.2% |
| All properties Aug 15 (Sat) | 35.6% | 35.6% | 33.3% | 34.1% |
| All properties Aug 22 (Sat) | 39.9% | 44.5% | — | 42.6% |
Sold-out property rate = the estimated share of properties for which no listed inventory can be confirmed on OTAs and similar channels. Observed property count ranges are the same as for the estimated OCC table. Source: MetroEngines Research; compiled by the HotelBank Editorial Team
For business hotels, August 15 sits at 12.0% at T-45, 10.0% at T-30, 10.0% at T-14 and still 10.0% at the latest cut — essentially flat across 45 days. That works out to around five of the 50 properties having no confirmable listed inventory, and it has stopped there. On the same day of the week, August 22 reads 52.0% at the latest cut, meaning more than half of properties have no confirmable listed inventory. August 13 has also risen to 46.0% at the latest cut. August 15 therefore reads as a day on which occupancy is low and nine out of ten properties still have availability.
For ryokan on August 15, there is a visible move down from 24.7% at T-45 to 16.5% at T-30, but the observed property count rises from 77 to 87 across that interval. Because the observed population changes, this movement should not be read as inventory itself rising or falling; the level of roughly 20% is what to take from it. Set against ryokan on August 13 at 53.6% at the latest cut, the difference in what remains at 20.6% on August 15 is large enough to matter.
It is not that nothing is happening on August 15. According to Shimane Kankou Navi, the prefecture’s official tourism information site, Saturday, August 15 is scheduled to host the Yasaka Furusato Matsuri in Hamada, the Tsuwano Bon Odori festival and the Nichihara Ayu Matsuri fireworks display in Tsuwano, and the Shobara Summer Festival fireworks evening in Izumo. Saturday, August 22 brings the 21st Izumo Shinwa Matsuri fireworks display at Otsu Asakura in Izumo (fireworks 20:00–20:40) and the Takatsugawa Fireworks 2026 (54th Masuda Suigosai) in Masuda. Both days see summer festivals staged across multiple parts of the prefecture, so an event-calendar lens alone cannot explain the 12.0pt gap that business hotels show between the two.
For revenue managers running business hotels and ryokan in Shimane — implications and an action plan
1. Unpick the assumption that “Obon means everything is strong,” day by day. Shimane’s business hotel market splits into four ranges: 91.2–94.0% across August 8–13, 78.4–78.9% across August 15–16, 88.0–91.7% across August 18–22, and 68.9–69.3% from August 23 onward. The first step is to lay out your own calendar by day and check whether it takes the same four-tier shape. In particular, if August 18–22 has been treated uniformly as “the post-Obon lull,” there is room to examine that against the fact that the market has returned to roughly the same level as August 13.
2. Adopt the time horizon in which the valley is already visible 45 days out. The gap between August 15 and August 22 was 14.5pt at T-45 and is still 12.0pt at the latest cut, with only 2.5pt closing over 45 days. The premise that measures taken in the final two weeks can reverse a market-wide valley is not supported, at least by this data. Read the other way, it may have been possible to judge “this day will be a valley” at the point of the T-45 cut — which makes it worth preserving your own T-45 snapshot for next year.
3. Read August 15 less as “low occupancy” and more as “many properties with availability.” The sold-out property rate for business hotels on August 15 is 10.0% at the latest cut, a completely different market density from the 52.0% on August 22. When nine out of ten properties still carry listed inventory, the weight shifts relatively toward whether prospective guests find you at all. Checking how exposure and booking conditions are set on valley days is worth the effort.
4. Ryokan and business hotels recover differently after Obon. Ryokan sink on weekdays — 75.5% on August 19, 75.1% on August 20 and 72.7% on August 21 — and lift only on Saturday, August 22 at 79.8%. The gap versus business hotels on the same days reaches 16.2pt. For the ryokan segment, building around a weekend-weighted design fits the market’s shape better than assuming post-Obon weekdays will recover.
| Time horizon | Action | Decision trigger (figures from this article) | Objective |
|---|---|---|---|
| Today to this week (6–10 days to stay date) | Take stock of booking conditions for August 15 and 16 | If your own pickup for August 15 is running below the market’s 78.9% for business hotels / 71.8% for ryokan | Gauge the depth of the valley against the market and separate property-specific factors from the market-wide shape |
| Today to this week | Check minimum-length-of-stay and consecutive-night restrictions | If the 13.0pt gap between 91.9% on August 13 and 78.9% on August 15 also appears at your property, and length-of-stay conditions spanning August 13 to 15 are still in place | Check whether single-night demand for August 15 is being screened out by those conditions |
| Today to this week | Review listing content for valley days (photos, plan composition, availability display) | The sold-out property rate for business hotels on August 15 stands at 10.0% at the latest cut and has been flat for 45 days | Respond to the fact that the more choice there is on a given day, the more weight falls on the step of being found |
| Within two weeks (August 17–22) | Re-confirm that the post-Obon week is not being treated as slack | Against the market’s business hotel readings of 90.9% on August 18, 91.7% on August 19 and 90.9% on August 22, if your property is not set up at August 13 levels | Avoid leaving the days where the recovery is working on the table |
| Within two weeks | Address inventory for August 23–25 early | Market business hotel readings of 68.9% on August 23, 69.1% on August 24 and 69.3% on August 25, with sold-out property rates of 6.0%, 0.0% and 2.0% on those same three days | Prepare on the premise that the real valley falls after August 23, not immediately after Obon |
| Looking to next month | Build the three fixed points T-45 / T-30 / T-14 into your routine review | August 15 was already 14.5pt below August 22 at T-45, and only 2.5pt of that closed over 45 days | Shift toward an operation that finds valleys in the 45-days-out cut rather than discovering them close in |
Source: MetroEngines Research; compiled by the HotelBank Editorial Team
Converting estimated OCC into listed remaining rooms — the scale in play on valley days
Every figure so far has been expressed as a percentage. Finally, take the definition used in this article (estimated OCC = 100 − 100 × OTA-listed remaining rooms ÷ total rooms), rearrange it, and convert the same figures into room counts. This is not a demand forecast; it is a unit conversion using the estimated OCC and target room counts stated in this article. Both the room counts and the estimated OCC values used in the conversion are measured figures already presented above, and no new assumptions are introduced.
| Cut | Business hotels (5,368 rooms) | Ryokan (2,312 rooms) | All properties |
|---|---|---|---|
| Valley (Aug 15, Sat) | 78.9% / 1,133 rooms | 71.8% / 652 rooms | 76.3% / 2,136 rooms |
| Mid (Aug 14, Fri) | 88.3% / 628 rooms | 85.8% / 328 rooms | 86.7% / 1,198 rooms |
| Peak (Aug 13, Thu) | 91.9% / 435 rooms | 91.9% / 187 rooms | 91.2% / 793 rooms |
| Reference: post-Obon (Aug 22, Sat) | 90.9% / 488 rooms | 79.8% / 467 rooms | 86.5% / 1,216 rooms |
For business hotels, the estimated listed remaining rooms on August 15 come to roughly 1,133 rooms — about 645 more rooms than the roughly 488 on the same day of the week, August 22. Translated into the prefecture’s business hotel inventory, a 12.0pt difference is a matter of some 645 rooms. The same conversion yields roughly 185 rooms for ryokan and roughly 920 rooms across all properties. When weighing what to do on valley days, this room count is the rough upper bound on the scale in play.
| Target rooms \ estimated OCC | 68.9% (Aug 23, business hotels) | 71.8% (Aug 15, ryokan) | 78.9% (Aug 15, business hotels) | 86.5% (Aug 22, all properties) | 91.9% (Aug 13, business hotels) |
|---|---|---|---|---|---|
| 2,500 rooms | 777 rooms | 705 rooms | 527 rooms | 338 rooms | 202 rooms |
| 4,000 rooms | 1,244 rooms | 1,128 rooms | 844 rooms | 540 rooms | 324 rooms |
| 5,500 rooms | 1,710 rooms | 1,551 rooms | 1,160 rooms | 742 rooms | 445 rooms |
| 7,000 rooms | 2,177 rooms | 1,974 rooms | 1,477 rooms | 945 rooms | 567 rooms |
| 9,000 rooms | 2,799 rooms | 2,538 rooms | 1,899 rooms | 1,215 rooms | 729 rooms |
The grid does no more than show that at the same estimated OCC, the absolute volume of remaining rooms moves in proportion to the scale of the portfolio. Read in reverse, once you know your own room count and how full a given date is, you can line up your own remaining inventory against the market cut on the same ruler. The 12.0pt estimated OCC gap between August 15 and August 22 corresponds to roughly 660 rooms at a scale of 5,500 rooms, and roughly 300 rooms at a scale of 2,500 rooms.
Summary — three yardsticks for reading August in Shimane
Yardstick 1: where the valley sits. Shimane’s Obon valley spans the two days of August 15–16, and the post-Obon stretch of August 17–22 returns, at market level, to something close to peak Obon. The next valley starts on August 23. Rather than “once Obon ends, the slack season begins,” the reality is closer to a market with two valleys in two separate places.
Yardstick 2: the depth of the valley, and the room left to fill it. Business hotels on August 15 sit at 78.9% at the latest cut, 12.0pt below the same day of the week on August 22. That gap has barely narrowed from 14.5pt at T-45. When reviewing valley-day pickup at your own property, the baseline should be “the market isn’t building either,” not “there’s still time, so it will build.”
Yardstick 3: the shape of the recovery by segment. On post-Obon weekdays, business hotels return to 88.0–91.7% while ryokan stop at 72.7–84.0%, and even on Saturday, August 22 an 11.1pt gap remains between the two. Within the same prefecture, demand comes back in different shapes by segment. Reading your own calendar against the shape of your own segment, rather than the prefecture-wide average, makes misjudgment less likely.
About the Data
| Item | Detail |
|---|---|
| Definition of estimated OCC | Occupancy on an OTA-listed inventory basis = 100 − 100 × OTA-listed remaining rooms ÷ total rooms. It is an estimate based on how far inventory sold through OTAs has been consumed, and its definition differs from actual room occupancy (it reads higher). This article labels it “estimated OCC (OTA-listed inventory basis).” |
| Booking curve | Based on observations from 45 days before the stay date through the latest cut. Target stay dates are August 8–25, 2026, of which the fixed-point comparison covers August 13, 14, 15 and 22, 2026. |
| Sold-out property rate | The estimated share of properties for which no listed inventory can be confirmed on OTAs and similar channels. The denominator is the number of properties aggregated in the target category. |
| Note on estimated settled ADR | This article does not cover price metrics. The estimated settled ADR used by HotelBank is a transacted price level (tax-exclusive equivalent) estimated from OTA and similar sales data (lowest-plan level × segment-specific coefficients, ensembled across multiple channels); past months are confirmed values, while current and future months are estimates based on the sales situation at the present time. Reconciliation against published operating results gives a median error of 6.6%. |
| Breakdown of target N | Shimane Prefecture. Business hotels N=50 properties / 5,368 rooms; ryokan N=97 properties / 2,312 rooms; all properties N=262–264 properties / approx. 9,005–9,012 rooms (the aggregation set differs slightly by stay date). Inventory observed under two-guest occupancy conditions. |
| Range of observed property counts | Across every column used in this article (T-45, T-30, T-14 and the latest cut), observed property counts run 42–50 for business hotels, 77–94 for ryokan and 180–253 for all properties. For the daily profile (observation of August 3, 2026) they run 49–50 for business hotels, 90–94 for ryokan and 246–251 for all properties. Observed property counts vary over the period, and differences between fixed points may include changes in the observed set, so the levels at each point are read in preference to the size of the change. Cuts in which the observed property count fell below 80% of the aggregation set were excluded from the charts and tables. |
| Data timing | Data as of: August 5, 2026 (most recent stable observation date: August 3, 2026). Because sales conditions and inventory change daily, the figures in this article are a snapshot as of the time of retrieval. |
Source: MetroEngines Research; compiled by the HotelBank Editorial Team
References and Sources
Shimane Summer Festivals & Fireworks Guide 2026 | Shimane Kankou Navi (Shimane Prefecture official tourism information site)
Events | Shimane Kankou Navi (Shimane Prefecture official tourism information site)
21st Izumo Shinwa Matsuri Fireworks Display (held August 22, 2026) | Hanabi ni Ikou
Event Calendar | Matsue Tourism Association
■ Data Sources
OTA public rate and listed inventory data for approx. 168,000 properties in Japan continuously tracked by MetroEngines Research (of which approx. 27,000 have confirmed occupancy data). Shimane Prefecture booking curves are based on observations under two-guest occupancy conditions from 45 days before the stay date through the latest cut; target stay dates are August 8–25, 2026, and the fixed-point comparison covers August 13, 14, 15 and 22, 2026. Data as of August 5, 2026, with the most recent stable observation date being August 3, 2026. Event information is drawn from the published calendars of Shimane Kankou Navi, the Shimane Prefecture official tourism information site, and the Matsue Tourism Association.
■ Calculation Assumptions
Estimated OCC (occupancy on an OTA-listed inventory basis) = 100 − 100 × OTA-listed remaining rooms ÷ total rooms. Sold-out property rate (estimated) = the share of properties for which no listed inventory can be confirmed on OTAs and similar channels, with the number of properties aggregated in the target category as the denominator. The conversion tables at the end of the article (Tables 5 and 6) are unit conversions using estimated listed remaining rooms = target room count × (1 − estimated OCC), derived by rearranging that definition of estimated OCC; they are not demand forecasts. The room counts used in the conversion (5,368 rooms for business hotels, 2,312 rooms for ryokan, approx. 9,005–9,012 rooms for all properties) and the estimated OCC values are all measured figures stated in the body text, and no extrapolation outside those ranges has been performed. This article covers inventory-progress metrics only; price levels (ADR) are not covered.
■ Limitations and Caveats
Estimated OCC is an estimate based on how far inventory sold through OTAs has been consumed, and its definition differs from actual room occupancy (it reads higher). Observed property counts vary over the period (42–50 for business hotels, 77–94 for ryokan, 180–253 for all properties), and differences between fixed points may include changes in the observed set, so levels at each point are read in preference to the size of the change. Cuts in which the observed property count fell below 80% of the aggregation set were excluded from the charts and tables. Because sales conditions and inventory change daily, the figures in this article are a snapshot as of the time of retrieval and may be revised slightly in re-aggregation after publication. Whether an event is held is only one contributing factor in demand differences, and this article does not identify the contribution of individual factors.
Related Reading
- Hokkaido City Hotels: Only Aug 15 Trails at 78.7% OCC, 45 Days Out
- Kyoto Obon 2026 Booking Curves: Ryokan Add the Most Close In, +11.4pt
- Nagano Late-Summer Booking Curve 2026: Ryokan -11.8pt at 45 Days Out
- Okinawa Late-Summer Booking Curve 2026: Sep 5 Beats Obon, City +4.7pt
- Yamagata Hanagasa 2026: Demand Settled 45 Days Out, +9.6pt vs Normal
- Tochigi Booking Curves by Type: Resort 81.1% at T-45, Only +2.6pt Left