

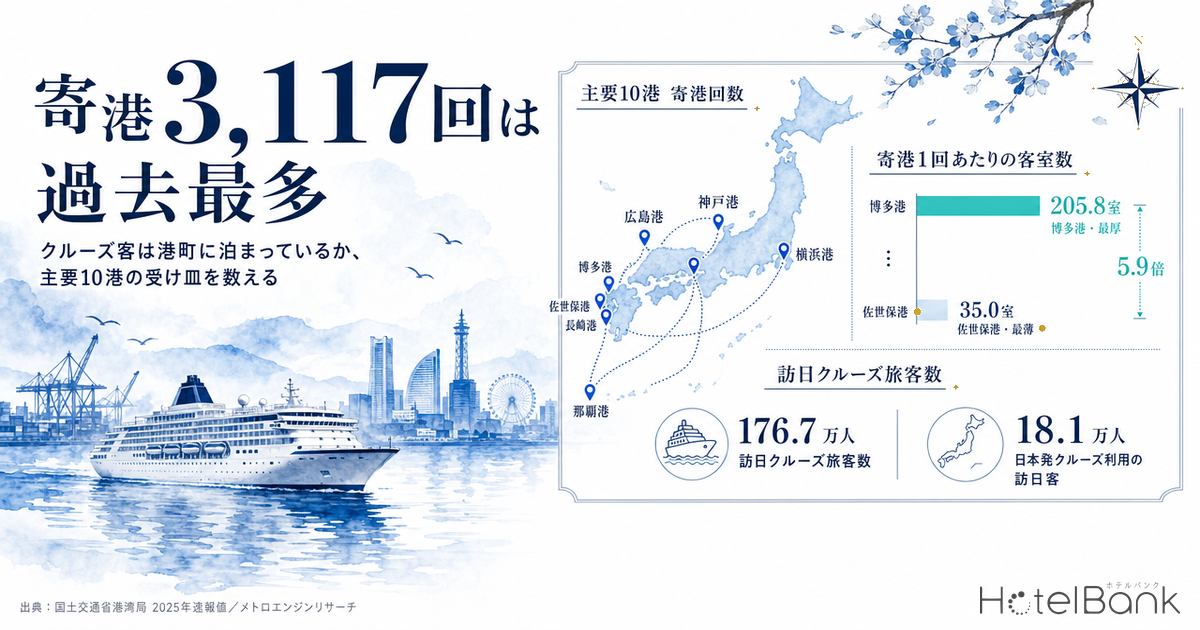
According to “Inbound Cruise Passengers and Cruise Ship Port Calls (2025 Preliminary Figures),” published by the Ports and Harbours Bureau of Japan’s Ministry of Land, Infrastructure, Transport and Tourism (MLIT) on February 20, 2026, cruise ships made 3,117 calls at Japanese ports in 2025. That surpasses the 2,930 recorded in 2018 and sets a new all-time high. Inbound cruise passengers, however, totaled 1.767 million — only about 70% of the 2.529 million peak reached in 2017. The ships have come back; the people have not fully returned. That gap matters decisively for anyone thinking about hotel demand in port cities.
This article takes the ten ports with the most calls, as ranked in the published figures, and quantifies the accommodation capacity of each host city using a single metric: rooms per port call. It also separates, in numbers, the structural reason a port call does not automatically translate into a hotel night — the difference between transit calls and turnaround calls — and maps out where the upside lies for hotels in port cities.
Metric Definitions Used in This Article
- ADR (average daily rate): An estimated settled rate (tax-exclusive equivalent) calculated by applying category-specific adjustment coefficients to the lowest publicly listed plan rate each property offers on OTAs (double occupancy, per-room rate, tax included). Cross-checked against property-level results disclosed by listed hotel REITs (91 properties, most recent three months), the median error is approximately 7%. These are estimates and differ from each property’s actual transacted rates and accounting figures. Area-level ADR is the median of the properties covered (the level of a typical property in that area).
- Listed price: The average price of all plans published on OTAs (double occupancy, per-room rate, tax included). Because it spans room-only through meal-inclusive plans, it sits above estimated settled ADR. It is treated as a separate metric from ADR.
- OCC (occupancy rate): The share of rooms sold against total rooms in an area (an estimate based on OTA sales inventory). Used at the prefecture level only.
- Rooms per port call: Total rooms across properties in the host city with confirmed OTA activity, divided by the number of port calls in 2025. This is our own comparative metric, designed to view the depth of a port city’s accommodation capacity against the scale of its port.
- Data sources: Port calls and passenger counts = Ports and Harbours Bureau, MLIT / accommodation supply and pricing = MetroEngines Research
- — 3,117 port calls is an all-time high, yet inbound cruise passengers stand at 1.767 million, about 70% of the peak (2.529 million in 2017). The ships are back; the passengers are not.
- — Rooms per port call range from 205.8 in Fukuoka City to 35.0 in Sasebo City — a 5.9x spread. Nagasaki and Sasebo rank high on calls but hold relatively thin inventory in their host cities.
- — Hotel demand comes from turnaround calls. Only two of the top ports see heavy Japanese-operator traffic: Yokohama with 104 calls and Kobe with 43; the rest are in the single digits to low teens.
- — Inbound visitors boarding cruises that depart from Japan hit a record 181,000 in 2025 (roughly double the 89,000 of 2019). This segment always stays in Japan before embarking.
- — Pre- and post-cruise nights fall on the day before or after the call, and calls do not favor any particular weekday. In markets where Saturday runs +79.7% above the cheapest weekday in Fukuoka City, much of this demand lands midweek.
Record Calls, Passengers at 70% of Peak — Starting with the Primary Data
Start with the published figures. Cruise ship calls in 2025 numbered 3,117, roughly 1.3x the prior year. Of those, 2,352 were by cruise ships operated by foreign lines (about 1.2x year on year) and 765 by ships operated by Japanese lines (about 1.4x). Calls by foreign cruise ships reached roughly 117% of the 2017 peak — on the “number of calls” measure, recovery has been more than complete.
Inbound cruise passengers, however, came to 1.767 million, about 70% of the 2.529 million recorded in 2017. The apparent contradiction — record calls but passengers at seven-tenths — is explained by a change in ship size. MLIT’s materials note that before the pandemic large casual-class ships accounted for the majority of calls, whereas afterward calls by smaller, higher-priced premium, luxury and expedition vessels have increased, along with calls at regional ports. Indeed, foreign cruise ships called at 93 ports, roughly 1.4x the 67 ports of 2019.
Put differently, Japan’s cruise market is shifting from “a few thousand passengers disembarking at a handful of ports” to “a few hundred passengers spread across ports nationwide.” The headcount landing at any one port has fallen; the number of ports being visited has risen. For hotels in port cities, that means the character of the demand has changed.
Source: Prepared by the HotelBank Editorial Team from the Ports and Harbours Bureau, MLIT, “Inbound Cruise Passengers and Cruise Ship Port Calls (2025 Preliminary Figures)”
For reference, the Basic Plan for Promoting a Tourism-Oriented Country, approved by Japan’s Cabinet in March 2023, set 2025 targets of 2.5 million inbound cruise passengers, more than 2,000 calls by foreign cruise ships, and 100 ports receiving foreign cruise ships. The 2,000-call target was met; the 2.5 million passengers and 100 ports were not. MLIT itself states that “continued efforts are required on some of the targets.”
The Top 10 Ports — Hakata and Yokohama Tie at 209; Nagasaki Leads on Foreign Ships
By port, 2025 calls (foreign and Japanese operators combined) put Hakata and Yokohama in a tie for first at 209 each, followed by Naha at 205, Nagasaki at 198 and Kobe at 142. Ishigaki (130), Kagoshima (129), Sasebo (128), Hiroshima (106) and Shimizu (105) round out the top ten.
Restricted to cruise ships operated by foreign lines, the order changes: Nagasaki takes first with 194 calls, Hakata second with 191 and Naha third with 187. Sasebo and Kagoshima tie at 122, with Ishigaki close behind at 121. Even among “top-ranking ports,” those dominated by foreign ships and those with heavy Japanese-operator traffic are entirely different in character. How that difference feeds through to hotel demand is covered below.
Source: Ports and Harbours Bureau, MLIT, “2025 Preliminary Figures” / MetroEngines Research; prepared by the HotelBank Editorial Team
Rooms per Port Call — 205.8 in Hakata, 35.0 in Sasebo, a 5.9x Gap
This is the core of the analysis: setting each port’s call count against how much accommodation inventory its host city actually holds. Using calls as the denominator and, as the numerator, total rooms across properties in the host city with confirmed OTA activity, we calculated “rooms per port call.” The count is as of June 2026 and is limited to properties with sales inventory confirmed on OTAs within MetroEngines Research’s coverage (ryokan, minshuku and simple lodging houses not listed on OTAs are excluded).
| Port | Host city | Calls (total) |
of which foreign ships |
Properties | Rooms | 100+ rooms |
Rooms per port call |
|---|---|---|---|---|---|---|---|
| Hakata | Fukuoka City | 209 | 191 | 559 | 43,004 | 166 | 205.8 |
| Hiroshima | Hiroshima City | 106 | 100 | 226 | 18,773 | 69 | 177.1 |
| Yokohama | Yokohama City | 209 | 105 | 181 | 25,347 | 86 | 121.3 |
| Kobe | Kobe City | 142 | 99 | 191 | 16,865 | 66 | 118.8 |
| Naha | Naha City | 205 | 187 | 311 | 23,558 | 89 | 114.9 |
| Kagoshima | Kagoshima City | 129 | 122 | 114 | 9,770 | 37 | 75.7 |
| Shimizu | Shizuoka City | 105 | 99 | 108 | 6,369 | 24 | 60.7 |
| Ishigaki | Ishigaki City | 130 | 121 | 298 | 5,908 | 14 | 45.4 |
| Nagasaki | Nagasaki City | 198 | 194 | 138 | 7,888 | 30 | 39.8 |
| Sasebo | Sasebo City | 128 | 122 | 59 | 4,481 | 15 | 35.0 |
Calls = Ports and Harbours Bureau, MLIT, “2025 Preliminary Figures” / property and room counts = MetroEngines Research (properties with sales inventory confirmed on OTAs as of June 2026, N=2,185 properties / 161,963 rooms). Source: MetroEngines Research; prepared by the HotelBank Editorial Team
Source: Ports and Harbours Bureau, MLIT, “2025 Preliminary Figures” / MetroEngines Research; prepared by the HotelBank Editorial Team
The deepest capacity is in Fukuoka City at 205.8 rooms per call. Hiroshima City (177.1), Yokohama City (121.3), Kobe City (118.8) and Naha City (114.9) also clear 100 rooms. Sasebo City, by contrast, sits at 35.0, Nagasaki City at 39.8 and Ishigaki City at 45.4 — between one-third and one-fifth of the leading group. Between Fukuoka City at the top and Sasebo City at the bottom, the gap is 5.9x.
That gap is not simply city size showing through. Nagasaki City ranks fourth on calls with 198 and Sasebo City eighth with 128 — both well inside the leading group on call frequency. Yet their host-city room inventories stop at 7,888 and 4,481 respectively. Relative to their track record as ports, the accommodation capacity is structurally small. Hiroshima City runs the other way: ninth on calls at 106, but with 18,773 rooms, it climbs to second nationwide on a per-call basis.
That said, a low rooms-per-call figure does not by itself mean capacity is insufficient. As the next section shows, the rate at which calls convert into hotel demand varies enormously from port to port.
A Call Is Not a Hotel Night — Separating Transit Calls from Turnaround Calls
Cruise calls come in two distinct forms. One is the transit call, a stop along the route: passengers go ashore during the day to sightsee, then return to the ship and sleep aboard. The other is the turnaround call, where passengers embark and disembark — which creates a genuine need to stay ashore before or after boarding. Hotel demand comes mainly from the latter.
A useful external marker for telling the two apart is the number of calls by cruise ships operated by Japanese lines. Japanese-operated vessels sail primarily from Japanese homeports, so the heavier a port’s Japanese-operator traffic, the stronger its character as a turnaround port. Calculated from MLIT’s published figures, only two of the top ten stand out on this measure: Yokohama with 104 calls and Kobe with 43. The rest follow at Hakata 18, Naha 18, Ishigaki 9, Kagoshima 7, Sasebo 6, Hiroshima 6, Shimizu 6 and Nagasaki 4 — all in the single digits to low teens.
Source: Prepared by the HotelBank Editorial Team from the Ports and Harbours Bureau, MLIT, “Inbound Cruise Passengers and Cruise Ship Port Calls (2025 Preliminary Figures)”
At Yokohama, about half of the 209 calls — 104 — are Japanese-operated, the highest such count in Japan. Kobe follows with 43 of 142, third nationwide. These two ports clearly function as turnaround ports. Nagasaki, by contrast, sees 194 of its 198 calls operated by foreign lines, with just four Japanese-operated. Sasebo is similar, at 122 foreign-operated out of 128. In other words, ports such as Nagasaki, Sasebo, Ishigaki and Kagoshima are structurally transit-driven.
Worth noting here is the growth in inbound visitors taking cruises that depart from Japan. By MLIT’s count, foreign passengers who arrive mainly by air and then board a Japan-departing cruise reached a record 181,000 in 2025 — roughly double the 89,000 of 2019. Against the 1.767 million total inbound cruise passengers that is only about 10%, but this segment invariably stays somewhere in Japan before boarding. A pattern of entering by air, spending the night before embarkation at a hotel in the port city, and then sailing is taking hold.
Today those 181,000 flow mainly to ports with turnaround functions — Yokohama, Kobe and Hakata. The depth seen in Yokohama City (121.3 rooms per call) and Kobe City (118.8) functions as the inventory needed to absorb that turnaround demand. Read the other way, the relatively thin inventory at transit-driven ports is consistent with the demand structure as it currently stands.
On that basis, if the question is upside, the natural framing is not “are there enough rooms?” but “can transit calls be converted into hotel nights?” Which ports can build the hub functions of a turnaround cruise, with its accompanying pre- and post-cruise stays? Can they design a flow that keeps visitors in town the day before or after a call? The greater a port’s foreign-ship track record — and Nagasaki and Sasebo are among the national leaders — the more room it has to work on that conversion.
Call Dates and Hotel Demand Do Not Line Up — Stays Fall the Day Before and After
Another point easily missed is the date offset. Pre- and post-cruise demand arises not on the call date itself but on the day before or the day after. Guests stay the night before boarding and head to the port in the morning; or they stay the night they disembark and fly home the next day. Hotel inventory moves one day ahead of, or one day behind, the call calendar. How far prices actually respond on the call date itself is examined port by port in Hotel Pricing on Cruise Port Days: ADR Premium Analysis for Yokohama, Kobe & Naha.
That one-day offset carries real weight once combined with day-of-week structure, because accommodation prices in port cities swing sharply by weekday. Aggregating listed prices (all-plan average, tax included) for September–October 2026 check-ins across the central districts of six major cities, the gap between Saturday and the cheapest weekday reaches +79.7% in Fukuoka City, +71.6% in Yokohama City, +65.1% in Hiroshima City and +61.9% in Kobe City. Naha City (+24.6%) and Nagasaki City (+30.0%) are comparatively flat.
Listed prices for check-ins from September 1 to October 31, 2026 (all-plan average, double occupancy, tax included). Central districts of each city (principal wards for designated cities), N=512 properties in Fukuoka City, 298 in Naha City, 166 in Hiroshima City and others. Source: MetroEngines Research; prepared by the HotelBank Editorial Team
Calls do not favor any weekday. Routing puts ships in on a Tuesday as readily as a Thursday. Much of the pre- and post-cruise demand therefore lands on weekdays, when inventory is relatively loose and prices are lower. For port-city hotels that is a welcome property in revenue terms: demand that fills the midweek trough without disturbing the weekend peak. As for the shape of weekday occupancy itself, business hotels in Aichi and Hiroshima show a different pattern again, with a Sunday trough of 7.1 and 8.5 points and a Thursday peak.
As a practical step, there is value in shifting the call calendar forward and back by a day and overlaying it on your own inventory calendar. Identify the dates where the night before a call falls on a weekday, and prepare plans for that date aimed at pre-embarkation guests — early checkout support, luggage storage included. Adding weekday demand lifts the weekly average rate while preserving high weekend pricing. The stronger a property’s existing draw in an urban market, the more readily that midweek increment takes hold.
Estimated Settled ADR and Occupancy in Port Cities — Naha +19.6%, Kobe +17.9%
Capacity is only part of the picture; price and occupancy levels matter too. For each port’s host city (for designated cities, the central ward closest to the port), we calculated the average estimated settled ADR over the most recent 12 months (August 2025–July 2026) and its change against the same period a year earlier.
| Area | Corresponding port | Estimated settled ADR 12-month average |
YoY | Properties covered (median) |
Prefecture | Occupancy June 2026, prefecture level |
|---|---|---|---|---|---|---|
| Hakata Ward, Fukuoka City | Hakata | ¥14,300 | +11.1% | 145 | Fukuoka | 93.0% |
| Chuo Ward, Kobe City | Kobe | ¥12,200 | +17.9% | 66 | Hyogo | 90.9% |
| Naka Ward, Yokohama City | Yokohama | ¥11,800 | +7.5% | 52 | Kanagawa | 88.5% |
| Ishigaki City | Ishigaki | ¥11,100 | +5.8% | 59 | Okinawa | 91.9% |
| Naha City | Naha | ¥10,200 | +19.6% | 140 | Okinawa | 91.9% |
| Nagasaki City | Nagasaki | ¥10,100 | -5.9% | 63 | Nagasaki | 85.7% |
| Minami Ward, Hiroshima City | Hiroshima | ¥9,400 | +6.1% | 24 | Hiroshima | 88.5% |
| Shimizu Ward, Shizuoka City | Shimizu | ¥7,600 | +2.0% | 18 | Shizuoka | 86.7% |
| Sasebo City | Sasebo | ¥7,500 | -3.4% | 37 | Nagasaki | 85.7% |
| Kagoshima City | Kagoshima | ¥6,800 | +1.2% | 72 | Kagoshima | 82.0% |
Estimated settled ADR is the monthly average for August 2025–July 2026. Occupancy is a prefecture-level estimate based on OTA listed inventory. Source: MetroEngines Research; prepared by the HotelBank Editorial Team
The standout gains are Naha City at +19.6%, Chuo Ward in Kobe City at +17.9% and Hakata Ward in Fukuoka City at +11.1% — all cities with turnaround functions or large ports, where the strength of the wider market, cruise demand aside, is showing through. Naka Ward in Yokohama City (+7.5%), Minami Ward in Hiroshima City (+6.1%) and Ishigaki City (+5.8%) are solid. Nagasaki City (-5.9%) and Sasebo City (-3.4%), on the other hand, fell below the prior year. For Nagasaki City, new supply across the prefecture rising to 2.6x the prior year in 2026 is part of what has held rate growth back.
Monthly estimated settled ADR for Hakata Ward, Fukuoka City. 2026 runs through July (actual months only). Properties covered: 142–148 per month. Source: MetroEngines Research; prepared by the HotelBank Editorial Team
At the prefecture level, occupancy as of June 2026 is high: Fukuoka 93.0%, Okinawa 91.9% and Hyogo 90.9%, followed by Kanagawa and Hiroshima at 88.5%, Shizuoka 86.7%, Nagasaki 85.7% and Kagoshima 82.0%. These are estimates based on OTA listed inventory and differ from properties’ actual overall occupancy, but the major prefectures that include port cities broadly show strong inventory absorption. For the leading group, the question has moved to how weekday inventory is allocated in peak periods — that is what will drive rate growth from here.
Where New Supply Is Landing — Naha Adds 2,724 Rooms in Two Years
Capacity is not fixed. Looking at recent openings, Naha City added 14 properties and 1,214 rooms in 2025 and 12 properties and 1,510 rooms in 2026 — 2,724 rooms in two years. Fukuoka City added 22 properties and 1,046 rooms in 2026, Yokohama City 4 properties and 870 rooms, and Hiroshima City 12 properties and 460 rooms. Sasebo City, by contrast, has added 123 rooms in total across the four years since 2023, and Shizuoka City 273. How much deeper Fukuoka City’s capacity will get, pipeline beyond the Tenjin Big Bang included, is set out in Fukuoka Hotel Supply 2026-2028: ~1,000 Rooms/Year in Hakata & Tenjin.
*Based on confirmed OTA listings. Because listings appear several months before opening, the most recent months onward may increase as further listings come through. Source: MetroEngines Research & Consulting (based on confirmed OTA listings)
For supply further out, planning data based on building confirmation applications offers a guide. Hotel projects identified as scheduled for completion from 2026 onward run: Hiroshima City 15 projects / 3,198 rooms, Yokohama City 8 / 1,771, Fukuoka City 12 / 1,319, Naha City 6 / 914 and Shizuoka City 2 / 642. Kobe City follows with 421 rooms, Nagasaki City 353, Ishigaki City 164 and Kagoshima City 74; Sasebo City has none. Note that the same property is sometimes registered as multiple projects, so projects with duplicate locations and room counts have been consolidated.
Hiroshima City’s 3,198 rooms represent roughly a 17% addition to its current 18,773-room inventory — the largest impact among the host cities of the top ten ports. Large projects are concentrated around Hiroshima Station, led by a 600-room development in Matsubara-cho, Minami Ward. Yokohama City’s 1,771 rooms are likewise tied to redevelopment in the Minato Mirai and Kannai areas, working to deepen capacity at a turnaround port.
*How to read the supply pipeline: Planning data is based on building confirmation applications as of the survey date. Confirmation applications are typically filed one to two years before opening, so project and room counts are expected to rise as further applications are filed; treat the figures as a lower bound on the currently confirmed pipeline.
Factoring In Occupancy Narrows the Gap from 5.9x to 2.9x — Estimated Vacant Rooms per Port Call
Rooms per port call, as used so far, measures total inventory and says nothing about how much of it is actually available. This article defines estimated OCC as the share of rooms sold against total rooms in an area, so rearranging that definition gives estimated vacant rooms per port call = rooms per port call × (1 − estimated OCC). What follows is not a demand forecast; it is a unit conversion that simply multiplies two figures already stated in this article. No new empirical claim is involved.
Note that estimated OCC is calculated at the prefecture level only (per the metric definitions above), so applying a prefecture-level estimated OCC to a city-level room stock mixes granularity. Read the results as a relative comparison between ports, not as absolute levels.
| Host city (port) | Rooms per port call | High occupancy estimated OCC 93.0% (as of June 2026) | Observed prefecture estimated OCC (as of June 2026) | Low occupancy estimated OCC 82.0% (as of June 2026) |
|---|---|---|---|---|
| Fukuoka City (Hakata) | 205.8 rooms | 14.4 rooms | 14.4 rooms (Fukuoka, estimated OCC 93.0% as of June 2026) | 37.0 rooms |
| Hiroshima City (Hiroshima) | 177.1 rooms | 12.4 rooms | 20.4 rooms (Hiroshima, estimated OCC 88.5% as of June 2026) | 31.9 rooms |
| Yokohama City (Yokohama) | 121.3 rooms | 8.5 rooms | 13.9 rooms (Kanagawa, estimated OCC 88.5% as of June 2026) | 21.8 rooms |
| Kobe City (Kobe) | 118.8 rooms | 8.3 rooms | 10.8 rooms (Hyogo, estimated OCC 90.9% as of June 2026) | 21.4 rooms |
| Naha City (Naha) | 114.9 rooms | 8.0 rooms | 9.3 rooms (Okinawa, estimated OCC 91.9% as of June 2026) | 20.7 rooms |
| Kagoshima City (Kagoshima) | 75.7 rooms | 5.3 rooms | 13.6 rooms (Kagoshima, estimated OCC 82.0% as of June 2026) | 13.6 rooms |
| Shizuoka City (Shimizu) | 60.7 rooms | 4.2 rooms | 8.1 rooms (Shizuoka, estimated OCC 86.7% as of June 2026) | 10.9 rooms |
| Ishigaki City (Ishigaki) | 45.4 rooms | 3.2 rooms | 3.7 rooms (Okinawa, estimated OCC 91.9% as of June 2026) | 8.2 rooms |
| Nagasaki City (Nagasaki) | 39.8 rooms | 2.8 rooms | 5.7 rooms (Nagasaki, estimated OCC 85.7% as of June 2026) | 7.2 rooms |
| Sasebo City (Sasebo) | 35.0 rooms | 2.4 rooms | 5.0 rooms (Nagasaki, estimated OCC 85.7% as of June 2026) | 6.3 rooms |
Converted using each prefecture’s observed OCC, the deepest market, Fukuoka City, comes to 14.4 rooms per call and the thinnest, Sasebo City, to 5.0 — narrowing the gap from 5.9x on total inventory to 2.9x. Ports with deeper capacity also run higher occupancy, so the difference in rooms actually available is far smaller than the difference in inventory. The previous section’s reading — that a low rooms-per-call figure does not by itself mean capacity is insufficient — holds once occupancy is factored in.
How Far Do Vacant Rooms Move When Estimated OCC Shifts One Level
The grid below varies estimated OCC across the five levels observed in this article (82.0%–93.0%) and combines them with the five rooms-per-call levels.
| Rooms per port call \ estimated OCC (as of June 2026, prefecture level) | Estimated OCC 82.0% as of June 2026 | Estimated OCC 85.7% as of June 2026 | Estimated OCC 88.5% as of June 2026 | Estimated OCC 91.9% as of June 2026 | Estimated OCC 93.0% as of June 2026 |
|---|---|---|---|---|---|
| 35.0 rooms | 6.3 rooms | 5.0 rooms | 4.0 rooms | 2.8 rooms | 2.4 rooms |
| 60.7 rooms | 10.9 rooms | 8.7 rooms | 7.0 rooms | 4.9 rooms | 4.2 rooms |
| 114.9 rooms | 20.7 rooms | 16.4 rooms | 13.2 rooms | 9.3 rooms | 8.0 rooms |
| 177.1 rooms | 31.9 rooms | 25.3 rooms | 20.4 rooms | 14.3 rooms | 12.4 rooms |
| 205.8 rooms | 37.0 rooms | 29.4 rooms | 23.7 rooms | 16.7 rooms | 14.4 rooms |
The deeper the inventory, the more a swing in estimated OCC moves the vacant-room count. At the 205.8-rooms-per-call level, moving from estimated OCC 93.0% (as of June 2026) to 82.0% (same) shifts vacancies from 14.4 to 37.0 rooms — a move of 22.6 rooms — whereas at the 35.0-room level the same swing runs 2.4 to 6.3, just 3.9 rooms. When chasing the single incremental night that a pre- or post-cruise stay represents, the number of rooms a market can absorb from a given occupancy gain scales with inventory. At transit-driven ports with thin inventory, the upside lies not in absolute room count but in designing rate and stay experience to raise the value of each night.
Conclusion — Count the Nights That Land, Not the Calls
The 3,117 calls recorded in 2025 are indeed an all-time high. How much of that converts into hotel demand in port cities, however, depends heavily on the character of the port. Three points from this analysis:
| Point | How to read it |
|---|---|
| Depth of capacity | Rooms per port call range from 205.8 in Fukuoka City to 35.0 in Sasebo City, a 5.9x spread. But this is not a simple surplus-or-shortfall; it reflects differences in what each port does. |
| Conversion into demand | Japanese-operator traffic is concentrated at Yokohama (104 calls) and Kobe (43). That is where turnaround demand is contested, and inbound visitors taking Japan-departing cruises have grown to a record 181,000. |
| When demand lands | Pre- and post-cruise nights fall the day before and the day after a call. Because calls do not favor any weekday, much of the demand lands midweek — lifting rate without disturbing the weekend peak. |
Source: Ports and Harbours Bureau, MLIT, “2025 Preliminary Figures” / MetroEngines Research; prepared by the HotelBank Editorial Team
What hotels in port cities should be counting is not how many ships come in, but how many of those nights land in their own inventory. At transit-driven ports, the design work of capturing the night before or after a call is itself the upside. At ports with turnaround functions, there is room to convert the pre- and post-cruise demand that already exists into better weekday rate. The figure of 3,117 is the starting point for that work, not the conclusion.
*On data coverage: The accommodation supply data in this article is aggregated from properties with sales inventory confirmed on OTAs within MetroEngines Research’s coverage; it is not a complete census. Ryokan, minshuku and simple lodging houses not listed on OTAs, and properties selling only through direct channels, are excluded. Port call and passenger figures are preliminary values published by the Ports and Harbours Bureau, MLIT, and may change.
Related Reading
- Japan Intra-Prefecture ADR Gaps Reach 5.2x: 368 Municipalities Ranked
- Hotel Pricing on Cruise Port Days: ADR Premium Analysis for Yokohama, Kobe & Naha
- Fukuoka Hotel Supply 2026-2028: ~1,000 Rooms/Year in Hakata & Tenjin
- Double Ten x Sports Day: Japan’s Oct 9-12 Capacity at 76 Days Out
References and Sources
■ Government statistics and public data
- Ports and Harbours Bureau, MLIT, “Inbound Cruise Passengers and Cruise Ship Port Calls (2025 Preliminary Figures)” (February 20, 2026)
- Same, appendix (Figures 1–11, port-by-port call counts)
- Ports and Harbours Bureau, MLIT, “Cruise Promotion”
- Ports and Harbours Bureau, MLIT, “Inbound Cruise Passengers and Cruise Ship Port Calls (2024 Preliminary Figures)”
- MLIT, “Statistical Survey on Building Construction Starts” (planning data based on building confirmation applications)
■ Data sources
Port calls, inbound cruise passengers and port-by-port call counts come from the Ports and Harbours Bureau, MLIT, “Inbound Cruise Passengers and Cruise Ship Port Calls (2025 Preliminary Figures)” (published February 20, 2026) and its appendix. Accommodation supply (property and room counts), estimated settled ADR, listed prices and estimated occupancy are aggregated data from MetroEngines Research (property and room counts as of June 2026; estimated settled ADR monthly for August 2025–July 2026; listed prices for September–October 2026 check-ins; estimated occupancy for June 2026). New opening data is from MetroEngines Research & Consulting (based on confirmed OTA listings); future supply plans are planning data based on building confirmation applications under MLIT’s “Statistical Survey on Building Construction Starts.”
■ Calculation assumptions
“Rooms per port call” is our own comparative metric: total rooms across properties in the host city with sales inventory confirmed on OTAs, divided by 2025 port calls (foreign and Japanese operators combined). “Estimated vacant rooms per port call” is a unit conversion obtained by rearranging this article’s metric definition (estimated OCC = rooms sold as a share of total rooms); it is not a demand forecast. The axes of both the three-case table and the 5×5 grid use only values already stated in the text (rooms per port call 35.0–205.8; prefecture-level estimated OCC 82.0–93.0%), with no extrapolation beyond that range. Because estimated OCC is calculated at the prefecture level only, applying a prefecture-level estimated OCC to a city-level room stock should be read as a relative comparison rather than an absolute level.
■ Limitations and caveats
Accommodation supply data is aggregated from properties with sales inventory confirmed on OTAs within MetroEngines Research’s coverage and is not a complete census. Ryokan, minshuku and simple lodging houses not listed on OTAs, and direct-sales-only properties, are excluded. Port call and inbound cruise passenger figures are preliminary and may change in the final release. Estimated settled ADR is an estimate and differs from each property’s actual transacted rates and accounting figures. Estimated occupancy is based on OTA listed inventory and therefore tends to run higher than properties’ actual overall occupancy; it is also a snapshot at the time of writing and may edge upward later as observations accumulate. Future supply plans are based on building confirmation applications and are expected to increase as further applications are filed; treat them as a lower bound at this point in time.
■ Market data
- MetroEngines Research — estimated settled ADR (monthly, August 2023–July 2026), listed prices (September–October 2026 check-ins), estimated occupancy based on OTA listed inventory (June 2026), property and room counts (as of June 2026)
- MetroEngines Research & Consulting — new opening data (based on confirmed OTA listings)
■ Media coverage