

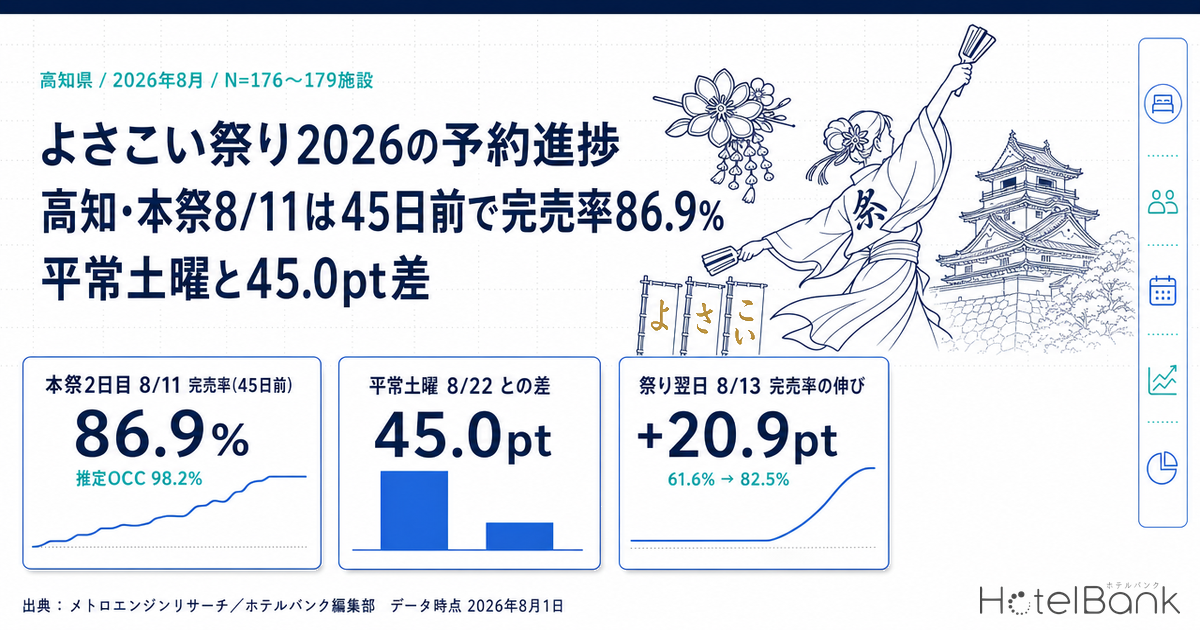
In Kochi Prefecture, the demand peak for August 2026 does not sit on the Obon holidays but on the four days of the Yosakoi Festival. Tracking booking progress for all properties in the prefecture (N=176–179 properties) from 45 days before the stay date, August 11 (Tue, Mountain Day) — the second main-festival day — had already reached an estimated OCC of 98.2% and a sold-out rate of 86.9% at the 45-day mark, a gap of 45.0 points in sold-out rate and 20.0 points in estimated OCC versus the control of a normal Saturday, August 22 (estimated OCC 78.2%, sold-out rate 41.9%). At the latest observation (as of July 30, 2026), August 11 stood at an estimated OCC of 99.3% and a sold-out rate of 93.2%. Yet the gain in estimated OCC from the 45-day mark to the latest observation was only +1.1 to +1.9 points across the four festival days — evidence that the contest was already settled before the 45-day mark. Conversely, August 13 (Thu), the day after the festival, built up late: its sold-out rate moved from 61.6% to 82.5% (+20.9 points). August in Kochi splits cleanly into “days that settle early” and “days that tighten late.”
Scope: all properties in Kochi Prefecture, N=176–179 properties (of which business hotels N=62–64 properties). Occupancy in this article is an estimate based on OTA-listed inventory (estimated OCC); the sold-out rate is an estimate of the share of properties for which no listed inventory can be confirmed. No price metrics are used. Definitions are given at the end of the article. Data as of August 1, 2026 (final observation date: July 30, 2026).
- — The second main-festival day, August 11 (Tue, Mountain Day), was at an estimated OCC of 98.2% and a sold-out rate of 86.9% at 45 days out. Against the control of a normal Saturday, August 22, that is a gap of 45.0pt in sold-out rate and 20.0pt in estimated OCC.
- — Over the four festival days, the gain from 45 days out to the latest observation was only +1.1 to +1.9pt in estimated OCC. The contest was settled before the 45-day mark, and last-minute inventory adjustments are unlikely to close the gap.
- — The trough of Kochi’s August is the Obon Saturday, August 15 (sold-out rate 39.5% at 45 days out). It sits below August 22 (41.9%) and August 29 (40.2%), making it the weakest of the month’s three Saturdays.
- — The days after the festival move late. August 13 gained +20.9pt and August 14 +19.1pt in sold-out rate, accumulating largely from 30 days out onward — room to manage them as a separate unit from the festival itself.
- — Business hotels reached sold-out rates of 95.2–96.8% on the two main-festival days, above the all-property average, yet fell to 33.3% on the Obon Saturday — 12.5pt below it (the observed cross-section on festival days is thin, at 18–27 properties).
The Yosakoi Festival 2026 schedule — demand builds from August 9 to 12
According to the official schedule of the Kochi City Tourist Association (公益社団法人高知市観光協会), the 2026 Yosakoi Festival (the 73rd edition) is structured as follows: August 9 (Sun) hosts the Tosa Student Yosakoi Competition, the prayer ceremony and the eve festival; August 10 (Mon) and August 11 (Tue, public holiday) are the main festival days; and August 12 (Wed) is the national competition and after-festival. The association’s page states explicitly that “the Asahi dance venue is closed for 2026,” so the venue line-up differs from the previous year. Reports put participation at 197 teams and roughly 18,000 dancers, with 16 venues announced: Otesuji, Obiyamachi, Kyomachi, Chuo Park, Kochi Castle, Manman, Kamimachi, Kochi Station front, Harimayabashi, Hata, Yanagimachi, Saienba, Atago, Masugata, Umenotsuji and the Asakura campus of Kochi University.
From an accommodation-demand standpoint, what matters is that these four days fall on a Sunday, Monday, Tuesday (a public holiday) and Wednesday — a weekday-centred run. Normally, lodging demand in the prefecture peaks on Saturdays. Indeed, averaging the daily results for all properties in Kochi Prefecture in July 2026, the most recent completed month (N=151–178 properties; monthly average estimated OCC 87.1%), by day of week gives 94.8% on Saturdays against 84.7% on Thursdays and 84.4% on Mondays — the ordinary shape, with Saturday about 10 points higher. The Yosakoi Festival is the kind of event that overwrites that normal day-of-week structure entirely. The Awa Odori festival in Tokushima follows shortly after the Yosakoi main festival, and demand spilling across the two festivals into surrounding areas is a separate subject.
Booking curves for the four festival days — already in the 98% range at 45 days out
Joining the observations from 45 days before the stay date to the present, the difference between the festival days and normal days shows up not in the “slope” but in the “height of the starting point.” The eve festival on August 9 (Sun) was at an estimated OCC of 97.5% at 45 days out, the second main-festival day on August 11 (Tue) at 98.2%, and the national competition and after-festival on August 12 (Wed) at 96.3%. All were already near the ceiling at the 45-day mark, and the gain from there to the latest observation (July 30, 2026) was just +1.3 points for August 9, +1.1 points for August 11 and +1.9 points for August 12.
By contrast, the normal Saturday of August 22 rose from 78.2% at 45 days out to 86.9% at the latest observation (23 days remaining), a gain of +8.7 points, while the Obon Saturday of August 15 rose from 75.8% to 83.6%, a gain of +7.8 points. In other words, normal days still have roughly 8 points to play for in the month or so after the 45-day mark, whereas festival days have almost no room left. How far the four dance-venue days had progressed at 45 days out elsewhere in Shikoku is tracked from the same fixed point in Awaodori 2026: 98.8% Sold 45 Days Out — 39.4pt Over Normal Weekends.
Source: Compiled by MetroEngines Research and the HotelBank Editorial Team
Note that during the festival period fewer properties have confirmable listed inventory, so the number of properties actually measured on any given observation day is smaller than the aggregation base. For August 11 (all properties; aggregation base 176 properties), the range was 82 properties at 45 days out, 85 properties at 30 days out and 74 properties at the latest observation. For the normal Saturday of August 22 (aggregation base 179 properties), the same three fixed points give 126–142 properties. The festival-day figures should be read on the understanding that they rest on a relatively thin observed cross-section.
Ten stay dates compared at fixed points — 45 days out, 30 days out and the latest observation
The table below lines up three fixed points — 45 days out, 30 days out and the latest observation — for ten stay dates, covering the Saturdays and weekdays around the festival as well as Obon and normal Saturdays. All latest observations are as of July 30, 2026, so the closer the stay date, the fewer days remain (for August 29, the 30-day mark and the latest observation give the same value).
| Stay date | Position | 45 days out OCC / sold-out | 30 days out OCC / sold-out | Latest obs. (Jul 30) OCC / sold-out | Observed property count |
|---|---|---|---|---|---|
| Aug 8 (Sat) | Saturday just before the festival | 87.3% / 55.9% | 90.8% / 61.6% | 96.3% / 68.4% | 105–129 |
| Aug 9 (Sun) | Eve festival | 97.5% / 77.3% | 98.4% / 85.2% | 98.8% / 86.9% | 82–97 |
| Aug 10 (Mon) | Main festival, day 1 | 97.9% / 84.1% | 98.5% / 86.4% | 99.5% / 92.0% | 74–85 |
| Aug 11 (Tue, Mountain Day) | Main festival, day 2 | 98.2% / 86.9% | 98.7% / 86.9% | 99.3% / 93.2% | 74–85 |
| Aug 12 (Wed) | National competition / after-festival | 96.3% / 77.4% | 97.4% / 83.6% | 98.2% / 83.1% | 85–99 |
| Aug 13 (Thu) | Day after the festival | 86.3% / 61.6% | 91.2% / 67.8% | 97.9% / 82.5% | 84–132 |
| Aug 14 (Fri) | Friday before Obon | 81.9% / 50.0% | 87.3% / 57.9% | 94.0% / 69.1% | 94–134 |
| Aug 15 (Sat) | Obon Saturday | 75.8% / 39.5% | 79.9% / 42.4% | 83.6% / 45.8% | 125–133 |
| Aug 22 (Sat) | Control: normal Saturday | 78.2% / 41.9% | 83.8% / 46.9% | 86.9% / 46.9% | 126–142 |
| Aug 29 (Sat) | Control: normal Saturday | 81.6% / 40.2% | 85.0% / 44.1% | 85.0% / 44.1% | 100–140 |
Source: Compiled by MetroEngines Research and the HotelBank Editorial Team. Kochi Prefecture, all properties; aggregation base N=176–179 properties
Three points emerge from this table. First, the biggest peak of Kochi’s August is the festival, not Obon. The Obon Saturday of August 15 had a sold-out rate of 39.5% at 45 days out and only 45.8% even at the latest observation — the loosest of the month’s three Saturdays (August 15, 22 and 29). Ranked by sold-out rate at 45 days out, the order is August 22 at 41.9%, August 29 at 40.2% and August 15 at 39.5%, putting the Obon Saturday last. Importing the national sense of peak season into Kochi wholesale leads to misreading where demand actually peaks.
Second, the festival’s afterglow flows into the following days. August 13 (Thu) started from a sold-out rate of 61.6% at 45 days out — high for an ordinary Thursday — and built to 82.5% at the latest observation (+20.9 points). August 14 (Fri) moved from 50.0% to 69.1% (+19.1 points). While the festival itself was settled by the 45-day mark, the following day and the day after that moved largely from 30 days out onward. Extended-stay demand and travel deliberately shifted to avoid the festival may both be at work.
Third, the Saturday immediately before the festival (August 8) is also a different animal from a normal Saturday. Its sold-out rate of 55.9% at 45 days out was 14.0 points above the same metric for August 22 (41.9%), and it reached 68.4% at the latest observation. The festival runs four days, but in terms of lodging demand it is closer to reality to see it as starting on the Saturday before.
Source: Compiled by MetroEngines Research and the HotelBank Editorial Team
By category — business hotels tighten most during the festival and loosen most on the Obon Saturday
Isolating business hotels in Kochi Prefecture (N=62–64 properties), their relationship to the all-property average flips between the festival period and normal periods. On the main festival day of August 10, their sold-out rate at the latest observation was 96.8% (all properties 92.0%); on August 11 it was 95.2% (against 93.2%), with estimated OCC of 99.9% and 99.6% respectively. The eve festival on August 9 was also 87.3% (against 86.9%) — in every case level with or tighter than the all-property average.
On the Obon Saturday of August 15, however, business hotels’ sold-out rate at the latest observation was 33.3% (all properties 45.8%), 12.5 points below. The normal Saturday of August 22 was also lower, at 40.6% (against 46.9%), a gap of 6.3 points, and the day after the festival, August 13, came in at 74.6% (against 82.5%), likewise below the all-property average. The pattern indicates that for the four days of the Yosakoi Festival — and only then — the source of demand for business hotels is swapped out for something different from usual. The relationship in which categories that are already high at 45 days out have less headroom left near the stay date is not unique to Kochi; it is examined from the same 45-day fixed point in Tochigi Booking Curves by Type: Resort 81.1% at T-45, Only +2.6pt Left.
Source: Compiled by MetroEngines Research and the HotelBank Editorial Team
That said, the observed cross-section for business hotels on the four festival days is especially thin. On August 10 and 11, the number of properties for which same-day measurements could be taken was 18–27 (aggregation base 62 properties), even more limited than on the all-property basis. Because the structure is such that the more properties lack confirmable listed inventory the more of them drop out of observation, the category-level festival-day figures are best treated as material for reading direction rather than levels.
For revenue managers running business and city hotels in Kochi City — implications and an action plan
Implications — four readings from the data
(1) The four days of Yosakoi are best regarded as a market whose design work is finished by 45 days out. Market-wide estimated OCC was already 96.3–98.2% at the 45-day mark, and the gain from there to the latest observation was only +1.1 to +1.9 points. If your own curve was already apart from the market at the 45-day mark, that gap is unlikely to be closed by last-minute inventory adjustments. There is value in resetting the starting point of your review from “the final two weeks” to “before the 45-day mark.”
(2) The days from the end of the festival onward, by contrast, still move late. August 13 (Thu) went from a sold-out rate of 61.6% at 45 days out to 82.5% at the latest observation (+20.9 points), and August 14 (Fri) from 50.0% to 69.1% (+19.1 points). How you handle the remaining allocation once the festival itself is locked in can change the result for the month as a whole. Applying the same approach used for the four festival days to August 13 onward risks missing demand that is still in motion.
(3) Do not assume the Obon Saturday is a peak. Of Kochi’s three August Saturdays, the lowest sold-out rate at 45 days out belongs to the Obon Saturday of August 15 (39.5%), below August 22 (41.9%) and August 29 (40.2%). Even at the latest observation it reached only 45.8%. Applying the national peak-season calendar directly to Kochi makes the peaks and troughs of demand look inverted.
(4) Which days are strong differs by category. Business hotels ran sold-out rates of 95.2–96.8% at the latest observation on the two main-festival days, above the all-property average, yet on the Obon Saturday they fell to 33.3%, 12.5 points below the all-property figure (45.8%). It is worth breaking down, date by date, which of the demand sources your property normally relies on — business travel, groups, leisure — is filling which day in August.
Candidate actions by time horizon
The following are candidate actions by time horizon, counted back from the data date (August 1, 2026). They are not guaranteed to produce results and should be adopted or discarded according to your own circumstances.
| Time horizon | Action | Decision trigger | Intent |
|---|---|---|---|
| Today to Aug 8 (immediately before) | Take daily stock of the remaining allocation for Aug 9–12, including same-day cancellation returns | If your own fill for Aug 10 and 11 is clearly loose against the market’s latest observation (estimated OCC 99.3–99.5%) | Avoid leaving remaining rooms idle; keep a receptacle for last-minute demand |
| Today to Aug 8 | Revisit the treatment of Aug 8 (Sat) separately from a normal Saturday | If you are selling Aug 8 on the same terms as an ordinary Saturday (the market was at a sold-out rate of 55.9% at 45 days out, 14.0pt above a normal Saturday’s 41.9%) | Avoid missing demand that begins the day before the festival |
| Aug 13 to Aug 31 (post-festival to month-end) | Track the remaining allocation for Aug 13 (Thu) and Aug 14 (Fri) as a management unit separate from the four festival days | The market moved +14.7pt and +11.2pt in sold-out rate from 30 days out onward; if your own dates are not keeping that pace | Capture demand that moves in the later phase |
| Aug 13 to Aug 31 | Check whether you are treating the Obon week (around Aug 15) and normal Saturdays (Aug 22, Aug 29) as equivalent “Saturdays” | If the market’s sold-out rate at 45 days out puts Aug 15 (39.5%) below Aug 22 (41.9%) and Aug 29 (40.2%) while your own settings are ordered the other way around | Reorder days by demand event rather than by day of week |
| Toward the same week next year (before T-45) | Record the on-sale date for the four festival days and your own OCC at the 45-day mark | If the market reached 96.3–98.2% at 45 days out while your own 45-day performance is not being captured | Build the material to pull next year’s decisions forward from “the final stretch” to “before the 45-day mark” |
| Toward the same week next year | Break down how consecutive stays are composed this year (where within Aug 8–13 guests check in and out) | The market extends demand through Aug 8, Aug 13 and Aug 14; if you design only the four days as peak dates | Widen the design to include length of stay |
Source: Compiled by MetroEngines Research and the HotelBank Editorial Team
Summary — three yardsticks for measuring Kochi’s August
Yardstick 1: the level at 45 days out. The four days of the Yosakoi Festival stood at an estimated OCC of 96.3–98.2% and a sold-out rate of 77.3–86.9% at 45 days out. The level at that stage all but determines the day’s outcome, and the gain after the 45-day mark came to only +1.1 to +1.9 points in estimated OCC. For event days, it is worth recording year by year “what percentage it was at 45 days out.”
Yardstick 2: the size of the gain from 45 days out to the latest observation. The day after the festival, August 13, moved +20.9 points in sold-out rate and August 14 +19.1 points — large late movements. Even within the same month, days with plenty of headroom and days with little are clearly separated. Holding this range for each date gives you a basis for deciding where to concentrate last-minute measures.
Yardstick 3: the gap against a normal Saturday. The gap between the second main-festival day, August 11, and the normal Saturday of August 22 was 45.0 points in sold-out rate and 20.0 points in estimated OCC at 45 days out. Measuring this “distance between event days and normal days” from the same fixed point every year lets you see whether the event’s pull on demand is strengthening or weakening as a difference, rather than as a single year’s level.
About the data
・Definition of estimated OCC (OTA-listed-inventory basis): OTA-listed-inventory-based occupancy = 100 − 100 × rooms remaining on OTA listings ÷ total rooms. It is an estimate based on the take-up of inventory sold on OTAs and differs in definition from actual room occupancy (it comes out higher). The target month of this article is August 2026 (stay-date basis), plus July 2026 as the most recent completed month.
・Booking curve: based on observations from 45 days before the stay date to the present.
・Sold-out rate: the share (estimated) of properties for which no listed inventory can be confirmed on OTAs and similar channels at the time of survey. It refers to the proportion of properties in the aggregation base for which listed inventory could not be confirmed on that observation day.
・Estimated settled ADR (this publication’s common definition; no price metrics are used in this article): the settled price level (tax-exclusive equivalent) estimated from OTA and similar sales data (lowest-plan level × category coefficient, ensembled across multiple channels). Past months are confirmed values; the current and future months are estimates based on the sales situation at present. Median error of 6.6% against published operating results.
・Breakdown of the target N=: all properties in Kochi Prefecture number N=176–179 properties (total rooms 8,165–8,257) depending on the stay date; business hotels number N=62–64 properties (total rooms 5,540–5,599). For the most recent completed month (July 2026), all properties number N=151–178 properties depending on the day. The observed property count range for each date is given in the table in the main text.
・Data as of: August 1, 2026 (final observation date: July 30, 2026). Because sales conditions and inventory change daily, the figures in this article are a snapshot at the time of retrieval.
References and sources
■ Data sources
Aggregation of booking progress in Kochi Prefecture based on daily observation of listed inventory on OTAs and similar channels (compiled by MetroEngines Research and the HotelBank Editorial Team). The scope is all properties in Kochi Prefecture, N=176–179 properties (total rooms 8,165–8,257), of which business hotels are N=62–64 properties (total rooms 5,540–5,599). For the most recent completed month (July 2026), all properties number N=151–178 properties depending on the day. The festival dates and venue line-up were confirmed against the official schedule of the Kochi City Tourist Association. Data as of August 1, 2026; final observation date July 30, 2026.
■ Calculation assumptions
Estimated OCC (OTA-listed-inventory-based occupancy) = 100 − 100 × rooms remaining on OTA listings ÷ total rooms. Sold-out rate = the share of properties in the aggregation base for which listed inventory could not be confirmed on that observation day. The fixed points of comparison are three: 45 days before the stay date, 30 days before, and the latest observation, with the latest observation aligned to July 30, 2026 in every case (the closer the stay date, the fewer days remain; for August 29, the 30-day mark and the latest observation give the same value). No price metrics are used in this article.
■ Limitations and caveats
(1) Estimated OCC is an estimate on an OTA-listed-inventory basis and differs in definition from actual room occupancy (it comes out higher). (2) The sold-out rate is a property-level metric, and because properties without confirmable listed inventory drop out of observation, the observed cross-section is thinner on days when demand is stronger (August 11: 74–85 properties out of an aggregation base of 176; by category, 18–27 out of 62). Category-level festival days are best treated as material for reading direction. (3) The comparison in this article is limited to comparison between dates within the same month; no year-on-year comparison against the same week of the previous year is made. (4) The figures are a snapshot at the time of retrieval, and subsequent changes in the observed population may make the same values impossible to reproduce.
■ Market data and external sources
・Yosakoi Festival event schedule (Kochi City Tourist Association)
・Information on the 2026 Yosakoi Festival in Kochi (Kokohare)
・The 73rd Yosakoi Festival: all participating teams (Kochi Shimbun)
・Yosakoi in Kochi: local festivals (Kochi Visitors & Convention Association)
Related reading
- Awaodori 2026: 98.8% Sold 45 Days Out — 39.4pt Over Normal Weekends
- 94.5% Sold 45 Days Out: Omagari Fireworks vs a Normal Akita Weekend
- Tochigi Booking Curves by Type: Resort 81.1% at T-45, Only +2.6pt Left
- Nagano Late-Summer Booking Curve 2026: Ryokan -11.8pt at 45 Days Out
- Osaka Obon 2026 Booking Curve: Aug 14 at 74.9%, Aug 16 Stuck at 64.1%