

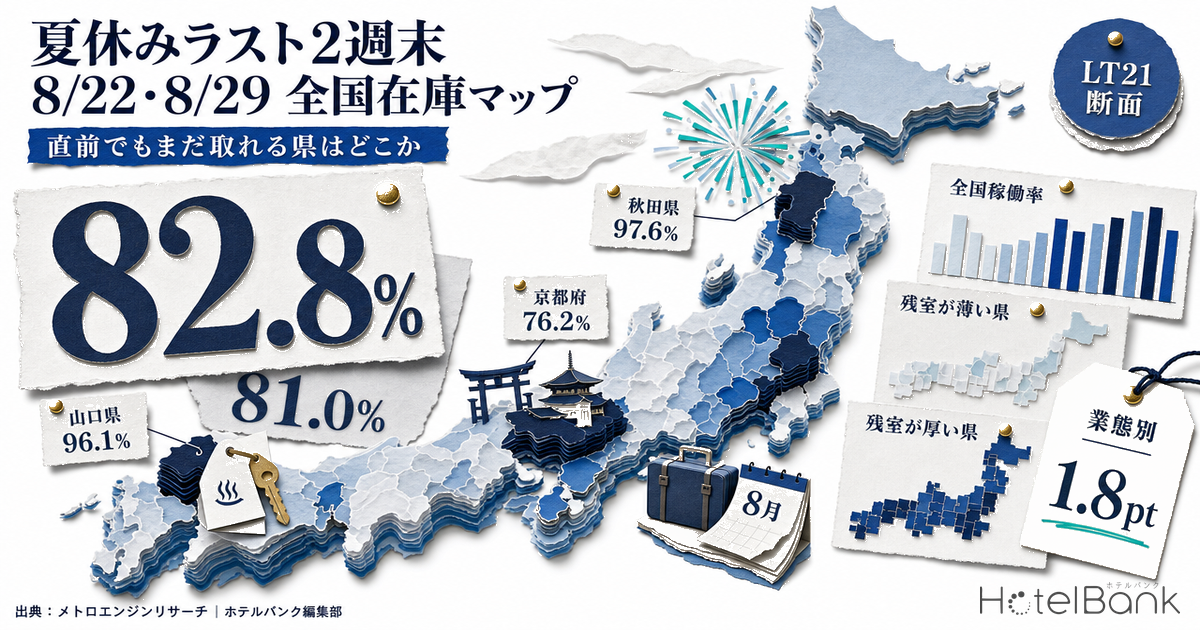
The Obon peak has passed, and only two weekends of Japan’s summer holiday remain. Saturday 22 August and Saturday 29 August 2026 — are these dates already so full that travellers should give up, or are they dates where rooms can still be found at the last minute? We aggregated MetroEngines Research inventory data across all 47 prefectures and examined, on a room-count basis, how much unsold inventory each prefecture holds, how quickly each property type sells through, and what actually moves in the final two weeks.
Metric Definitions Used in This Article
- OCC (occupancy): the share of sold rooms against total rooms within an area (an estimate based on inventory listed on OTAs). Because it is derived from the sell-through of inventory published on OTAs, it differs from a property’s actual overall occupancy.
- LT (lead time): the number of days before the check-in date. LT0 = the day of check-in. All nationwide and prefecture-level comparisons in this article are aligned to LT21 (21 days out) for both 22 August and 29 August.
- Early sell-out LT: the lead time at which remaining rooms first reached zero. A larger value means the property sold out at an earlier stage.
- Listed price: the average selling price published on OTAs (double occupancy, per room, tax included, averaged across all plans). It differs from the actual transacted price.
- Data source: MetroEngines Research
- — 82.8% on 22 August and 81.0% on 29 August, a gap of just 1.8pt on the same LT21 cross-section. Contrary to the intuition that “the final week must be emptier,” 29 August is barely looser.
- — 15 August, the last Saturday of Obon, stood at 78.0% at LT21. Inventory is actually tighter on the final two weekends — a reversal of the usual expectation.
- — The spread between prefectures is roughly 30pt. The thinnest are Yamaguchi at 96.1% (22 Aug) and Akita at 97.6% (29 Aug, Omagari Fireworks); the deepest is Kyoto at 72.0% with 15,300 rooms left. The picture changes entirely depending on which prefecture you choose.
- — The difference between property types lies in the starting position. At LT60, city hotels were at 79.8% against 67.6% for ryokan, while the slope from LT60 to LT21 was a nearly uniform +7.5 to +10.9pt.
- — Sell-through in the final two weeks is essentially uncorrelated with property-type mix (|r| ≤ 0.13); what matters is how much inventory remains (r = -0.36). In absolute rooms, the volume absorbed concentrates in the major metros — 5,314 rooms in Tokyo and 2,835 rooms in Osaka.
22 August is 82.8% nationwide, 29 August is 81.0% — a gap of just 1.8pt
Start with the absolute nationwide level. Compared on the same LT21 cross-section (21 days before check-in), estimated occupancy for Saturday 22 August was 82.8% and for Saturday 29 August 81.0%. The denominator is roughly 1.37 million rooms nationwide, with 236,802 and 260,416 rooms remaining respectively. Shifting the date by a single week adds about 24,000 rooms of availability, yet in percentage terms the difference is only 1.8pt. 29 August is not nearly as loose as the intuition that “the final week must be emptier” would suggest.
What about the most recent observation points? For 22 August, the reading as of 9 August (LT13) was 85.1% with 205,479 rooms left; for 29 August, the reading on the same 9 August (LT20) was 81.3% with 256,434 rooms left. The two cannot be compared directly because the lead times differ, but in both cases roughly 20% of inventory remains in the market. At the national level, the last two weekends of the summer holiday are dates where options still exist even close in.
For reference, consider Obon. Saturday 15 August, at the tail end of Obon, reached only 78.0% at LT21 and 82.3% even at LT7 (243,021 rooms left). 22 August had already hit 85.1% by LT13, meaning inventory is tighter on the last two weekends of the summer holiday than on the final Saturday of Obon. The likely reason is structural: check-in demand concentrates on 13–14 August, which makes 15 August a “travel-home day” with relatively thin lodging demand.
Source: compiled by the HotelBank Editorial Team from MetroEngines Research (all 47 prefectures; median of 18,948 observed properties per cross-section)
Where inventory is thin and where it is deep — Yamaguchi 96.1%, Akita 97.6%
Behind the national average lies a spread of nearly 30pt between prefectures. On 22 August, the thinnest inventory was in Yamaguchi (96.1%, 514 of 13,179 rooms left). Broken down to the municipal level, Yamaguchi City stood at 99.8% (6 rooms left), Shunan at 99.5% (10 rooms) and Ube at 99.4% (7 rooms) — the drying-up started on the business-city side rather than in tourist destinations. Yamaguchi had already reached 91.7% at LT60, and the average listed price rose from ¥37,600 (LT60) to ¥46,900 (LT21). This reads as demand concentration spanning a wide area of the prefecture, though we could not confirm grounds for attributing it to any single specific event.
On 29 August, the thinnest was Akita (97.6%, 249 of 10,280 rooms left), and here the driver is clear. The 98th National Fireworks Competition, the “Omagari Fireworks” — one of Japan’s three great fireworks festivals — is held that day. Akita had already reached 97.4% at LT60, effectively a market that “fills the moment it goes on sale.” In the same prefecture one week earlier, on 22 August, occupancy was 80.1% (2,122 rooms left), below the national average, showing that a single event rewrites an entire prefecture’s inventory on a week-by-week basis. Where Akita’s sell-through diverges between the Omagari Fireworks date and an ordinary weekend is traced back to 45 days out in 94.5% Sold 45 Days Out: Omagari Fireworks vs a Normal Akita Weekend.
| Prefecture | Estimated OCC | Rooms left | Total rooms | Observed properties |
|---|---|---|---|---|
| Yamaguchi | 96.1% | 514 | 13,179 | 219 |
| Okayama | 91.9% | 1,206 | 14,939 | 262 |
| Miyagi | 91.4% | 2,304 | 26,650 | 335 |
| Aomori | 91.1% | 1,181 | 13,336 | 188 |
| Iwate | 90.0% | 1,659 | 16,516 | 285 |
| Kagawa | 88.7% | 1,363 | 12,053 | 281 |
| Mie | 88.3% | 2,384 | 20,395 | 446 |
| Kochi | 88.0% | 994 | 8,266 | 172 |
| Miyazaki | 87.7% | 1,534 | 12,429 | 226 |
| Hiroshima | 87.6% | 3,343 | 27,050 | 404 |
Source: compiled by the HotelBank Editorial Team from MetroEngines Research
| Prefecture | Estimated OCC | Rooms left | Total rooms | Observed properties |
|---|---|---|---|---|
| Tokushima | 66.6% | 2,114 | 6,325 | 143 |
| Ibaraki | 74.2% | 4,746 | 18,423 | 323 |
| Nara | 74.9% | 1,772 | 7,061 | 180 |
| Oita | 75.1% | 4,552 | 18,312 | 586 |
| Kyoto | 76.2% | 13,066 | 54,829 | 1125 |
| Saga | 78.3% | 1,474 | 6,800 | 175 |
| Tochigi | 78.3% | 5,161 | 23,804 | 616 |
| Osaka | 78.5% | 23,887 | 111,006 | 715 |
| Aichi | 78.8% | 11,739 | 55,274 | 548 |
| Saitama | 79.4% | 3,599 | 17,435 | 225 |
Source: compiled by the HotelBank Editorial Team from MetroEngines Research
Somewhat unexpectedly, the deepest inventory on 22 August is found in a combination of major metros and tourist destinations. Kyoto stood at 76.2% with 13,066 rooms left, Osaka at 78.5% with 23,887 rooms, and Aichi at 78.8% with 11,739 rooms. In absolute terms, these three prefectures alone held roughly 49,000 unsold rooms. In high-rate urban markets, summer business demand thins out and leisure demand disperses, so the Saturday after Obon tends to loosen structurally.
Tokushima, at 66.6%, is the lowest in the country, but this prefecture showed a discontinuous move on 8 August (LT14), when rooms left dropped from 1,950 to 971 — a decline of about 980 rooms in a single day. The number of observed properties was stable at 143, so this most likely stems from an inventory adjustment at a large property. It is treated as an outlier in the analysis that follows.
| Prefecture | Estimated OCC | Rooms left | Total rooms | Observed properties |
|---|---|---|---|---|
| Akita | 97.6% | 249 | 10,280 | 202 |
| Iwate | 93.7% | 990 | 15,806 | 282 |
| Miyagi | 92.1% | 2,092 | 26,351 | 336 |
| Kagawa | 89.5% | 1,270 | 12,062 | 285 |
| Kochi | 88.6% | 939 | 8,205 | 175 |
| Hokkaido | 87.0% | 12,096 | 93,344 | 1353 |
| Nagano | 86.0% | 5,381 | 38,489 | 1302 |
| Aomori | 85.9% | 1,876 | 13,317 | 185 |
| Kumamoto | 83.9% | 3,475 | 21,542 | 491 |
| Tokyo | 83.9% | 29,367 | 182,836 | 1360 |
Source: compiled by the HotelBank Editorial Team from MetroEngines Research
| Prefecture | Estimated OCC | Rooms left | Total rooms | Observed properties |
|---|---|---|---|---|
| Kyoto | 72.0% | 15,300 | 54,644 | 1110 |
| Kagoshima | 72.1% | 5,746 | 20,562 | 515 |
| Nara | 72.3% | 1,971 | 7,109 | 182 |
| Toyama | 72.5% | 3,537 | 12,872 | 193 |
| Ibaraki | 72.9% | 5,003 | 18,449 | 328 |
| Shimane | 73.3% | 2,407 | 9,014 | 255 |
| Tottori | 74.6% | 2,134 | 8,394 | 186 |
| Ehime | 74.7% | 3,785 | 14,989 | 279 |
| Tochigi | 74.8% | 5,962 | 23,674 | 609 |
| Gunma | 75.0% | 5,128 | 20,511 | 567 |
Source: compiled by the HotelBank Editorial Team from MetroEngines Research
Turning to 29 August, three Tohoku prefectures top the list (Akita 97.6%, Iwate 93.7%, Miyagi 92.1%). The pattern suggests the Omagari Fireworks absorbed inventory within Akita and that the pressure spilled over into neighbouring prefectures. The deepest, conversely, are Kyoto (72.0%, 15,300 rooms left), Kagoshima (72.1%, 5,746 rooms), Nara (72.3%) and Toyama (72.5%). Kyoto ranks among the “deep inventory” prefectures on both 22 and 29 August, with more than 15,000 rooms still available as of 29 August. For anyone looking to secure a major Kansai destination close in, these two weekends are a realistic option.
Source: compiled by the HotelBank Editorial Team from MetroEngines Research
By property type — city hotels sell fastest, ryokan slowest
Sell-through speed follows a consistent order by property type. Estimated occupancy on the LT21 cross-section for 22 August ran city hotels 87.3% > resort hotels 83.4% > business hotels 83.1% > ryokan 78.0%. The order was unchanged on 29 August: city 85.9% > resort 82.4% > business 81.5% > ryokan 75.4%. The gap between city hotels and ryokan widens from 9.3pt (22 August) to 10.5pt (29 August).
| Property type | Saturday 22 August | Saturday 29 August | LT21 gap | |||||
|---|---|---|---|---|---|---|---|---|
| LT60 | LT30 | LT21 | LT13 | LT60 | LT30 | LT21 | ||
| City hotels | 79.8% | 85.3% | 87.3% | 88.8% | 79.2% | 84.4% | 85.9% | +1.4pt |
| Resort hotels | 72.7% | 81.3% | 83.4% | 85.3% | 72.3% | 80.3% | 82.4% | +1.0pt |
| Business hotels | 72.2% | 80.1% | 83.1% | 85.6% | 70.7% | 78.4% | 81.5% | +1.6pt |
| Ryokan | 67.6% | 76.0% | 78.0% | 80.3% | 66.2% | 72.9% | 75.4% | +2.6pt |
Source: compiled by the HotelBank Editorial Team from MetroEngines Research (22 August: 1,068 city / 1,453 resort / 6,700 business / 6,016 ryokan properties)
What is striking is that the slopes of the curves are almost identical. The rise from LT60 to LT21 was +7.5pt for city hotels, +10.7pt for resorts, +10.9pt for business hotels and +10.4pt for ryokan (all for 22 August). In other words, property types do not differ in when they start selling — they differ in where they start. City hotels had already locked in 79.8% at LT60, and that lead never closes.
The low reading for ryokan warrants caution. Ryokan typically sell with two meals included, and many rely heavily on direct bookings or travel agencies. They may deliberately limit the allotment released to OTAs, or add inventory in small increments as check-in approaches, so the OTA-based vacancy rate does not necessarily reflect the property’s overall availability. That said, listed prices at LT21 stood at ¥39,700 for ryokan against ¥19,900 for business hotels — nearly a twofold gap — so it is fair to say that the room to “secure a high-rate property at the last minute” is greater on the ryokan and resort side.
Source: compiled by the HotelBank Editorial Team from MetroEngines Research
What prefectures that fill up in the final two weeks share is not “property type” but “how much is left”
So which prefectures suddenly fill up in the final two weeks? For 22 August, we measured how much estimated occupancy rose across all 47 prefectures over the eight days from LT21 (observed 1 August) to LT13 (observed 9 August). Observed property counts were stable in every prefecture over this window (minimum ratio of 0.97 or above), so apparent movement caused by shifts in the sample can be ruled out.
The result was unambiguous: the correlation between the rise and property-type mix is essentially zero. The correlation coefficient against business-hotel share was -0.07, against city-hotel share -0.07, against resort share +0.13 and against ryokan share -0.02 (46 prefectures, excluding Tokushima). Arguments framed around property type — “it’s a business market so it moves late,” “it’s ryokan territory so it fills early” — cannot explain what happens in the final two weeks.
The only meaningful correlation was with the occupancy level itself at LT21 (correlation coefficient -0.36). The fuller a prefecture already is, the less headroom it has left close in — an unsurprising structure. Indeed, Yamaguchi at 96.1% at LT21 moved -0.4pt over the eight days (inventory edged up), Iwate at 90.0% moved +0.8pt and Hiroshima at 87.6% only +0.9pt. Conversely, Kanagawa at 79.6% rose +3.9pt and Ishikawa at 79.9% rose +3.1pt. This relationship — the higher a segment stands 45 days out, the less it can add close in — is also observed within prefectures and by property type; Tochigi Booking Curves by Type: Resort 81.1% at T-45, Only +2.6pt Left decomposes the same structure by property type.
Source: compiled by the HotelBank Editorial Team from MetroEngines Research (N=46 prefectures; Tokushima excluded due to discontinuous inventory movement)
The picture changes, however, when viewed in rooms rather than rates. Over these eight days, rooms absorbed totalled 5,314 in Tokyo, 2,835 in Osaka, 1,873 in Kanagawa, 1,620 in Okinawa and 1,280 in Fukuoka — roughly 13,000 rooms across the top five. The absolute volume of last-minute demand is overwhelmingly concentrated in the major metros; the small percentage gains simply reflect large denominators. Put another way, in the big cities “rooms do come back close in, but they move fast, too.” As of 9 August, Tokyo still had 28,815 rooms and Osaka 21,052 rooms available.
Price movements are consistent with this. Over the same eight days, listed prices rose in thin-inventory regional prefectures — Kochi +8.8%, Okayama +7.9%, Aomori +7.4%. They fell in Chiba -4.3%, Oita -4.1%, Tottori -4.1% and Tokyo -3.4%, indicating a tendency for prices to soften close in where inventory has been carried over. The correlation between the occupancy rise and the price change rate is a weak +0.27, so it is more natural to read this as prices moving as a result of how full the market is, rather than price moves determining how it fills.
Properties that sold out early — 100-plus rooms, gone more than 60 days out
Behind prefecture-level averages are individual properties that sell out far earlier. We filtered to properties with 100 or more total rooms that publish at least 50% of their rooms on OTAs, and extracted those whose remaining rooms first reached zero at a lead time of 30 days or more and that were observed sold out for 20 days or more. All figures are measured on a room-count basis; ratios of plan counts are not used.
| Prefecture | Property | Total rooms | Type | Early sell-out LT | Sold-out days observed | Latest rooms left |
|---|---|---|---|---|---|---|
| Hokkaido | Hotel Daiheigen (ホテル大平原) | 162 | Ryokan | LT89 | 75 days | 0/162 as of LT13 |
| Nagasaki | Art Hotel Sasebo Central (アートホテル佐世保セントラル) | 170 | City hotel | LT64 | 37 days | 0/170 as of LT13 |
| Okayama | Super Hotel Inn Kurashiki Mizushima (スーパーホテル Inn倉敷水島) | 152 | Business hotel | LT60 | 45 days | 0/152 as of LT13 |
| Miyazaki | Hotel Alpha-One Miyakonojo (ホテル・アルファ-ワン都城) | 273 | Business hotel | LT47 | 33 days | 0/273 as of LT13 |
| Kagoshima | Hotel Route Inn Satsumasendai (ホテルルートイン薩摩川内) | 152 | Business hotel | LT44 | 31 days | 0/152 as of LT13 |
| Tokyo | Sauna & Capsule Hotel Hokuou (サウナ&カプセルホテル北欧) | 198 | Capsule hotel | LT43 | 31 days | 0/198 as of LT13 |
| Yamaguchi | Hagi Royal Intelligent Hotel (萩ロイヤルインテリジェントホテル) | 116 | Business hotel | LT43 | 23 days | 3/116 as of LT12 |
| Tokyo | Capsule Land Yushima (カプセルランド湯島) | 112 | Capsule hotel | LT43 | 29 days | 2/112 as of LT12 |
| Miyazaki | Hyuga Daiichi Hotel (日向第一ホテル) | 100 | Business hotel | LT43 | 26 days | 2/100 as of LT12 |
Source: compiled by the HotelBank Editorial Team from MetroEngines Research
Hokkaido’s Hotel Daiheigen (ホテル大平原, 162 rooms, ryokan) reached zero rooms for 22 August as early as LT89 and stayed sold out for a cumulative 75 days. As of 9 August (LT13) it was still 0 of 162 rooms. As an onsen ryokan in the Tokachi area, it evidently has an established base of guests who lock in the last Saturday of the summer holiday well in advance. Okayama’s Super Hotel Inn Kurashiki Mizushima (スーパーホテル Inn倉敷水島, 152 rooms) publishes 96.1% of its total rooms on OTAs, and on that basis sold out from LT60 for a cumulative 45 days — given the size of the published allotment, a clear case of genuine demand filling the house.
Nagasaki’s Art Hotel Sasebo Central (アートホテル佐世保セントラル, 170 rooms, city hotel) was sold out from LT64 for a cumulative 37 days. Miyazaki’s Hotel Alpha-One Miyakonojo (ホテル・アルファ-ワン都城, 273 rooms) also sold out from LT47 at that scale, showing the drawing power that large business hotels in regional core cities hold on summer Saturdays. Tokyo’s Sauna & Capsule Hotel Hokuou (サウナ&カプセルホテル北欧, 198 rooms) sold out from LT43 and LT44 on both 22 and 29 August, suggesting that central-Tokyo lodging demand is concentrating in specific property types.
Methodology and sample size
The data in this article was compiled as follows. Estimated occupancy by prefecture and by property type is derived from OTA-listed inventory for roughly 27,000 domestic properties tracked by MetroEngines Research: for all 47 prefectures we obtained the trajectory of remaining rooms for check-in on 15, 22 and 29 August, and calculated the share of sold rooms against total rooms. All nationwide comparisons are aligned to the same LT21 cross-section, and for date-to-date prefecture comparisons we confirmed that observed property counts were nearly identical on both dates (the difference between 22 and 29 August was within 3% in every prefecture). Days on which the observed property count fell below 60% of the cross-section median (partial-observation days) are excluded from the charts.
For the sell-out assessment of individual properties, we applied a condition across all prefectures limiting the population to properties publishing at least 30% of their total rooms on OTAs. Under this condition, the 47-prefecture totals are 7,106 properties out of 12,851 with observation data for 22 August, and 7,337 properties out of 12,837 for 29 August. Because the query itself is capped at a maximum of 800 properties per prefecture, the combined 36,709 properties should be read as a lower bound on the candidate pool. Properties publishing less than 30% are excluded because several explanations are possible — operations centred on non-OTA channels (direct official-site sales, travel agencies, corporate contracts), the practice of adding inventory in small increments, or small contractual allotments — and reading supply-demand from such properties’ remaining rooms carries large error. How much of their total rooms properties actually allocate to OTAs is measured at national scale in Median 39.2% of Rooms Online — Allocation Across 12,941 Hotels.
There are cases, such as Akita on 29 August, where the properties meeting the 30%-published condition narrow to 31 out of 208. Individual-property rankings for prefectures with small populations should be treated as reference values, but prefecture-level estimated occupancy is aggregated on a total-room basis and is unaffected by this filtering.
Close-in vacancy rates by remaining inventory and by incremental gain
Every figure so far is an observed cross-section. The following table folds them into one. For 22 August, the measured LT21→LT13 incremental gain ranged from -0.4pt in Yamaguchi (remaining rooms edged up as inventory was added) to +3.9pt in Kanagawa, with a national average of +2.3pt. Applying that measured range to the 29 August LT21 cross-section, which has not yet reached LT13 (81.0%, 260,416 rooms left, roughly 1.37 million total rooms), shows the range within which close-in market availability would fall.
| Level of incremental gain | Gain | Converted estimated OCC | Converted rooms left | Difference vs baseline | Basis for the level |
|---|---|---|---|---|---|
| Market with a small gain (Yamaguchi type) | -0.4pt | 80.6% | 265,604 | +5,188 | Measured value for a prefecture where inventory had dried up and rooms left edged up close in as inventory was added |
| National average (measured, 22 August) | +2.3pt | 83.3% | 228,638 | -31,778 | Measured LT21→LT13 gain aggregated across all 47 prefectures |
| Market with a large gain (Kanagawa type) | +3.9pt | 84.9% | 206,733 | -53,683 | Measured value for the prefecture with ample remaining inventory that captured the most close-in demand |
Source: compiled by the HotelBank Editorial Team from MetroEngines Research (a conversion substituting the measured values stated in the text into the definitional formula; not a forecast of future occupancy)
That is a spread of roughly 59,000 rooms — 4.3% of the national total room count. How much inventory remains in the market in the final two weeks changes this much depending on whether the gain lands closer to the Yamaguchi case or the Kanagawa case. Seen the other way round, even if the market moves in line with the national average, more than 220,000 rooms would still be in the market close in.
The next table expands the same conversion across combinations of prefecture-level remaining inventory and incremental gain. Rows are the range of estimated OCC covered by the prefecture tables above (measured values run from Tokushima 66.6% to Akita 97.6%); columns are the five gain levels measured for 22 August. Each cell is the close-in vacancy rate (= 100% − estimated OCC − gain), which is simply a rearrangement of the definitional formula.
| Estimated OCC at LT21 | -0.4pt Yamaguchi | +0.8pt Iwate | +2.3pt National avg. | +3.1pt Ishikawa | +3.9pt Kanagawa |
|---|---|---|---|---|---|
| 70% | 30.4% | 29.2% | 27.7% | 26.9% | 26.1% |
| 75% | 25.4% | 24.2% | 22.7% | 21.9% | 21.1% |
| 80% | 20.4% | 19.2% | 17.7% | 16.9% | 16.1% |
| 85% | 15.4% | 14.2% | 12.7% | 11.9% | 11.1% |
| 90% | 10.4% | 9.2% | 7.7% | 6.9% | 6.1% |
| 95% | 5.4% | 4.2% | 2.7% | 1.9% | 1.1% |
Source: compiled by the HotelBank Editorial Team from MetroEngines Research (both axes are measured values from the text; cells are conversions from the definitional formula)
Reading it is straightforward. In markets already above 90% at LT21, the close-in vacancy rate falls to 7.7% even with an average gain, and to 6.1% if it runs at the Kanagawa level. In a market at 75% at LT21, by contrast, 21.1% of inventory remains even under the fastest movement. What determines “whether you can book close in” is not the speed of the incremental gain but the amount of inventory left at LT21 — the structure indicated by the -0.36 correlation coefficient also shows up here as the drop down each column (a 25pt difference between the 70% and 95% rows within the same column).
Conclusion
The national picture for the last two weekends of the summer holiday comes down to four points. First, the gap between 22 August (82.8%) and 29 August (81.0%) is only 1.8pt, and both are tighter than the last Saturday of Obon on 15 August (78.0% at LT21). Second, at prefecture level there are exhausted markets such as Yamaguchi at 96.1% and Akita at 97.6%, while Kyoto remains in the 70s on both dates with 13,000–15,000 rooms left — the situation differs completely depending on which prefecture you choose.
Third, by property type, city hotels move fastest and lock in 79.8% by LT60, whereas ryokan are slowest at 78.0% (LT21). The slopes of the curves, however, are nearly identical across types; the difference originates in the starting position. Fourth, what prefectures that fill up in the final two weeks share is not their property-type mix but simply how much inventory remains at that point. In percentage terms the regional prefectures appear to move, but the absolute number of rooms absorbed is concentrated in the major metros — Tokyo, Osaka and Kanagawa.
From an operator’s perspective, the national average moved +2.3pt over the eight days from LT21 to LT13. In markets already above 90%, the play is to add rate; in markets still in the 70s, it is exposure and communicating the value of the stay — the same “final two weeks” calls for opposite actions. Check whether your own property tracks closer to the national average or to your local prefecture, then build the sales plan for the remaining two weekends accordingly.
⚠ Note on data for future dates: the remaining rooms, occupancy rates and listed prices in this article are all estimates based on inventory and selling prices published on OTAs as of 9–10 August 2026. They will fluctuate as check-in approaches through the addition of new plans, cancellations and inventory adjustments by properties. In particular, even for properties observed at zero rooms left, inventory routinely returns through cancellations.
Related Reading
- 94.5% Sold 45 Days Out: Omagari Fireworks vs a Normal Akita Weekend
- Tochigi Booking Curves by Type: Resort 81.1% at T-45, Only +2.6pt Left
- Median 39.2% of Rooms Online — Allocation Across 12,941 Hotels
- Kyoto Obon 2026 Booking Curves: Ryokan Add the Most Close In, +11.4pt
- Obon T-7: Kyushu’s 31.7pt Gap — Fukuoka 73.0%, Kagoshima 41.3%
- Okayama Booking Curves: 3 Checkpoints, Aug 8 Late-Surges +11.8pt
- Tokyo Aug 14: 434 Hotels, Front-Loaded 10.8% vs Late-Surge 9.4%
References and Sources
- MetroEngines Research — OTA-listed inventory data for all 47 prefectures (check-in dates 15, 22 and 29 August 2026; median of 18,948 observed properties per cross-section)
- Dates and event information for the 98th National Fireworks Competition “Omagari Fireworks” (Daisen City) | Walkerplus
- 2026 Omagari Fireworks Festival Guide (JR East)
- List of fireworks festivals in Yamaguchi Prefecture, August 2026 | Walkerplus
- Kanmon Strait Fireworks Festival event information (Shimonoseki Tourism and Convention Association)
■ Data source
OTA-listed inventory data for roughly 27,000 domestic properties tracked by MetroEngines Research. The trajectory of remaining rooms was obtained for all 47 prefectures for check-in on 15, 22 and 29 August 2026 (median of 18,948 observed properties per cross-section). Both prefecture and property-type comparisons are aligned to the same LT21 cross-section (21 days before check-in). Sell-out assessments for individual properties use only properties publishing at least 30% of their total rooms on OTAs, judged on cross-sections at LT7 or earlier.
■ Calculation assumptions
Estimated OCC = 1 − (rooms left ÷ total rooms). The national figure is calculated by dividing the sum of rooms left across all 47 prefectures by the sum of total rooms, and prefecture- and property-type-level figures use the same definition. The incremental gain in the final two weeks is the difference in estimated OCC between LT21 (observed 1 August) and LT13 (observed 9 August). The conversion and sensitivity tables substitute the measured values stated in the text (gains of -0.4 to +3.9pt, estimated OCC of 70–95%, and the 29 August LT21 cross-section of 260,416 rooms left against roughly 1.37 million total rooms) into that definitional formula; they are arithmetic conversions, not forecasts of future occupancy.
■ Limitations and caveats
The estimated OCC in this article is based on OTA-listed inventory and differs from a property’s actual overall occupancy. Ryokan typically sell with two meals included and rely heavily on direct and travel-agency channels, so their OTA vacancy rate may appear higher than the property’s overall vacancy. Tokushima was excluded from the correlation analysis because of a discontinuous inventory movement of about 980 rooms on 8 August 2026. For Akita on 29 August, the properties meeting the 30%-published condition narrow to 31 out of 208, so individual-property rankings for that prefecture should be treated as reference values. Queries are capped at a maximum of 800 properties per prefecture. Because these are future dates, the figures will fluctuate with new plan additions, cancellations and inventory adjustments.