

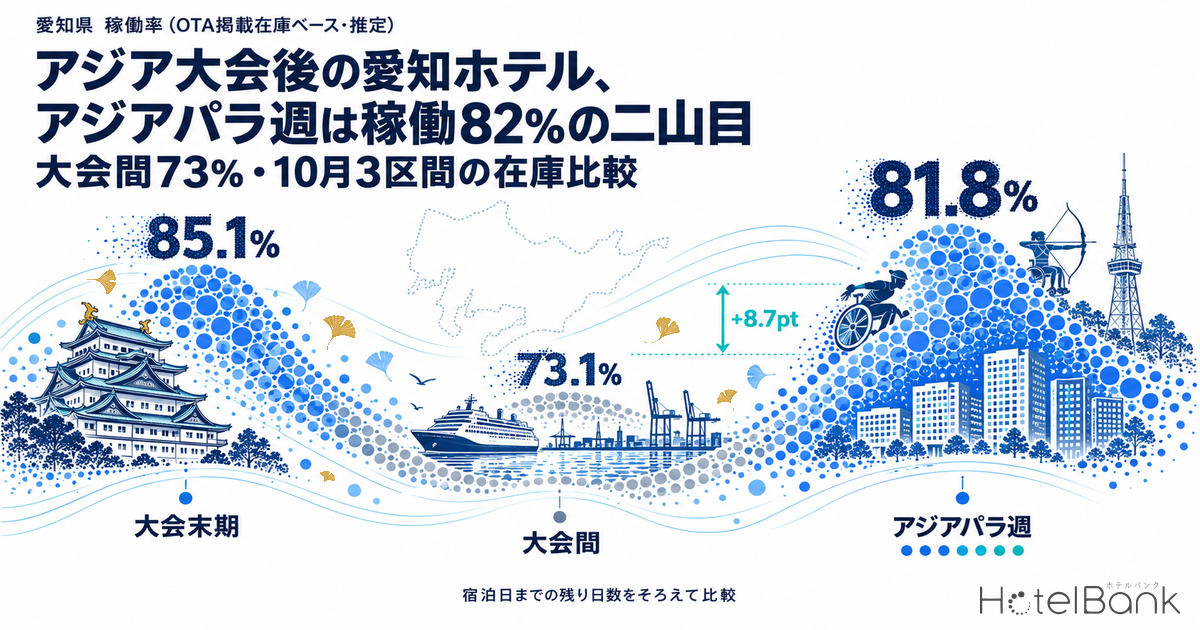
The 20th Asian Games (2026 Aichi-Nagoya) held their closing ceremony on Sunday, October 4, and hotels and other lodging in Aichi entered the “between-Games” window that runs until the 5th Asian Para Games open 14 days later (October 18–24). Lining up MetroEngines Research observations as of October 3 at the same cross-section — 21 days before each stay date — prefecture-wide occupancy (OTA-listed inventory basis, estimated) was 85.1% for the final days of the Asian Games (October 1–4), 73.1% for the between-Games window (October 5–17), and 81.8% for Para Games week (October 18–24). The second peak comes within 3.3pt of the tail of the first and sits 8.7pt above the between-Games window. This article compares the three windows by hotel type and by city/ward, and looks at how Aichi’s lodging operators and asset-management and investment teams can capture the autumn’s second peak.
The supply-side design of housing the athletes’ village on ships is covered in Asian Games 2026: 1,500 Ship Rooms vs Nagoya’s 28,986-Room Stock. This article looks past the sell-out around the opening ceremony, at the two weeks after the closing ceremony and at Para Games week.
Metric Definitions Used in This Article
- OCC (occupancy): Rooms sold as a share of total rooms in the area (estimated from OTA sales inventory). Written in the text as “occupancy (OTA-listed inventory basis, estimated)”. It is an estimate based on how inventory sold through OTAs is being absorbed and differs from a property’s actual overall occupancy. Coverage is properties in Aichi that list 30% or more of their total rooms on OTAs and similar channels (344–369 properties / 33,294–34,672 rooms depending on the stay date, based on major booking-site listings). It is used only for prefecture- and city/ward-level aggregates; occupancy is not calculated for individual properties.
- LT (lead time): Days before the stay date. “21 days before” means LT21 and “the day before” means LT1. This article uses only observations within LT45.
- Remaining rooms / remaining-room rate: The total of rooms still available for sale on OTAs and similar channels, and that total as a share of total rooms (room-count basis).
- Listed price: The average selling price listed on OTAs and similar channels at the time of observation (per-room rate for two guests sharing one room, tax included, average across all plans). Not the same as the settled room rate (ADR).
- ADR (average daily rate): An estimated settled room rate (tax-excluded equivalent), calculated by applying a hotel-type adjustment factor to the lowest-priced plan each property publishes on OTAs (per-room rate for two guests sharing one room, tax included). Checked against property-level results disclosed by listed hotel REITs (91 properties, most recent three months), the median error is about 7%. It is an estimate and differs from each property’s actual settled prices and accounting figures. Area-level ADR is the median of the properties covered (the level of a typical property in the area). Only closed months are used in this article.
- Observation date: Area aggregates as of October 3, 2026; property-level inventory as of October 4, 2026 (October 3 for some properties).
- Data source: MetroEngines Research
- — At 21 days before the stay date, Para Games week shows occupancy of 81.8% (October 18–24, 2026; N=344–346 properties). That is 3.3pt below the 85.1% of the Asian Games’ final days and 8.7pt above the 73.1% of the between-Games window.
- — In the Games’ final days, October 1–3 reached 93.8–95.8% as of the day before. The night of the closing ceremony, October 4, came in at 84.4% with a listed price of ¥17,100 — back to the August average (82.5%, ¥17,100).
- — The first between-Games week (October 5–9) stood at 67.6% at 21 days out, 2.0pt from the 65.6% of a normal pre-Games week (September 7–11). It has since built to 80.7% in the latest observation, following the same pattern as the normal week.
- — Para Games week weekdays were at 82.2% at 21 days out, 16.6pt above the normal week. The uplift is concentrated in business hotels (+18.2pt) and city hotels (+16.4pt), while ryokan gained only +1.9pt. Against the following week (at 28 days out), Aichi is +13.5pt versus ±0.0 to +8.2pt for the four neighboring prefectures.
- — In property-level inventory as of October 4, Para Games week remaining-room rates are low in Nishi-Mikawa — Anjo 7.4%, Okazaki 8.6%, Toyota 10.3% — while room remains in Minamichita (37.3%), Nishio (32.7%) and Tahara (31.8%).
- — Estimated settled ADR for the latest closed month (August 2026) was ¥17,800 in Gamagori and ¥16,500 in Minamichita, versus ¥9,600 in Nagoya’s Nakamura Ward, ¥7,600 in Toyota and ¥6,400 in Kariya. The second peak sits on the tier that normally prices at ¥6,000–¥10,000.
No Athletes’ Village for the Para Games: Existing Hotels Take the Lead, With Hosting Running October 11–26
First, a look at how the two Games are housing athletes, based on published documents. The organizing committee decided not to build an athletes’ village and to secure team accommodation using hotels and other existing facilities. An announcement on May 8, 2024 envisaged about 50 team accommodation facilities for the Asian Games: “about 10 in Nagoya City plus a hotel ship, about 30 elsewhere in Aichi, and about 10 outside the prefecture” (with a note that the number could change depending on contract negotiations). For the team accommodation bases at the Port of Nagoya, materials from the City of Nagoya’s promotion headquarters meeting (August 28, 2026) give the number of people staying and the operating period for each Games as follows.
| Item | Asian Games | Asian Para Games |
|---|---|---|
| Dates | Sat, September 19 – Sun, October 4 | Sun, October 18 – Sat, October 24 |
| Garden Pier (mobile accommodation): people staying | About 2,000 | About 800 |
| Garden Pier: operating period | September 6 – October 6 | October 11 – October 26 |
| Kinjo Pier (cruise ship): people staying | About 4,000 | — (not used) |
| Kinjo Pier: operating period | September 16 – October 5 | — |
Source: Compiled by HotelBank Editorial Team from materials for the City of Nagoya’s “31st Nagoya City Asian Games and Asian Para Games Promotion Headquarters Meeting” (August 28, 2026)
So where is the Para Games athletes’ village? The answer is that no village is being built; teams are housed through a combination of the port base and existing lodging. The Asian Para Games master plan expects 3,600–4,000 team members (athletes and team officials) and says team accommodation will “use multiple existing lodging facilities,” allocated in principle by sport. Simply subtracting the roughly 800 at Garden Pier implies around 2,800–3,200 people staying in existing lodging (a difference between two planned figures, not actual room allocations). The plan also provides hotels for up to 800 technical officials and up to 800 members of the APC Family, while an expected 2,500 media are to book their own accommodation.
From a lodging-market perspective, two points stand out. First, Garden Pier operates for 16 days, October 11–26, a wider window than the seven days of competition. Second, venues are spread beyond Nagoya to Okazaki (archery, sitting volleyball), Ichinomiya (badminton), Toyohashi (goalball), Toyota (table tennis) and Kariya (wheelchair rugby). Combined with sport-by-sport room allocation, this suggests the second peak will rise not only around Nagoya Station and Sakae but also in the cities hosting venues. The rest of this article checks that against actual inventory.
Putting October’s Three Windows on the Same Yardstick: 85%, 73% and 82% at 21 Days Out
Viewed as of October 3, October’s stay dates are a mix of nights already past, nights a few days away and nights three weeks out. Because bookings build toward the stay date, simply lining up the latest figures makes nearer dates look higher. This article therefore compares every stay date at the same cross-sections — 28 days and 21 days before the stay date — and also shows the latest observation together with the days remaining.
| Window (stay dates) | 28 days before | 21 days before | Latest observation (days remaining) | Remaining rooms (latest, daily average) | Listed price (latest) |
|---|---|---|---|---|---|
| Games’ final days (10/1–10/4) | 83.5% | 85.1% | 92.4% (day before) | 2,579 rooms | ¥26,772 |
| Between Games (10/5–10/17) | 70.0% | 73.1% | 82.0% (2–14 days before) | 6,000 rooms | ¥22,039 |
| Para Games week (10/18–10/24) | 79.3% | 81.8% | 83.8% (15–21 days before) | 5,436 rooms | ¥24,866 |
| Reference: following week (10/25–10/31) | 67.4% | — | 69.1% (22–28 days before) | 10,404 rooms | ¥19,718 |
| Reference: August 2026 monthly average | — | — | 82.5% (day before) | — | ¥17,145 |
Source: Compiled by HotelBank Editorial Team from MetroEngines Research (Aichi; 344–360 properties / 33,294–34,580 rooms; August: 337 properties / 33,846 rooms; based on major booking-site listings; as of October 3, 2026)
On the same 21-day basis, Para Games week at 81.8% is only 3.3pt lower than the Games’ final days at 85.1%. The between-Games window in the middle is 73.1%, 8.7pt below Para Games week. The ranking holds at 28 days out as well, where Para Games week (79.3%) is 11.9pt above the following week (October 25–31) at 67.4%. October in Aichi takes the shape of “peak, plateau, peak, plateau.”
The latest-observation column cannot be compared directly across rows, because days remaining differ by window. Even so, it is striking that Para Games week, with 15–21 days still to go, is already at 83.8% — above the 82.0% of the between-Games window, which is only 2–14 days out. The August average of 82.5% is a day-before figure, meaning Para Games week has topped that level three weeks ahead.
Source: Compiled by HotelBank Editorial Team from MetroEngines Research (Aichi; 344–360 properties / 33,294–34,580 rooms; based on major booking-site listings. Bars = 28 days before each stay date; line = latest observation as of October 3, 2026)
The Games’ Final Days (October 1–4): Around 95% Until the Night Before the Closing, Back to August Levels on Closing Night
Start with how the first peak ended. For the three nights from Thursday, October 1 to Saturday, October 3, day-before occupancy was 93.8–95.8%, and remaining rooms across the prefecture were held to 1,390–2,151. Listed prices also stayed at ¥25,700–¥34,100, 1.5 to 2 times the August average of ¥17,100. Demand stayed thick right to the end of the 16-day Games.
| Stay date | Occupancy (estimated) | Remaining rooms | Listed price | Share of properties with zero rooms left |
|---|---|---|---|---|
| 10/1 (Thu) | 95.5% | 1,553 rooms | ¥30,154 | 56.1% (221 / 394 properties) |
| 10/2 (Fri) | 93.8% | 2,151 rooms | ¥25,720 | 51.5% (204 / 396 properties) |
| 10/3 (Sat) | 95.8% | 1,390 rooms | ¥34,068 | 61.3% (241 / 393 properties) |
| 10/4 (Sun, closing ceremony) | 84.4% | 5,221 rooms | ¥17,147 | 33.2% (131 / 395 properties) |
Source: Compiled by HotelBank Editorial Team from MetroEngines Research (occupancy, remaining rooms and listed prices: Aichi, 344–360 properties / 33,423–34,580 rooms. The right-hand column covers properties whose inventory could be observed on each date out of the fixed 401-property population described below. Based on major booking-site listings)
The level switched on closing night. Sunday, October 4 was at 84.4% as of the day before, remaining rooms rose back to 5,221, and the listed price fell to ¥17,100 — roughly half the previous night. With the August monthly average at 82.5% and ¥17,100, Aichi’s lodging market returned to normal levels on the night of the closing ceremony. For business hotels alone, October 4 was 84.2% and ¥12,200, again in line with the August average (82.5%, ¥12,500). The peak ended not with the closing ceremony itself but the night before.
Between the Games (October 5–17): Not a Trough but a Normal-Week Pattern, With the Second Half Entering the Foothills of the Second Peak
So are the two weeks after the closing a “post-event trough”? Compare them with a normal pre-Games week (weekdays of September 7–11) at the same days remaining. At 21 days out, the first between-Games week (weekdays of October 5–9) stood at 67.6% versus 65.6% for the normal week — a gap of just 2.0pt. The normal week then built 19.2pt to land at 84.8% the day before the stay, and the first between-Games week is on the same trajectory at 80.7% as of October 3 (2–6 days out). The between-Games window is better read not as a slump but as a straight return to the normal pre-Games pattern.
Individual dates confirm this. Shortly after the Games opened, our tracking put Tuesday, October 6 — two days after the closing ceremony — at around 68%. This tally also shows 68.7% as of September 20, but it built 12.6pt over the following two weeks to reach 81.3% as of October 3. Estimating demand from three-week-out figures alone tends to understate the room to capture weekday bookings that come in close to the date.
Source: Compiled by HotelBank Editorial Team from MetroEngines Research (Aichi; average of five weekdays; 344–369 properties / 33,428–34,672 rooms; based on major booking-site listings; as of October 3, 2026. Lead times not yet reached are left blank)
There is variation within the window, however. Over the three-day weekend, Saturday, October 10 was high at 89.0% (7 days out) and Sunday the 11th at 81.3% (8 days out), while the final day, Monday the 12th (Sports Day), was the window’s low point at 70.2% (9 days out). After the holiday the picture changes: 21-day-out occupancy steps up day by day — 72.4% on Tuesday, October 13, 75.1% on the 14th, 78.8% on the 15th, 81.9% on the 16th and 84.6% on Saturday the 17th. The average for these five days was 78.6%, 8.8pt above the first half (October 5–12) at 69.8%.
The rise in the second half coincides with Garden Pier starting Para Games operations on October 11. Inventory movements alone, however, cannot separate Games-related stays from ordinary business and leisure demand. What is clear is the shape: the second peak does not appear suddenly on the October 18 opening day but begins building four to five days earlier.
Para Games Week (October 18–24): A “Weekday-Type” Peak Where Weekdays Match Weekend Levels
Now to the second peak itself. Occupancy as of October 3 was 80.4% on Sunday, October 18, 82.0% on the 19th, 84.9% on the 20th, 84.5% on the 21st, 84.9% on the 22nd, 85.3% on the 23rd and 84.3% on Saturday the 24th. Apart from the opening-day Sunday, all six days sit in the 82–85% range, with almost no gap between weekdays and Saturday. Unlike a normal week, where the peak comes at the weekend, Tuesday through Friday are the highest.
Comparing the five weekdays (October 19–23) at 21 days out, Para Games week is at 82.2%, 16.6pt above the normal week’s 65.6%. That is 6.2pt short of the 88.4% of the Asian Games’ final week (September 28 – October 2), but still a substantial peak. Listed prices at the same cross-section are ¥24,000, 38.3% above the normal week’s ¥17,400. At 28 days out, where a comparison with the following week (October 26–30) is possible, Para Games week was 79.5% versus 66.0% for the following week, a 13.5pt gap.
| Hotel type (coverage) | Normal week 9/7–11 | Between-Games week 1 10/5–9 | Para Games week 10/19–23 | Change vs. normal week | Reference: Games’ final week 9/28–10/2 |
|---|---|---|---|---|---|
| Business hotels 166–176 properties / 25,358–26,210 rooms | 65.4% ¥12,379 | 66.8% ¥13,019 | 83.6% ¥20,230 | +18.2pt +63.4% | 90.0% ¥25,459 |
| City hotels 23 properties / 3,655–3,674 rooms | 67.0% ¥20,901 | 71.5% ¥26,378 | 83.4% ¥39,450 | +16.4pt +88.7% | 91.3% ¥53,363 |
| Ryokan 84–95 properties / 1,809–1,935 rooms | 62.5% ¥23,663 | 61.8% ¥23,646 | 64.4% ¥25,460 | +1.9pt +7.6% | 68.3% ¥26,203 |
Source: Compiled by HotelBank Editorial Team from MetroEngines Research (Aichi; based on major booking-site listings. Top line = occupancy (OTA-listed inventory basis, estimated); bottom line = listed price (two guests per room, tax included, average across all plans). As of October 3, 2026)
By hotel type, it is clear who is carrying the peak. Business hotels rose from 65.4% in the normal week to 83.6% in Para Games week (+18.2pt), and city hotels from 67.0% to 83.4% (+16.4pt) — both large gains. Listed-price gaps are even wider than occupancy, at +63.4% for business hotels and +88.7% for city hotels. Note that because cheaper plans sell out first as inventory shrinks, the average listed price overstates movements in actual room rates.
By contrast, ryokan moved only from 62.5% to 64.4% (+1.9pt), with listed prices up a modest +7.6%. Stays by teams and Games officials tend to concentrate in hotels close to venues and bases with large room counts. The Chita and Atsumi peninsulas, where ryokan are common, appear to be following their normal autumn pattern even in Para Games week.
Source: Compiled by HotelBank Editorial Team from MetroEngines Research (Aichi; five-weekday average at 21 days before the stay date; business 166–176 properties / city 23 properties / ryokan 84–95 properties; based on major booking-site listings)
Comparison With Four Neighboring Prefectures: Seasonality in the Gap vs. the Normal Week, but Aichi Stands Out Against the Following Week
To gauge how much of the Para Games week uplift is due to the event, we lined up neighboring Gifu, Mie, Shiga and Shizuoka for the same stay dates at the same cross-sections. Apart from para cycling (at the Izu Velodrome in Izu, Shizuoka, and elsewhere), all Asian Para Games venues are in Aichi. If Gifu, Mie and Shiga — which host no venues — saw the same rise in the same week, that would point to seasonal or day-of-week factors rather than the Games.
| Prefecture (coverage) | Normal week 9/7–11 21 days before | Para Games week 10/19–23 21 days before | Change vs. normal week | Para Games week 28 days before | Following week 10/26–30 28 days before | Change vs. following week |
|---|---|---|---|---|---|---|
| Aichi 344–369 properties / 33,428–34,614 rooms | 65.6% | 82.2% | +16.6pt | 79.5% | 66.0% | +13.5pt |
| Gifu 271–302 properties / 10,796–11,179 rooms | 66.4% | 81.3% | +14.9pt | 78.0% | 75.7% | +2.3pt |
| Mie 267–286 properties / 14,105–14,238 rooms | 65.9% | 77.4% | +11.5pt | 74.6% | 66.4% | +8.2pt |
| Shiga 142–164 properties / 6,859–7,220 rooms | 67.9% | 77.5% | +9.6pt | 74.0% | 74.0% | ±0.0pt |
| Shizuoka 863–901 properties / 32,105–32,442 rooms | 64.0% | 67.4% | +3.4pt | 64.7% | 62.0% | +2.7pt |
Source: Compiled by HotelBank Editorial Team from MetroEngines Research (each prefecture; simple average of daily values over five weekdays; properties listing 30% or more of total rooms on OTAs and similar channels; based on major booking-site listings; as of October 3, 2026. The following week is compared at 28 days out because the 21-day cross-section has not yet been reached)
Against the normal week (September 7–11), Aichi is up +16.6pt, but neighboring prefectures also rose by around 10pt: Gifu +14.9pt, Mie +11.5pt and Shiga +9.6pt. Weekday occupancy in the Chubu and Kinki regions rises from early September to late October even without an event, so the gap versus the normal week likely includes seasonality. Shizuoka rose only +3.4pt, showing that the seasonal lift differs by region (Shizuoka hosts the cycling venue, but no difference large enough to move prefecture-wide occupancy is visible).
The comparison that best controls for seasonality is with the immediately following week (October 26–30). Comparing Para Games week with the following week at 28 days out, Aichi retains a large gap of +13.5pt, while Gifu is only +2.3pt, Shiga ±0.0pt and Shizuoka +2.7pt. Aichi’s strength this week is driven largely by factors specific to Aichi rather than an autumn wave shared with its neighbors. Mie, at +8.2pt, shows the largest gap among the neighbors; for business hotels alone it is +11.5pt (Para Games week 75.6%, following week 64.1%). Northern Mie cities such as Kuwana and Yokkaichi lie within the Nagoya area’s commuting and business sphere and may be absorbing overflow in weeks when Aichi inventory runs thin, but inventory movements alone cannot pin down the cause.
Comparing the first between-Games week (October 5–9) with the normal week in the same way, Aichi was +2.0pt, versus Gifu +8.8pt, Shiga +1.9pt, Shizuoka +0.4pt and Mie −0.6pt. Aichi’s between-Games return to “normal-week levels” mirrors most of its neighbors and cannot be read as a post-event slump.
Property-Level Inventory Interim Results (as of October 4): Remaining-Room Rates Around 10% in Venue-Hosting Nishi-Mikawa
Next, we drop down to the city/ward level. Property-level inventory covers only properties that list at least 30% of their total rooms on OTAs and similar channels. For properties with smaller public allocations, several explanations are possible — their sales center on other channels such as official websites and travel agencies, they add inventory as the stay date nears, or they set small OTA allocations to begin with — so few remaining rooms do not necessarily signal strong demand. The population was fixed at the 401 properties / 34,380 rooms whose public allocation was 30% or more on any normal pre-Games day (September 8–11), so that coverage does not shift by date.
The following are interim results as of October 4, not final figures. OTA inventory can be added or resold by properties, and the remaining rooms here are counts within OTA public allocations, not vacancies for the whole property.
| City / ward | Properties / rooms | Games’ final days 10/1–3 day before | Between-Games week 1 10/5–9 1–5 days before | Para Games week 10/18–24 14–20 days before | Following week 10/25–31 21–27 days before |
|---|---|---|---|---|---|
| Aichi total | 401 / 34,380 rooms | 4.9% | 19.2% | 15.6% | 29.7% |
| Nagoya City | 130 / 18,915 rooms | 4.1% | 16.2% | 12.5% | 27.6% |
| of which Naka Ward | 61 / 10,843 rooms | 3.9% | 15.2% | 11.9% | 26.9% |
| of which Nakamura Ward | 47 / 6,158 rooms | 4.2% | 16.9% | 14.6% | 29.1% |
| Anjo | 12 / 1,287 rooms | 3.9% | 18.4% | 7.4% | 28.2% |
| Okazaki | 9 / 729 rooms | 5.2% | 11.6% | 8.6% | 26.8% |
| Toyota | 16 / 1,189 rooms | 3.4% | 11.8% | 10.3% | 28.3% |
| Gamagori | 17 / 932 rooms | 7.5% | 19.7% | 11.2% | 14.8% |
| Ichinomiya | 9 / 546 rooms | 12.1% | 19.3% | 13.1% | 28.0% |
| Toyohashi | 12 / 1,405 rooms | 2.0% | 19.6% | 20.1% | 33.5% |
| Shinshiro | 13 / 339 rooms | 10.4% | 14.7% | 24.2% | 32.2% |
| Inuyama | 10 / 505 rooms | 6.8% | 18.1% | 25.5% | 33.1% |
| Mihama | 10 / 137 rooms | 13.8% | 28.9% | 28.4% | 34.3% |
| Tokoname | 8 / 2,996 rooms | 0.9% | 35.2% | 30.3% | 38.4% |
| Tahara | 18 / 589 rooms | 20.6% | 34.6% | 31.8% | 37.2% |
| Nishio | 11 / 212 rooms | 14.0% | 28.6% | 32.7% | 33.5% |
| Minamichita | 77 / 879 rooms | 18.1% | 34.4% | 37.3% | 41.9% |
Source: Compiled by HotelBank Editorial Team from MetroEngines Research (Aichi; fixed population of 401 properties / 34,380 rooms whose OTA public allocation was 30% or more of total rooms, tallied over the 393–398 properties whose inventory could be observed on each date. Cities and towns with fewer than 7 properties are included only in the prefecture total. Based on major booking-site listings, as of October 4, 2026; the Games’ final days are as of the day before each stay date)
Read across the table with care, because days remaining to the stay date differ by column. With that caveat, what stands out is that in many cities the remaining-room rate for Para Games week — with 14–20 days still to go — is lower than for the first between-Games week, which is right on top of the stay date: 15.6% vs. 19.2% for the prefecture, 12.5% vs. 16.2% for Nagoya, and 7.4% vs. 18.4% in Anjo. The share of properties with zero rooms left is 22.3% for Para Games week, level with the between-Games window (22.7% average for October 5–17) and 10pt above the following week’s 12.3%.
By area, Nishi-Mikawa is notably tight. Anjo (7.4%), Okazaki (8.6%) and Toyota (10.3%) are all below Nagoya’s 12.5%. Okazaki and Toyota host venues, and Anjo sits between Okazaki and Kariya, the wheelchair rugby venue. The area also has thick weekday business demand to begin with, so the Games cannot be credited with all of it, but given that the same three cities are at 26.8–28.3% for the following week, there appears to be an uplift specific to this week.
Conversely, the greatest capacity to absorb overflow lies in the leisure destinations of Chita and Atsumi. Minamichita (37.3%), Nishio (32.7%), Tahara (31.8%) and Tokoname (30.3%) still had more than 30% of inventory left even in Para Games week. Mihama, also on the Chita Peninsula, is close to 30% at 28.4%. Tokoname has swung from 0.9% in the Games’ final days, as large properties around the airport regained spare capacity.
Source: Compiled by HotelBank Editorial Team from MetroEngines Research (Aichi; cities/wards with 7 or more properties out of the fixed 401-property population with OTA public allocation of 30% or more; based on major booking-site listings; as of October 4, 2026. Para Games week is 14–20 days before the stay date; between-Games week 1 is 1–5 days before)
Estimated Settled ADR by Municipality: The Second Peak Sits on the ¥6,000–¥10,000 Tier
To confirm which price tier the occupancy peak sits on, we look at estimated settled ADR by municipality. Because estimated settled ADR is finalized only after a month closes, this section shows August 2026, the latest closed month, alongside the previous autumn (October and November 2025). September onward, including the Games month, is not yet final and is not covered here; price movements are shown through listed prices in the preceding sections.
| Municipality | Properties covered (August 2026) | August 2026 | YoY | Reference: October 2025 | Reference: November 2025 |
|---|---|---|---|---|---|
| Aichi | N=505 | ¥8,555 | −5.5% | ¥8,738 | ¥9,764 |
| Gamagori | N=22 | ¥17,814 | −7.7% | ¥14,890 | ¥16,959 |
| Minamichita | N=56 | ¥16,495 | −7.6% | ¥15,180 | ¥19,399 |
| Nagoya, Nakamura Ward | N=71 | ¥9,566 | +0.6% | ¥10,117 | ¥11,994 |
| Nagoya, Naka Ward | N=88 | ¥8,810 | −11.0% | ¥9,320 | ¥11,016 |
| Inuyama | N=11 | ¥8,905 | −10.3% | ¥8,789 | ¥10,171 |
| Toyohashi | N=19 | ¥8,130 | −0.1% | ¥7,078 | ¥7,710 |
| Tokoname | N=13 | ¥7,991 | −5.8% | ¥10,142 | ¥9,084 |
| Toyota | N=29 | ¥7,561 | −2.1% | ¥7,685 | ¥8,713 |
| Okazaki | N=12 | ¥6,857 | +1.7% | ¥6,691 | ¥7,418 |
| Anjo | N=13 | ¥6,758 | −19.7% | ¥6,471 | ¥7,979 |
| Kariya | N=8 | ¥6,365 | +3.2% | ¥6,192 | ¥6,216 |
| Ichinomiya | N=12 | ¥6,230 | +9.5% | ¥6,245 | ¥6,680 |
Source: Compiled by HotelBank Editorial Team from MetroEngines Research (estimated settled ADR, tax-excluded equivalent, median of properties covered. N = number of properties covered in each municipality in August 2026. Nagoya is tallied by ward)
On closed-month data, Aichi’s pricing splits into three tiers. At the top are the leisure destinations of Gamagori (¥17,800) and Minamichita (¥16,500); next comes central Nagoya, with Nakamura Ward at ¥9,600 and Naka Ward at ¥8,800; below that sit business cities such as Toyohashi (¥8,100), Toyota (¥7,600), Okazaki (¥6,900), Anjo (¥6,800), Kariya (¥6,400) and Ichinomiya (¥6,200). The prefecture as a whole was ¥8,600, down 5.5% YoY. A reference figure for Nagoya City as a whole, weighting ward values by number of properties covered, is ¥9,100 (12 wards, N=190, down 6.9% YoY). Last autumn, the prefecture-wide figure rose from ¥8,700 in October to ¥9,800 in November, and central Nagoya was also higher in November.
Overlaying the earlier findings shows that the Para Games week uplift sits on central Nagoya and the business cities of Nishi-Mikawa — the tier whose normal ADR is ¥6,000–¥10,000. The leisure tier is moving in its normal pattern, with remaining-room rates in the 30% range. The lower a business city’s room rate, the larger the event-week upside for each room in relative terms. Final ADR for Para Games week will need to be checked once the month closes, but inventory movements already show which tier the peak has landed on.
Capturing the Second Peak: Three Perspectives for Operators and Investors
To sum up, October in Aichi is not “a month that sinks after the Asian Games” but a month in which a weekday-type peak returns after a normal-week interlude. Taking that shape as given, here are three perspectives on the opportunity for lodging operators.
First, read the between-Games window against the normal-week yardstick. The normal week built 19.2pt from 21 days out to the day before, and the first between-Games week is on the same trajectory. Occupancy in the 60% range three weeks out is simply a normal interim reading. Rather than cutting prices early to fill rooms, keeping inventory and rate steps in reserve for weekday demand that arrives in the final two weeks may capture more revenue opportunity. The window’s low points — Monday, October 12 (holiday) and Sunday nights — offer the most room to combine extended stays or Sunday-departure plans.
Second, design Para Games week as a peak of “weekdays, business and city hotels, and venue-hosting cities.” The port base operates October 11–26, longer than the competition itself, and allocating accommodation by sport lends itself to multi-night stays. Given that Tuesday through Friday are the highest, consider revisiting weekday minimum-stay requirements and multi-night plans. In Nishi-Mikawa, remaining-room rates have already fallen to around 10% with two to three weeks to go, so deciding the sales sequence for remaining inventory early is effective. The master plan expects 880–950 athletes and team officials with mobility restrictions or who use wheelchairs daily, so making accessible rooms and step-free routes easy to find on booking pages is also an opportunity unique to this week.
Third, consider how properties outside the peak should move. Ryokan and the leisure destinations of Chita and Atsumi are following their normal autumn pattern even in Para Games week, with remaining-room rates in the 30% range. In weeks when inventory runs thin in Nagoya and Nishi-Mikawa, they have room to promote themselves as weekend options for visitors coming to watch or support athletes. For investment and development teams, the quick return of the between-Games window to normal-week levels is itself useful evidence. Rather than stretching the Games month’s high figures into a full-year assumption, setting the normal-week pattern — 65.6% at 21 days out and 84.8% the day before — as the baseline makes it easier to isolate the event uplift. Note, however, that the gap between the early-September normal week and late October includes seasonality also seen in neighboring prefectures. Looking at the gaps versus the following week and versus neighboring prefectures together narrows down the uplift further.
Note on figures for future dates: Occupancy, remaining rooms and listed prices for October 5 onward are interim readings based on the inventory and selling prices listed on OTAs and similar channels at the time of observation (area aggregates as of October 3, 2026; property-level inventory as of October 4), and will change as stay dates approach. Inventory may be added or resold by properties, and listed prices may move up or down with last-minute adjustments.
Frequently Asked Questions
Q. Where is the Asian Para Games athletes’ village?
A. No athletes’ village has been built. The organizing committee’s policy is to use existing lodging, and according to City of Nagoya documents, teams are housed in mobile accommodation at Garden Pier in the Port of Nagoya (about 800 people for the Asian Para Games, operating October 11–26) and in existing hotels and other lodging across Aichi. The cruise ship at Kinjo Pier used for the Asian Games is not used for the Asian Para Games.
Q. Now that the Asian Games are over, are Aichi hotels easier to book?
A. Observations as of October 3 show weekday occupancy (OTA-listed inventory basis, estimated) for October 5–9 averaging 80.7%, back to the same level as a normal pre-Games week. However, Saturday, October 10, the first day of the three-day weekend, was at 89.0%, and Para Games week (October 18–24) was already at 83.8% with 15–21 days to go, so conditions vary by date.
Q. During the Asian Para Games, which areas of Aichi have relatively more rooms left?
A. Observations as of October 4 show remaining-room rates, for properties listing 30% or more of total rooms on OTAs and similar channels, of 37.3% in Minamichita, 32.7% in Nishio, 31.8% in Tahara and 30.3% in Tokoname. Nishi-Mikawa is tighter, with Anjo at 7.4%, Okazaki at 8.6% and Toyota at 10.3%. Inventory changes daily, so check each booking site for the latest availability.
Q. Is all of the Para Games week occupancy uplift due to the event?
A. Part of it is seasonal. Compared with a normal week in early September, the rise in Para Games week weekday occupancy (at 21 days before the stay date) was +16.6pt in Aichi, but Gifu, which hosts no venues, also rose +14.9pt and Mie +11.5pt. Against the following week (October 26–30), which better controls for seasonality, the gap at 28 days out was +13.5pt for Aichi versus +2.3pt for Gifu, ±0.0pt for Shiga and +2.7pt for Shizuoka, indicating a large Aichi-specific uplift.
Methodology and Sources
Occupancy (OTA-listed inventory basis, estimated) and listed prices come from MetroEngines Research’s daily observation of OTA-listed inventory and selling prices for lodging in Aichi, tallied for properties that list 30% or more of their total rooms on OTAs and similar channels. The same set of properties is tracked for each stay date; coverage is 344–369 properties / 33,294–34,672 rooms depending on the stay date (based on major booking-site listings). Observations are limited to 45 days or less before the stay date, and window and weekly values are simple averages of daily values. The “normal week” refers to the pre-Games weekdays of September 7–11, 2026, and the “Games’ final week” to the weekdays of September 28 – October 2.
Property-level inventory uses a fixed population of the 401 properties / 34,380 rooms whose public allocation on OTAs and similar channels was 30% or more of total rooms on any normal pre-Games day (September 8–11), summing remaining rooms over the 393–398 properties whose inventory could be observed on each stay date. October 1–4 are as of the day before each stay date; October 5 onward are observations as of October 4, 2026 (October 3 for some properties). Estimated settled ADR uses only closed months (August 2026 and August, October and November 2025). The four neighboring prefectures (Gifu, Mie, Shiga, Shizuoka) were tallied at prefecture level using the same method and observation date as Aichi (as of October 3, 2026). Games accommodation arrangements are based on documents published by the organizing committee, the City of Nagoya and the Japanese Para Sports Association.
Related Articles
- Asian Para Games 2026: Aichi Weekdays Run 12pt Above the Next Week
- Asian Games 2026: 1,500 Ship Rooms vs Nagoya’s 28,986-Room Stock
- Asian Games 2026: Toyohashi +18.7pt, Kuwana +14.4pt Beyond Nagoya
References and Sources
■ Data sources
MetroEngines Research’s daily observation of OTA-listed inventory and listed prices (Aichi and four neighboring prefectures, 45 days or less before the stay date, as of October 3 and 4, 2026), and estimated settled ADR (closed months: August, October and November 2025; August 2026). Games accommodation arrangements from documents published by the organizing committee, the City of Nagoya and the Japanese Para Sports Association.
■ Assumptions
Occupancy is an estimate on an OTA-listed inventory basis for properties listing 30% or more of total rooms on OTAs and similar channels; window and weekly values are simple averages of daily values. Property-level inventory uses a fixed population of 401 properties / 34,380 rooms whose public allocation was 30% or more on normal pre-Games days (September 8–11). Estimated settled ADR is the median of properties covered in each municipality (tax-excluded equivalent).
■ Limitations
Values for October 5 onward are interim readings at the time of observation and will change with added or resold inventory and last-minute price adjustments. Occupancy is not a property’s actual overall occupancy. Inventory movements cannot separate Games-related stays from ordinary business and leisure demand, and gaps versus the normal week include seasonality (see the comparison with four neighboring prefectures). Because cheaper plans sell first, average listed prices overstate movements in actual room rates.
■ References
- MetroEngines Research — daily observation of OTA-listed inventory and listed prices for lodging in Aichi (as of October 3 and 4, 2026); estimated settled ADR (closed months)
- Aichi-Nagoya Asian Games Organising Committee, “Use of cruise ships as team accommodation for the 20th Asian Games (2026 Aichi-Nagoya)” (May 8, 2024; Japanese)
- City of Nagoya, materials for the “31st Nagoya City Asian Games and Asian Para Games Promotion Headquarters Meeting” (August 28, 2026; Japanese)
- 5th Asian Para Games (2026 Aichi-Nagoya) Games Master Plan (Japanese)
- Japanese Para Sports Association / Japanese Paralympic Committee, “Aichi-Nagoya 2026 Asian Para Games: Overview” (Japanese)
- 20th Asian Games (2026 Aichi-Nagoya) official website
- Nikkei, “Asian Games accommodation cruise ship unveiled: no athletes’ village, 4,000 housed at Port of Nagoya” (Japanese)
- Japan Tourism Agency, “Overnight Travel Statistics Survey” (official statistics on actual occupancy; defined differently from the estimates in this article)