

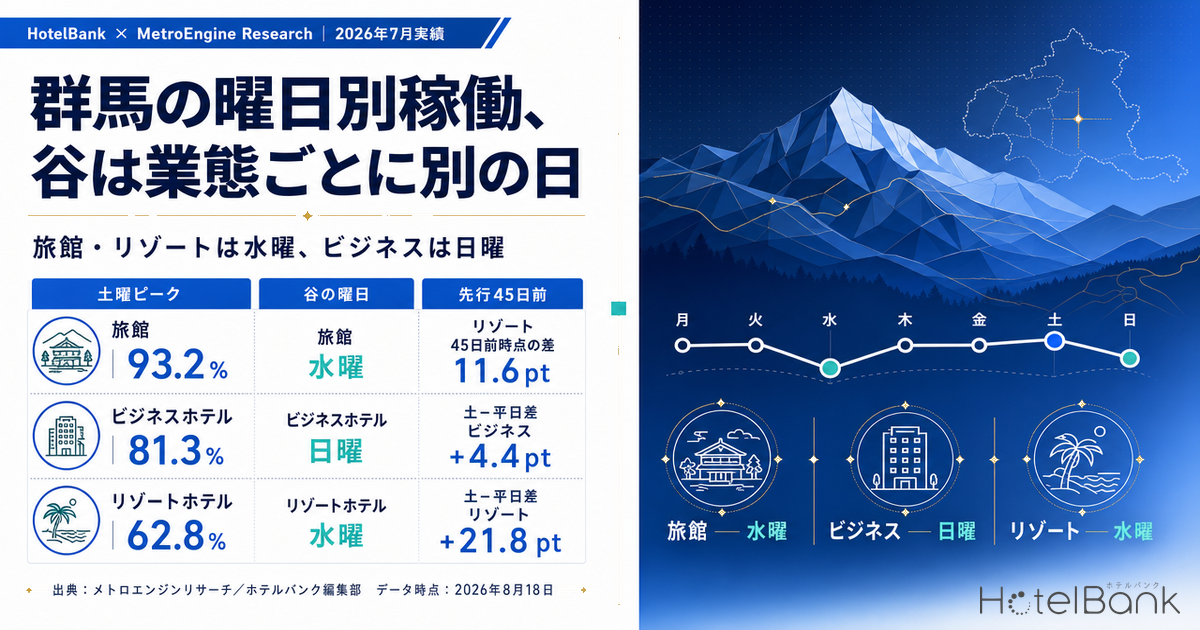
Break Gunma’s July 2026 results (month-to-date actuals) down by day of week and by property type, and a shape emerges that “weekends are strong” fails to explain. Saturday’s estimated OCC is high across all three types — ryokan 93.2%, business hotels 91.3%, resort hotels 86.3%. But the gap against the weekday (Mon–Thu) average is +13.9pt for ryokan and +21.8pt for resort hotels, while business hotels manage only +4.4pt. The trough falls on a different day, too. Ryokan bottom out on Wednesday at 78.9% and resort hotels on Wednesday at 62.8%, whereas the business-hotel low is Sunday at 81.3% — for them Wednesday, at 87.9%, ranks near the top of the month. The maximum day-of-week spread is 14.3pt for ryokan, 10.0pt for business hotels and 23.5pt for resort hotels. Within a single prefecture, the thickness of the weekend premium and the location of the trough are different things entirely, depending on property type.
Scope: three property types in Gunma — ryokan, business hotels and resort hotels. Daily observations for July 2026, N=171–257 ryokan / 80–91 business hotels / 29–33 resort hotels. The price metric in this article is the settled ADR estimate (the transacted price level inferred from OTA and other sales data, tax-exclusive equivalent); occupancy is an estimate based on OTA-listed inventory. Both definitions appear at the end of the article. Data as of August 18, 2026.
- — The Saturday-vs-weekday (Mon–Thu) gap varies almost fivefold by property type — resort hotels +21.8pt, ryokan +13.9pt, business hotels +4.4pt (July 2026, Gunma).
- — The trough day differs by property type — ryokan 78.9% and resort hotels 62.8% are lowest on Wednesday, while business hotels bottom out on Sunday at 81.3% and their Wednesday 87.9% ranks near the top of the month.
- — The sold-out property rate points the same way — ryokan 43.2% on Wednesday (62.6% on Saturday), business hotels 21.4% on Sunday (42.5% on Saturday): on the trough day, the share of properties selling out roughly halves.
- — “Sunday” splits into two populations — July 19, the middle day of a three-day weekend, hit 91.5% for business hotels, while an ordinary Sunday, July 5, came in at 72.7%. The 81.3% average is merely the midpoint of the two.
- — The day-of-week gap is settled 45 days out — the Saturday-minus-Wednesday spread moved from 11.6 to 12.0pt for resorts, 6.1 to 7.1pt for ryokan and 6.6 to 7.0pt for business hotels: essentially flat across the observation window.
The day-of-week trough sits on a different day for each property type
We first grouped the 31 days of July 2026 by day of week and took, for each property type, the average estimated OCC (based on OTA-listed inventory). The design excludes any day with observation coverage below 50%, but in Gunma all 31 days cleared that bar for all three types, so no days were dropped. Minimum actual coverage was 54.1% for ryokan, 83.1% for business hotels and 80.6% for resort hotels.
Source: MetroEngines Research; compiled by the HotelBank Editorial Team
The shapes separate clearly. Ryokan and resort hotels sit on a nearly flat low plateau from Monday through Thursday (ryokan 78.9–79.6%, resort hotels 62.8–66.2%), lift from Friday and spike on Saturday — the classic leisure profile. Business hotels, by contrast, hold a high plateau of 87.8–88.7% on Tuesday, Wednesday and Thursday, step down to 84.2% on Friday and bottom out at 81.3% on Sunday. For a business hotel, the “weekend” is Saturday alone; Friday and Sunday behave as days weaker than a weekday. This splitting of day-of-week shape by property type within one prefecture is not unique to Gunma — Kumamoto’s day-of-week occupancy inverts by property type covers the same divergence.
| Day | Ryokan est. OCC | Business est. OCC | Resort est. OCC | Days aggregated |
|---|---|---|---|---|
| Mon | 79.6% | 82.3% | 64.7% | 4 |
| Tue | 79.1% | 87.8% | 64.2% | 4 |
| Wed | 78.9% | 87.9% | 62.8% | 5 |
| Thu | 79.4% | 88.7% | 66.2% | 5 |
| Fri | 83.0% | 84.2% | 73.2% | 5 |
| Sat | 93.2% | 91.3% | 86.3% | 4 |
| Sun | 86.7% | 81.3% | 74.9% | 4 |
| Monthly average | 82.6% | 86.3% | 70.0% | 31 |
| Max − min | 14.3pt | 10.0pt | 23.5pt | — |
| Sat − weekday (Mon–Thu) | +13.9pt | +4.4pt | +21.8pt | — |
July 2026, Gunma. Daily estimated OCC (based on OTA-listed inventory), simple average by day of week. Source: MetroEngines Research; compiled by the HotelBank Editorial Team
To go a level deeper, we took the share of properties whose listed inventory can no longer be found (the estimated sold-out property rate) from the same daily data, again by day of week. Ryokan run 62.6% on Saturday against 43.2% on Wednesday; resort hotels 36.4% on Saturday against 14.6% on Wednesday. Business hotels run 42.5% on Saturday against 21.4% on Sunday — confirming from the other side that their trough day is Sunday. It is not only the level of occupancy but the distribution of “what share of properties have sold out” that thins on a different day for each property type. The tendency for the business-hotel trough to sit on the Sunday side is not confined to Gunma; the same configuration shows up in other prefectures.
Look at it daily and “Sunday” splits in two
Day-of-week averages are convenient, but in Gunma in July 2026 the single word “Sunday” contains two kinds of day with different characters. Trace the daily series and the split is unmistakable.
Source: MetroEngines Research; compiled by the HotelBank Editorial Team
The monthly peak stands over the three-day weekend from Saturday July 18 to Monday July 20 (Marine Day), for all three property types at once. On the 18th, ryokan reached 98.0%, business hotels 96.7% and resort hotels 95.3%. The 19th (Sunday) stayed high as well — ryokan 96.7%, business hotels 91.5%, resort hotels 88.7% — before falling on the 20th (Monday, the holiday) to ryokan 80.3%, business hotels 75.8% and resort hotels 64.2%. The trough of the long weekend arrives not on the Sunday but on the closing holiday.
Ordinary Sundays not attached to a long weekend look different. For business hotels, July 5 was 72.7% and July 12 was 73.7% — lows that rank near the bottom of the month. The same weekday, then, sits some 18 points below the 91.5% recorded on the 19th. The business-hotel Sunday average of 81.3% is the flattened result of these two poles; it does not mean “Sundays run around 81%.” Ordinary Sundays for ryokan and resort hotels (the 5th: ryokan 80.0%, resort hotels 62.1%; the 12th: ryokan 82.9%, resort hotels 70.9%) also sit clearly below the Sunday inside the long weekend.
| Date | Category | Ryokan | Business | Resort |
|---|---|---|---|---|
| Jul 17 | Fri (day before the long weekend) | 82.0% | 82.9% | 77.0% |
| Jul 18 | Sat (day 1 of the long weekend) | 98.0% | 96.7% | 95.3% |
| Jul 19 | Sun (middle day) | 96.7% | 91.5% | 88.7% |
| Jul 20 | Mon, public holiday (final day) | 80.3% | 75.8% | 64.2% |
| Jul 5 | Sun (ordinary) | 80.0% | 72.7% | 62.1% |
| Jul 12 | Sun (ordinary) | 82.9% | 73.7% | 70.9% |
| Jul 26 | Sun (ordinary) | 87.1% | 87.2% | 77.7% |
July 2026, Gunma; estimated OCC (based on OTA-listed inventory). Source: MetroEngines Research; compiled by the HotelBank Editorial Team
The lowest day of the month also differed by property type. Ryokan bottomed on Thursday July 2 at 75.2%, business hotels on Sunday July 5 at 72.7% and resort hotels on Wednesday July 1 at 55.6%. Two floors of quite different character — an early-month weekday and an ordinary Sunday — occur simultaneously within the same prefecture.
The day-of-week gap is already open 45 days out
Is the day-of-week gap seen in the July results created by a last-minute rush, or is it set early? To find out, we took the three most recent Wednesdays (August 19, August 26, September 2) and Saturdays (August 22, August 29, September 5), averaged the booking curves by property type from 45 days before the stay date up to the present, and tracked how the Saturday-minus-Wednesday gap moved.
Source: MetroEngines Research; compiled by the HotelBank Editorial Team
The conclusion is plain: the gap runs essentially flat. Resort hotels were already 11.6pt apart at 45 days out and stand at 12.0pt most recently (19 days out). Ryokan went from 6.1pt to 7.1pt and business hotels from 6.6pt to 7.0pt — none of them narrowing or widening much across the observation window. The configuration in which Saturday outperforms Wednesday exists in essentially finished form as early as 45 days before the stay date.
| Property type | Day | 45 days out | 30 days out | 20 days out |
|---|---|---|---|---|
| Ryokan | Sat | 70.8% | 74.0% | 77.3% |
| Sun | 65.3% | 68.5% | 71.6% | |
| Wed | 64.7% | 68.2% | 70.5% | |
| Business | Sat | 75.0% | 78.8% | 81.6% |
| Wed | 68.4% | 71.5% | 74.7% | |
| Sun | 67.2% | 69.1% | 70.4% | |
| Resort | Sat | 62.2% | 69.8% | 73.3% |
| Sun | 58.8% | 66.1% | 67.8% | |
| Wed | 50.6% | 57.6% | 61.7% |
Target stay dates: Wednesdays = Aug 19, Aug 26, Sep 2; Saturdays = Aug 22, Aug 29, Sep 5; Sundays = Aug 23, Aug 30, Sep 6. Estimated OCC for the three dates per day of week, averaged by days remaining. Source: MetroEngines Research; compiled by the HotelBank Editorial Team
In this forward window, business-hotel Sunday sat at 70.4% at 20 days out, 4.3pt below Wednesday’s 74.7%. The shape visible in the July results — that the business-hotel trough is Sunday — points the same way in current sales conditions. For resort hotels, Wednesday at 45 days out was 50.6%, the lowest of the nine type-and-day combinations, and although it builds 11.1pt to reach 61.7% at 20 days out, it still fails to catch Saturday’s starting point of 62.2% at 45 days out. Structurally, Wednesday’s finish line does not clear Saturday’s starting line.
Keep the price yardstick monthly
We have been looking day by day, but the price metric is canonical at monthly granularity and is not handled at daily or day-of-week level. For reference, Gunma’s settled ADR estimate for July 2026 (confirmed values) by property type: ryokan roughly ¥14,100 (N=288 properties), resort hotels roughly ¥14,200 (N=35), business hotels roughly ¥6,500 (N=100). Against the same month a year earlier (also confirmed values), ryokan were −3.9%, resort hotels +1.5% and business hotels +2.0%. The pattern of signs diverging by property type was the same in June, and the breakdown is analysed in detail in Gunma’s settled ADR estimate for June 2026, where the signs split by property type.
| Property type | July 2025 (confirmed) | July 2026 (confirmed) | YoY | N= (July 2026) |
|---|---|---|---|---|
| Ryokan | ¥14,626 | ¥14,060 | −3.9% | 288 properties |
| Resort hotels | ¥14,018 | ¥14,233 | +1.5% | 35 properties |
| Business hotels | ¥6,337 | ¥6,464 | +2.0% | 100 properties |
Gunma; settled ADR estimate (tax-exclusive equivalent). Comparison of confirmed values for past months. Source: MetroEngines Research; compiled by the HotelBank Editorial Team
For revenue managers running ryokan, business hotels and resort hotels in Gunma — implications and an action plan
1. Do not carry one “weekend premium” coefficient across property types. In July, the Saturday-versus-weekday (Mon–Thu) gap was +21.8pt for resort hotels, +13.9pt for ryokan and +4.4pt for business hotels — a near fivefold spread within one prefecture. If your own day-of-week coefficients come from the prevailing sense of a neighbouring property of a different type, or from a company-wide template, it is worth first checking them against the shape of your own segment. Business hotels in particular run weekdays (Tue–Thu 87.8–88.7%) close to Saturday’s 91.3%, so the very design of “leaning into the weekend” may be out of step with the shape of the market.
2. Mistake the trough day and the countermeasure misses. The trough for ryokan and resort hotels is Wednesday (78.9% / 62.8%); for business hotels it is Sunday (81.3%). The sold-out property rate points the same way — ryokan 43.2% on Wednesday against 62.6% on Saturday, business hotels 21.4% on Sunday against 42.5% on Saturday — so on the trough day the share of properties selling out falls by roughly half. Rather than aiming promotions and inventory loosening at “weekdays” as a block, there is room to concentrate resources on the single trough day of your own segment.
3. Do not treat Sunday as one day. In Gunma in July, July 19 in the middle of a three-day weekend (business hotels 91.5%) was blended into the same “Sunday” average as ordinary Sundays July 5 (72.7%) and July 12 (73.7%). Because the character of this day flips with the placement of public holidays in the calendar, splitting the design on the axis of “inside a long weekend or not” — rather than on a day-of-week coefficient — gets closer to actual conditions. It is worth noting alongside this that July 20, the day after the holiday, fell for all three property types (ryokan 80.3%, business hotels 75.8%, resort hotels 64.2%).
4. The day-of-week gap is settled 45 days out. The Saturday-minus-Wednesday gap ran from 11.6pt at 45 days out to 12.0pt at 20 days out for resort hotels, 6.1pt to 7.1pt for ryokan and 6.6pt to 7.0pt for business hotels — near-constant across the observation window. Rather than filling the trough with last-minute value pricing, placing the question of how to create demand on the trough day at the 45-day mark fits the shape of the market better.
| Horizon | Move | Decision trigger (figures from this article) | Aim |
|---|---|---|---|
| Today to this week | Lay out your own day-of-week occupancy for just the past month and check whether the trough is Wednesday or Sunday | If your trough day diverges from the market shape for your segment (Wednesday for ryokan and resorts, Sunday for business hotels) | Establish first whether the premise behind your coefficients matches the market |
| Today to this week | Tag Sundays inside long weekends separately from ordinary Sundays on the next two months of the calendar | If your own property shows a spread on the same weekday comparable to 91.5% on Jul 19 versus 72.7% on Jul 5 | Break the two poles hidden inside a day-of-week average into separate setting units |
| Within two weeks | Review consecutive-night conditions and minimum-stay restrictions on the trough day, and check whether Saturday-anchored multi-night stays are picking it up | If your property reproduces the ryokan and resort spread of 93.2% / 86.3% on Saturday against 78.9% / 62.8% on Wednesday | Build a path that extends demand from the strong day into the trough day |
| Within two weeks | For business hotels, revisit inventory allocation on Friday and Sunday (in July, Friday 84.2% and Sunday 81.3% both fell below the 86.9% weekday average) | If your Fridays and Sundays have run below Tuesday–Thursday for several weeks running | Look for room to correct an allocation premised on strong weekends |
| Looking to next month | Bring promotional and channel-exposure preparation for the trough day forward to 45 days before the stay date | Once you can confirm on your own curves that the Saturday-minus-Wednesday gap is already open at 45 days out (resorts 11.6pt, ryokan 6.1pt, business 6.6pt) | Act before the trough forms rather than relying on last-minute response |
| Looking to next month | Revisit the monthly pricing-revision calendar using the monthly average settled ADR estimate as the yardstick | If your current-month settings sit far from the market settled ADR estimate (ryokan approx. ¥14,100, resorts approx. ¥14,200, business approx. ¥6,500) | Keep the day-of-week discussion and the price discussion at their correct granularities |
Source: MetroEngines Research; compiled by the HotelBank Editorial Team
Summary — three yardsticks to take away
Yardstick 1: the thickness of the weekend premium is set by property type. In Gunma in July 2026, the Saturday-versus-weekday (Mon–Thu) gap was +21.8pt for resort hotels, +13.9pt for ryokan and +4.4pt for business hotels. The maximum day-of-week spread differs widely too — 23.5pt for resort hotels, 14.3pt for ryokan, 10.0pt for business hotels. Before applying a common coefficient, check the amplitude of your own segment.
Yardstick 2: the trough concentrates on a single day. Wednesday for ryokan at 78.9% and resort hotels at 62.8%; Sunday for business hotels at 81.3%. The sold-out property rate thins on the same days. Whether you can narrow the target of your countermeasures from “weekdays” to one specific day determines the density of the move.
Yardstick 3: the day-of-week gap exists from 45 days out. The Saturday-minus-Wednesday gap barely moved for any of the three property types between 45 days out and the present. Working on the trough day fits the shape of the market better when it is set up on the early side of the lead time.
About the data in this article
- Definition of estimated OCC: occupancy based on OTA-listed inventory = 100 − 100 × rooms still listed on OTAs ÷ total rooms. It is an estimate based on how listed inventory is being absorbed on OTAs, and its definition differs from actual room occupancy (it runs higher). This article labels it “estimated OCC (based on OTA-listed inventory).” The target month is July 2026 (month-to-date actuals); the target stay dates for the forward window are August 19 to September 6, 2026.
- Booking curve: based on observations from 45 days before the stay date up to the present.
- Definition of the settled ADR estimate: the transacted price level (tax-exclusive equivalent) inferred from OTA and other sales data (cheapest-plan level × property-type coefficient, an ensemble across multiple channels). Past months are confirmed values; the current and future months are estimates based on sales conditions at the time. Median error against published operating results is 6.6%. Both July 2025 and July 2026 as used in this article are confirmed values, and the comparison is made between confirmed values. The price metric is canonical at monthly granularity and is not handled at day-of-week or daily granularity.
- Breakdown of N: daily observed property counts for July 2026 were 171–257 ryokan (monthly average 221 properties, average of roughly 6,010 listed rooms), 80–91 business hotels (monthly average 88 properties, roughly 7,895 rooms) and 29–33 resort hotels (monthly average 31 properties, roughly 2,761 rooms). The design excludes days with observation coverage below 50%, but all 31 days cleared the bar for all three property types, so no days were excluded (minimum coverage was 54.1% for ryokan, 83.1% for business hotels and 80.6% for resort hotels). N for the settled ADR estimate as of July 2026 was 288 ryokan, 35 resort hotels and 100 business hotels.
- Sold-out property rate: the estimated share of properties whose listed inventory can no longer be confirmed on OTAs and similar channels.
- Data as of: August 18, 2026. Sales conditions and inventory move daily, so the figures in this article are a snapshot as at the time of retrieval.
■ Data sources
The estimated OCC, sold-out property rate and observed property counts in this article are based on in-house aggregation (MetroEngines Research) of OTA public inventory, observed daily for accommodation facilities in Gunma. Coverage comprises the 31 days of July 2026 (three property types: ryokan, business hotels and resort hotels) and a forward window with stay dates from August 19 to September 6, 2026. The settled ADR estimate uses the prefecture × property-type monthly series from the same aggregation, referencing confirmed values for both July 2025 and July 2026.
■ Calculation assumptions
Estimated OCC by day of week is the simple average of daily values (four days each for Monday, Tuesday, Saturday and Sunday; five days each for Wednesday, Thursday and Friday). The design excludes days with observation coverage below 50%, but all 31 days cleared the bar for all three property types, so no days were excluded. Booking curves for the forward window average the three dates per day of week aligned by days remaining, comparing the Saturday-minus-Wednesday gap at the same number of days remaining. The price metric is canonical at monthly granularity and is not handled at day-of-week or daily granularity.
■ Limitations and caveats
Estimated OCC is an estimate based on the absorption of OTA-listed inventory and differs in definition from actual room occupancy (it runs higher). Resort hotels have a small base at 29–33 properties observed daily, so inventory movements at a few properties feed easily into the day-of-week average. Because day-of-week averages blend days inside long weekends with ordinary days, a spread such as that between Sunday July 19 and Sunday July 5 does not appear in the average. The figures are a snapshot as at August 18, 2026 and may change on later retrieval as sales conditions move.
Related reading
- Kumamoto Day-of-Week Occupancy Inverts by Type: Thu 88.3% vs Sat 89.9%
- Saitama Business Hotels: Sat 77.2% vs Sun 70.1%, Gap Widens to 11pt
- Kyoto Day-of-Week OCC: Thursday 90.4% Edges Friday, May–Jul 2026
- Gunma Settled ADR June 2026: Business +2.9%, City -9.0%, Ryokan -3.9%
- Gunma Ryokan vs Resorts: +3.2pt and +5.5pt Gains from 45 Days Out
- Tochigi Booking Curves by Type: Resort 81.1% at T-45, Only +2.6pt Left