

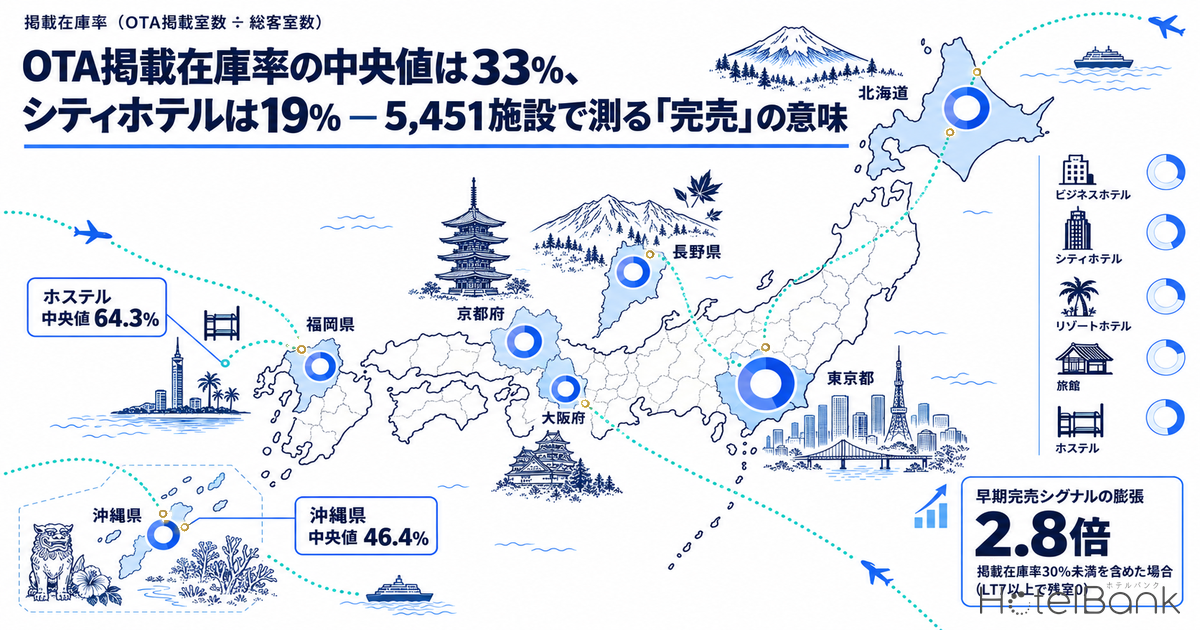
Zero rooms left on an OTA does not necessarily mean a hotel is full. As more articles read “sell-outs” from remaining-room trends, the premise worth checking first is what share of its rooms a property actually lists on the OTA in the first place. MetroEngines Research calculates, for each property, the OTA listing ratio: “the maximum number of sellable rooms observed on the OTA during the observation window ÷ total rooms.” This article aggregates 5,451 properties (stay date October 3, 2026) across seven prefectures — Tokyo, Osaka, Kyoto, Hokkaido, Okinawa, Fukuoka and Nagano — and five property types — business, city, resort, ryokan and hostel. It measures how the listing ratio is distributed by property type, room count and area, and how much the count of “sold-out” properties changes when properties with low listing ratios are included.
Metric Definitions Used in This Article
- OTA listing ratio: the maximum number of sellable rooms observed on a single OTA during the observation window (up to 90 days before check-in through the day of stay), divided by the property’s total rooms. The search condition is basically 2 adults / 1 night; for each property, the guest-count condition with the most observation points is used. For properties that sell dormitory beds individually, observed inventory can exceed room count, so the ratio is capped at 100% (171 properties, 3.1%).
- LT (lead time): days until check-in. LT0 = day of stay.
- Early sell-out LT: the lead time at which remaining rooms first reached 0. A larger value means rooms ran out earlier. This article counts properties observed at 0 rooms left at “LT7 or more” and “LT30 or more.” Properties that close sales on the day of check-in also show 0 rooms, so 0 rooms at LT0 is not counted as a sell-out.
- Target properties / with observations / analyzed: target properties are those in the area and property type covered by inventory observation; “with observations” are those with at least one remaining-room observation for the stay date; “analyzed” are those among them where at least one sellable room was observed.
- Data source: MetroEngines Research
- — Across 5,451 properties in 7 prefectures × 5 property types (stay date Oct 3, 2026), the OTA listing ratio has a median of 33.3% and an interquartile range of 13.3–64.5%. 46.3% of properties are below 30%.
- — By property type, city hotels have the lowest median at 18.7% (N=397) and hostels the highest at 64.3% (N=783). Business hotels: 28.3% (N=2,684).
- — The larger the property, the lower the ratio: 50.0% for ≤29 rooms vs. 18.5% for 200+ rooms. Conversely, the median maximum number of sellable rooms observed on the OTA widens the other way: 5 rooms vs. 57 rooms.
- — Including properties with a listing ratio below 30% inflates the number of properties observed at 0 rooms left at LT7 or earlier by 2.6–2.8x (Oct 3 stay: 2,569 vs. 916 properties).
- — In the below-10% band, 82.0% of properties look like early sell-outs. Zero rooms left can be read as strong demand only after checking the denominator.
What Is the OTA Listing Ratio? What It Tells You — and What It Doesn’t
Start with the definition. The OTA listing ratio takes “the maximum number of sellable rooms observed on the OTA during the observation window” as the numerator and “the property’s total rooms” as the denominator. For example, if a 100-room property shows at most 35 sellable rooms on the OTA during the window, its listing ratio is 35%. The starting point of this article is that the denominator when reading its remaining-room trend (booking curve) is those 35 rooms, not the 100 total rooms.
The metric has clear limits. Observation covers one OTA and one search condition (basically 2 adults / 1 night), so rooms allocated to other OTAs, direct sales on the official website, corporate contracts, or travel-agency group blocks are invisible. It therefore cannot be concluded that “a low listing ratio = strong direct sales.” At least the following factors are mixed behind a low listing ratio.
| Factor | Description |
|---|---|
| Allocation across OTAs | Inventory is split across several OTAs, so the allotment visible on any one OTA is only part of total rooms |
| Room-type-limited sales | Only room types matching the 2 adults / 1 night condition are observed. Single-occupancy rooms and rooms for 3+ guests do not enter the numerator |
| Group and corporate blocks | Rooms secured in advance through travel-agency group allotments or corporate contracts do not appear in OTA sellable inventory |
| Observation timing | Observation runs about once a day, so if inventory sells right after being added, the maximum may be missed. The median number of observation points is 86 per property per stay date |
| Allocation to direct and member channels | Allocating heavily to the official website or call center. This is one factor, but it cannot be observed separately from the factors above |
Source: MetroEngines Research; compiled by HotelBank Editorial Team
In other words, the listing ratio is correctly used not as a “sales-channel strategy metric” but as a measure of the size of the denominator when reading remaining-room data. With that premise in place, let’s look at the distribution.
Distribution Across 7 Prefectures × 5 Types — Median 33%, Nearly Half Below 30%
We aggregated stays on Saturday, October 3, 2026 across 7 prefectures × 5 property types. There were 14,292 target properties; 5,461 had remaining-room observations for the date, and 5,451 — those where at least one sellable room was observed — were analyzed. The listing ratio of the 5,451 analyzed properties has a median of 33.3% and a wide interquartile range of 13.3–64.5%. Properties below 30% account for 46.3%, while 15.6% are at 80% or above. Rather than reading this as “the typical property lists one-third of its rooms on the OTA,” it is closer to reality to read it as “variation between properties is very large.”
By property type, the differences are clear. City hotels have a median of 18.7% (N=397), the lowest of the five types, with 68.5% of properties below 30%. City hotels run multiple sales channels — banquets, corporate, travel agencies — so a small allotment visible on any one OTA is structural. Business hotels have a median of 28.3% (N=2,684), with 51.6% below 30% — more than half. Resort hotels follow at 31.5% and ryokan at 36.4%, while hostels stand out with a median of 64.3% (N=783), reflecting a type that is small, highly OTA-dependent and lists inventory by the bed.
Source: MetroEngines Research; compiled by HotelBank Editorial Team (Oct 3 stay, N=5,451 properties. Light band = 10th–90th percentile, dark band = interquartile range, black line = median)
By prefecture, Okinawa has the highest median at 46.4% (N=675), with 26.1% of properties at 80% or above. This likely reflects a market weighted toward resorts and hostels, where bookings from outside the islands tend to concentrate on OTAs. Tokyo (30.8%), Osaka (30.0%) and Hokkaido (30.0%) are at nearly the same level, with Kyoto (36.6%), Fukuoka (33.3%) and Nagano (33.3%) in between. Differences between prefectures depend heavily on property-type mix; comparing like-for-like types, area differences are smaller than type differences.
Source: MetroEngines Research; compiled by HotelBank Editorial Team (Oct 3 stay, N=5,451 properties)
Below we disclose, for all 35 prefecture × type cells, the median, interquartile range, share of properties below 30%, and three base counts: target properties / with observations / analyzed. Many cells have observations for only around 40% of target properties; this is because the targets include properties not listed on that OTA, properties selling only under other guest-count conditions, and properties not selling that date. Note that “analyzed” is limited to properties selling that date on that OTA. Cells with N below 20 (Osaka resorts, Okinawa ryokan, Okinawa city hotels, etc.) are for reference only.
| Type | Prefecture | Median | IQR | Below 30% | Target properties | With observations | Analyzed |
|---|---|---|---|---|---|---|---|
| Business hotels | Tokyo | 30.4% | 10.0–64.2% | 49.5% | 1,544 | 874 | 872 |
| Osaka | 30.3% | 12.5–68.3% | 49.3% | 985 | 467 | 467 | |
| Kyoto | 28.2% | 12.1–60.1% | 51.5% | 774 | 296 | 295 | |
| Hokkaido | 28.1% | 11.1–55.0% | 52.6% | 925 | 398 | 397 | |
| Okinawa | 33.3% | 15.2–70.2% | 44.0% | 487 | 184 | 184 | |
| Fukuoka | 20.4% | 7.7–50.5% | 59.7% | 488 | 319 | 318 | |
| Nagano | 22.2% | 7.2–46.0% | 59.6% | 567 | 152 | 151 | |
| City hotels | Tokyo | 15.6% | 5.0–43.9% | 67.0% | 177 | 103 | 103 |
| Osaka | 20.1% | 12.1–31.5% | 72.6% | 141 | 95 | 95 | |
| Kyoto | 19.3% | 13.0–35.9% | 67.9% | 94 | 56 | 56 | |
| Hokkaido | 17.9% | 9.2–29.6% | 74.7% | 110 | 75 | 75 | |
| Okinawa | 20.7% | 10.8–38.2% | 64.3% | 22 | 14 | 14 | |
| Fukuoka | 18.1% | 8.6–64.9% | 60.5% | 57 | 38 | 38 | |
| Nagano | 37.7% | 18.1–65.2% | 50.0% | 40 | 16 | 16 | |
| Resort hotels | Tokyo | 21.4% | 16.5–37.0% | 64.3% | 34 | 14 | 14 |
| Osaka | 18.1% | 8.8–32.8% | 66.7% | 12 | 6 | 6 | |
| Kyoto | 63.5% | 24.5–67.9% | 27.3% | 27 | 11 | 11 | |
| Hokkaido | 26.8% | 12.2–46.7% | 52.5% | 239 | 141 | 141 | |
| Okinawa | 33.3% | 16.7–64.0% | 45.8% | 482 | 253 | 251 | |
| Fukuoka | 51.4% | 21.4–86.1% | 35.7% | 24 | 14 | 14 | |
| Nagano | 31.8% | 14.4–61.2% | 46.8% | 327 | 111 | 111 | |
| Ryokan | Tokyo | 26.7% | 10.4–53.5% | 55.3% | 194 | 47 | 47 |
| Osaka | 37.5% | 29.6–64.6% | 25.8% | 122 | 31 | 31 | |
| Kyoto | 50.0% | 25.0–70.0% | 30.5% | 475 | 167 | 167 | |
| Hokkaido | 31.9% | 14.0–50.0% | 46.9% | 905 | 271 | 271 | |
| Okinawa | 58.3% | 31.6–74.2% | 18.2% | 84 | 11 | 11 | |
| Fukuoka | 50.0% | 26.7–76.1% | 29.7% | 190 | 64 | 64 | |
| Nagano | 35.4% | 18.5–58.5% | 42.0% | 1,427 | 448 | 448 | |
| Hostels | Tokyo | 50.0% | 21.6–84.3% | 28.1% | 716 | 146 | 146 |
| Osaka | 51.9% | 30.2–76.0% | 25.5% | 504 | 55 | 55 | |
| Kyoto | 50.0% | 28.8–85.3% | 26.0% | 817 | 131 | 131 | |
| Hokkaido | 66.7% | 31.8–97.7% | 23.5% | 302 | 100 | 98 | |
| Okinawa | 75.0% | 41.9–96.7% | 19.5% | 575 | 215 | 215 | |
| Fukuoka | 75.0% | 47.2–100.0% | 18.8% | 344 | 117 | 117 | |
| Nagano | 46.2% | 22.2–100.0% | 38.1% | 81 | 21 | 21 |
Source: MetroEngines Research; compiled by HotelBank Editorial Team (stay date Oct 3, 2026)
Relationship with Room Count — Smaller Properties List a Higher Share but Fewer Rooms
By total-room bracket, the fact that smaller properties show higher listing ratios comes through clearly. Properties with 29 rooms or fewer (N=1,920) have a median of 50.0%, with 24.8% at 80% or above. The median falls to 31.9% for 30–59 rooms, 25.0% for 60–99 rooms, 27.9% for 100–199 rooms, and 18.5% for 200+ rooms (N=786), where 63.9% of properties are below 30%.
However, the ratio and the room count move in opposite directions. The median maximum number of sellable rooms observed on the OTA is 5 rooms for ≤29 rooms, 13 for 30–59, 20 for 60–99, 38 for 100–199 and 57 for 200+. Large properties have a low ratio, but the absolute number listed on the OTA is more than 10x that of small properties — a large enough base to track daily changes in remaining rooms. Small properties, by contrast, may have a high ratio but a denominator of only about 5 rooms, so a single booking moves the remaining-room rate by 20 points. How “readable” remaining-room data is depends on both the ratio and the room count. The speed at which inventory is absorbed in each size bracket is examined from the same LT cross-section in Do Big Hotels Fill Last? 200+ Rooms Lead by 25.8pt at LT90; read together with the ratio discussion here, it shows the size effect from both sides.
Source: MetroEngines Research; compiled by HotelBank Editorial Team (Oct 3 stay, N=5,451 properties)
| Total-room bracket | N | Median listing ratio | IQR | Below 30% | Median max observed rooms | IQR (rooms) |
|---|---|---|---|---|---|---|
| ≤29 rooms | 1,920 | 50.0% | 23.9–78.9% | 31.3% | 5 rooms | 3–10 rooms |
| 30–59 rooms | 864 | 31.9% | 11.9–60.0% | 48.0% | 13 rooms | 5–25 rooms |
| 60–99 rooms | 697 | 25.0% | 10.0–51.6% | 54.9% | 20 rooms | 8–41 rooms |
| 100–199 rooms | 1,184 | 27.9% | 11.9–59.5% | 52.5% | 38 rooms | 16–81 rooms |
| 200+ rooms | 786 | 18.5% | 8.3–46.6% | 63.9% | 57 rooms | 24–124 rooms |
Source: MetroEngines Research; compiled by HotelBank Editorial Team (stay date Oct 3, 2026)
This size effect holds within property types too. Among business hotels alone, the median is 40.0% for ≤29 rooms and 22.2% for 200+ rooms; resort hotels widen in the same direction, 50.0% vs. 16.0%. Part of the type difference is explained by size, yet city hotels are 20.2% at 100–199 rooms and 15.5% at 200+ rooms — a notch below business hotels of the same size (29.1% and 22.2%). The gap that remains even after controlling for size can be interpreted as the channel mix specific to each property type.
Impact on Sell-Out Signals — Including the Below-30% Group Inflates “Sell-Outs” 2.8x
Properties with low listing ratios tend to be observed as “0 rooms left early” because their small allotments fill quickly. This is the biggest pitfall when reading sell-outs from remaining-room data. To measure how large the gap is, for the same stay date we compared “all analyzed properties” and “properties with a listing ratio of 30% or more” by the number of properties observed at 0 rooms left at LT7 or earlier (hereafter, early sell-out properties).
For the Saturday, October 3 stay, 2,569 of all 5,451 properties (47.1%) were early sell-outs, but narrowing to the 2,928 properties with a listing ratio of 30% or more gives 916 (31.3%). That is 2.8x by property count and a 15.8-point gap by share. Under the stricter LT30-or-more condition, it is 1,784 vs. 480 properties, widening the gap to 3.7x. For Saturday, September 19 — the first day of the Respect for the Aged Day holiday weekend — it was 3,365 for all properties vs. 1,277 for the ≥30% group, and for Friday, August 14 during Obon, 2,158 vs. 834. The multiple stays stable at 2.6–2.8x across dates.
Source: MetroEngines Research; compiled by HotelBank Editorial Team (3 stay dates, 7 prefectures × 5 property types)
| Stay date | All properties N | 0 rooms left at LT≥7 | 0 rooms left at LT≥30 | Listing ratio ≥30% N | 0 rooms left at LT≥7 | 0 rooms left at LT≥30 |
|---|---|---|---|---|---|---|
| Aug 14 (Fri) Obon | 5,487 | 2,158 (39.3%) | 1,233 (22.5%) | 3,144 | 834 (26.5%) | 401 (12.8%) |
| Sep 19 (Sat) holiday day 1 | 5,482 | 3,365 (61.4%) | 2,347 (42.8%) | 2,733 | 1,277 (46.7%) | 603 (22.1%) |
| Oct 3 (Sat) | 5,451 | 2,569 (47.1%) | 1,784 (32.7%) | 2,928 | 916 (31.3%) | 480 (16.4%) |
Source: MetroEngines Research; compiled by HotelBank Editorial Team (analyzed-property basis; figures in parentheses are shares of N)
Looking at the early sell-out share by listing-ratio band makes the mechanism clearer. Among properties with a listing ratio below 10%, 82.0% were observed at 0 rooms left at LT7 or earlier, and the median LT at which they first hit 0 was 67 days before. An allotment of just one or two rooms fills right after observation starts and is recorded as “0 rooms left” from then on. Even in the 10–29% band, 53.9% look like early sell-outs. By contrast, the share falls to 40.7% for 30–49%, 29.8% for 50–79% and 23.4% for 80% or above, where the median LT of reaching 0 is 1 day before. The same “0 rooms left” does not necessarily signal strong demand when it comes from a property with a low listing ratio.
Source: MetroEngines Research; compiled by HotelBank Editorial Team (Oct 3 stay, N=5,451 properties)
| Listing-ratio band | N | 0 rooms left at LT≥7 | 0 rooms left at LT≥30 | Median LT of first 0 rooms | Avg. days observed at 0 rooms |
|---|---|---|---|---|---|
| <10% | 1,041 | 82.0% | 72.6% | LT67 | 42.0 days |
| 10–29% | 1,482 | 53.9% | 37.0% | LT14 | 16.8 days |
| 30–49% | 900 | 40.7% | 25.0% | LT1 | 10.8 days |
| 50–79% | 1,177 | 29.8% | 14.4% | LT1 | 7.3 days |
| ≥80% | 851 | 23.4% | 10.1% | LT1 | 6.0 days |
Source: MetroEngines Research; compiled by HotelBank Editorial Team (stay date Oct 3, 2026. Median LT of first 0 rooms covers only properties observed at 0 rooms at least once)
This measurement is why HotelBank’s remaining-room and sell-out articles use “only properties with a listing ratio of 30% or more” as the standard analysis base. Including the below-30% group means more than half of early sell-outs consist of properties that “filled early because their allotment was small,” overstating an area’s demand strength. The 30% threshold sits where, as the early sell-out rate steps down from the below-10% band (82.0%) to 10–29% (53.9%) and 30–49% (40.7%), the median LT of reaching 0 rooms switches from “several weeks before” to “just before.” Conversely, even with the ≥30% filter about 31% of properties remain early sell-outs, so properties with strong demand can still be identified.
By prefecture, the multiples fall in a similar range. For the October 3 stay, early sell-out properties were 646 (all) vs. 191 (≥30%) in Tokyo (3.4x), 439 vs. 184 in Nagano (2.4x), and 272 vs. 119 in Okinawa (2.3x). The multiple is small in Okinawa, where listing ratios are high, and large in Tokyo, where the share of city hotels is high — the difference in distributions shows up directly in the multiples.
| Prefecture | All properties N | 0 rooms left at LT≥7 | ≥30% N | 0 rooms left at LT≥7 | Multiple |
|---|---|---|---|---|---|
| Tokyo | 1,182 | 646 | 605 | 191 | 3.4x |
| Osaka | 654 | 210 | 329 | 63 | 3.3x |
| Kyoto | 660 | 256 | 382 | 108 | 2.4x |
| Hokkaido | 982 | 441 | 493 | 142 | 3.1x |
| Okinawa | 675 | 272 | 426 | 119 | 2.3x |
| Fukuoka | 551 | 305 | 292 | 109 | 2.8x |
| Nagano | 747 | 439 | 401 | 184 | 2.4x |
Source: MetroEngines Research; compiled by HotelBank Editorial Team (stay date Oct 3, 2026)
Variation by Stay Date — The Same Property Moves 10 Points Between Dates
The listing ratio is not a fixed attribute of a property but a value observed for each stay date. For the 5,386 properties observed on both the August 14 and October 3 stays, the median absolute difference was 10.0 points; 35.7% of properties differed by 5 points or less and 50.8% by 10 points or less. Meanwhile, the “above or below 30%” classification matched for 78.1% of properties, so a threshold-based base design points to broadly the same group of properties even when the date changes.
This variation includes both movements: on peak dates, more is allocated to group blocks and direct sales and the OTA allotment is squeezed; conversely, inventory released back close to the date raises the observed maximum. So when gauging your own property’s listing ratio, it is practical to check across several dates — weekday, weekend and peak — rather than a single stay date.
Practical Implications — Know Your Own Listing Ratio and Design Channel Allocation
The analysis so far concerns base design on the market side, but from the property’s side the same metric is a way to check “how your hotel appears on the OTA.” The procedure is simple. First, count the rooms in the room types you sell under the 2 adults / 1 night condition out of your total rooms. Second, check the sellable rooms for each room type (allotment or remaining shared inventory) by date in the OTA extranet. Third, view the OTA search page under the same conditions as a guest and confirm that the displayed remaining rooms match the extranet. Record these three across weekday, weekend and peak dates, and you will see where your listing ratio sits relative to the area and type medians (the tables in this article).
With that in hand, here are three points to consider when designing OTA allocation. First, rate parity. In March 2022 the Japan Fair Trade Commission approved commitment plans from online hotel booking platform operators, confirming they would stop requiring rates and conditions equal to or better than other sales channels. With pricing constraints relaxed, inventory allocation (how many rooms to release to which channel) has become the main axis of differentiation, and the listing ratio is a yardstick for measuring the result of that design. How allocation differences affect the number of rooms a property can release on the day sales open was visible in the Kyushu Fukko Ouen-wari travel subsidy, where Saga opened OTA bookings on Sep 24 and travel-agency bookings on Oct 2 — an eight-day gap that showed up in the allocation ratios of 1,919 properties in Kyushu. Second, the cost of acquiring direct bookings. A 2026 overseas survey of independent hotels reported that 63.4% of bookings came through OTAs, with a cancellation rate of 21.8% for OTA bookings vs. 10.6% for direct. Direct sales carry no commission but do incur advertising, loyalty programs and booking-engine costs, so reducing the OTA allotment does not necessarily raise revenue. The listing ratio is not a “lower is better” metric; it is best read as the outcome of an allocation decided in light of each channel’s acquisition cost and cancellation rate. Third, releasing inventory back on peak dates. When you return inventory released from group or corporate holds to the OTA changes your sales opportunities close to arrival. As the band analysis in this article shows, properties with low listing ratios appear to the market as “0 rooms left” early in the lead time, so the later the release, the longer they are absent from guests’ search results. Setting release timing by date may have as much room to affect revenue as pricing does.
For those reading remaining-room data, the implication boils down to one point: an observation of 0 rooms left only has meaning once you check the denominator. When discussing an area’s sell-out situation, restrict to properties with a listing ratio of 30% or more; when discussing an individual property’s sell-out, state total rooms and the maximum observed rooms alongside the early sell-out LT. The measurements in this article back up why HotelBank’s remaining-room articles take this format. For an example of reading booking progress restricted to ≥30% properties, Nov 21-23 Foliage Weekend: Oita Ryokan 10.9% Left, Hiroshima 52.2% compares remaining-room rates across three prefectures on the same basis.
Methodology
The scope covers 7 prefectures — Tokyo, Osaka, Kyoto, Hokkaido, Okinawa, Fukuoka and Nagano — and 5 property types — business hotels, city hotels, resort hotels, ryokan and hostels — a subset of the roughly 27,000 operating properties tracked by MetroEngines Research. Stay dates are Friday, August 14, Saturday, September 19 and Saturday, October 3, 2026; all had passed at the time of aggregation, so their remaining-room trends are final. Distribution, size and band analyses use the October 3 stay, and the sell-out signal comparison shows all three dates. Observation runs from up to 90 days before check-in through the day of stay, with a median of 86 observation points per property per stay date. Each prefecture × type cell was retrieved in full by splitting at the municipality level, and we confirmed that the number of analyzed properties matched each cell’s base. Quartiles are calculated as percentiles with linear interpolation.
Summary
Across 5,451 properties in 7 prefectures × 5 property types, the OTA listing ratio has a median of 33.3% and an interquartile range of 13.3–64.5%, with large variation between properties. By type it ranges from 18.7% for city hotels to 64.3% for hostels; by size, from 50.0% for ≤29 rooms to 18.5% for 200+ rooms — the larger the property, the lower the ratio, while the absolute number of rooms rises. Including properties with a listing ratio below 30% inflates the number of “early sell-out” properties observed at 0 rooms left at LT7 or earlier by 2.6–2.8x, and in the below-10% band 82.0% look like early sell-outs. When reading demand from remaining-room data, check the denominator; and on the property side, know your own listing ratio across multiple dates and design allocation including channel costs and the timing of inventory releases. These two points are the conclusions of this article.
Frequently Asked Questions
Q. Does a low OTA listing ratio mean the property has strong direct sales?
A. That cannot be concluded. All we can tell is that the allotment visible under one OTA and one search condition is small; allocation to other OTAs, room-type-limited sales, group and corporate blocks, and observation timing can all produce the same result. Allocation to direct sales is just one of those factors.
Q. Why do remaining-room articles restrict to properties with a listing ratio of 30% or more?
A. Including properties below 30% increases the number observed at 0 rooms left at LT7 or earlier by 2.6–2.8x, and many of them simply filled early because their allotments were small. In the below-10% band 82.0% look like early sell-outs, versus only 23.4% in the 80%-or-above band. The base design avoids overstating demand strength.
Q. How can I check my own property’s listing ratio?
A. Count the rooms in the room types you sell for 2 adults / 1 night, then compare, date by date, the sellable rooms in the OTA extranet with the remaining rooms shown on the search page under the same conditions as a guest. Record this across weekday, weekend and peak dates and compare with the type and size medians in this article to see where you stand.
Related Reading
References and Sources
■ Data sources
Property-level remaining-room data continuously observed by MetroEngines Research. Covers 7 prefectures (Tokyo, Osaka, Kyoto, Hokkaido, Okinawa, Fukuoka, Nagano) and 5 property types (business hotels, city hotels, resort hotels, ryokan, hostels), aggregated for three stay dates: August 14, September 19 and October 3, 2026 (Oct 3 stay: 14,292 target properties, 5,461 with observations, 5,451 analyzed).
■ Calculation assumptions
OTA listing ratio = maximum sellable rooms observed on one OTA during the observation window (up to 90 days before check-in through the day of stay) ÷ total rooms. The search condition is basically 2 adults / 1 night, capped at 100%. Early sell-outs are properties observed at 0 rooms left at LT7 or more (or LT30 or more); 0 rooms at LT0 is not counted. Quartiles are percentiles with linear interpolation.
■ Limitations and caveats
Observation is limited to one OTA and one search condition and excludes rooms allocated to other OTAs, direct sales on official websites, corporate contracts and group blocks. The listing ratio varies by stay date and is not a fixed attribute of a property. Cells with N below 20 are for reference only. Figures from the overseas survey are reported values for independent hotels and do not apply directly to the Japanese market.
- MetroEngines Research — property-level remaining-room observation data (7 prefectures × 5 property types; stays on Aug 14, Sep 19 and Oct 3, 2026; 5,451–5,487 analyzed properties)
- Japan Fair Trade Commission (公正取引委員会), press release: approval of commitment plans submitted by online hotel booking platform operators, March 16, 2022
- Japan Fair Trade Commission (公正取引委員会), press release: approval of commitment plans submitted by online hotel booking platform operators, June 2, 2022
- Japan Tourism Agency (観光庁), “Guidelines on Display in Online Travel Transactions” (オンライン旅行取引の表示等に関するガイドライン), formulated June 2015
- Cloudbeds, “2026 State of Independent Hotels Report” (Hotel Online, 2026)