

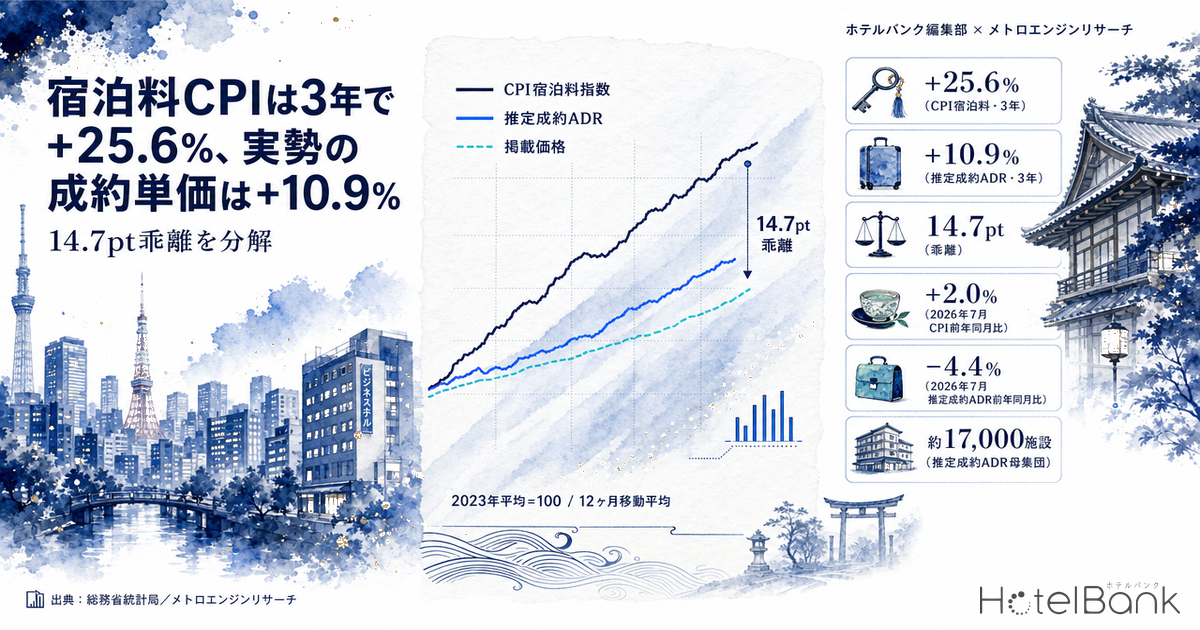
The “lodging” component of the Consumer Price Index (CPI), published monthly by Japan’s Ministry of Internal Affairs and Communications, stood 25.6% above its 2023 average as of July 2026 (12-month moving average, rebased to 2023 average = 100). Over the same period, the estimated settled ADR that MetroEngines Research compiles from roughly 17,000 properties nationwide reads 110.9 on the same basis. The gap has widened to 14.7 points. Hoteliers have said for years that government statistics do not match what they see on the ground; this article visualizes that divergence month by month and breaks down where it comes from.
Metric Definitions Used in This Article
- ADR (Estimated Settled ADR): The estimated settled rate (tax-exclusive equivalent) calculated by applying property-type correction factors to the cheapest publicly listed plan on OTAs and similar channels (double occupancy, per-room rate, tax-included). Cross-checked against property-level results disclosed by listed hotel REITs (91 properties, most recent three months), the median error is about 7%. This is an estimate and differs from each property’s actual transaction prices and accounting figures. Area-level ADR is the median of the properties covered (the level of a typical property in that area).
- Listed Price (All-Plan Average): The average price across all plans listed on OTAs and similar channels. Per-room rate at double occupancy (tax-included). Includes everything from room-only to meal-inclusive plans.
- CPI Lodging Index: The “lodging” sub-group of the Consumer Price Index published by the Statistics Bureau of Japan (2020 base, 2020 average = 100). For comparison purposes, this article rebases it to 2023 average = 100.
- Data Sources: MetroEngines Research / Statistics Bureau of Japan, “Consumer Price Index”
- — 14.7 points — With the 2023 average set to 100, the CPI lodging index reads 125.6 as of July 2026, while the estimated settled ADR reads 110.9. The gap accumulated through 2024 and has since plateaued in the 13–15 pt range.
- — Of that, about 5.9 points is explained by the choice of base year. Removing the first half of 2023 — when the national travel subsidy suppressed prices — from the starting point narrows the annualized gap from 5.1 pt/year to 3.2 pt/year.
- — The shift in property-type mix explains only 0.9 points. The ryokan share fell from 43.1% to 40.2%, but that is not the main driver of the gap.
- — The remaining about 7.9 points comes from a combination of fixed sampled items (ryokan = two meals included / hotels = breakfast included), a fixed panel of roughly 400 properties, and a single observation point two months before the stay date — elements that cannot be separated using public data.
- — July 2026 saw listed prices up 4.5% while the estimated settled ADR fell 4.4% — the two moved in opposite directions. CPI’s year-on-year change cannot serve as evidence of your own room to raise rates.
CPI Lodging Index +2.0% YoY in July 2026, Actual Settled Rate −4.4%
Start with the most recent figures. The CPI lodging index stood at 169.1 in July 2026, up 2.0% year on year. In the same month, MetroEngines Research’s nationwide listed price (all-plan average) was up 4.5% year on year, but the estimated settled ADR turned negative at −4.4%. This is a month in which the three indicators appear to point in different directions.
Disclosures from listed REITs offer another reference point. Invincible Investment Corporation reported an ADR of ¥15,100 across its 101 domestic hotels for July 2026, down 1.0% year on year, with occupancy at 86.3% (as of July 2026, monthly aggregate for 101 domestic properties, up 1.9 pt year on year). Japan Hotel REIT Investment Corporation disclosed a July 2026 ADR of ¥21,806 across the 29 hotels under variable-rent and similar structures, up 0.1% year on year, with room occupancy of 83.1% (as of July 2026, monthly aggregate for 29 hotels), up 4.0 pt year on year. Both show occupancy rising while rates stay roughly flat — closer to the deceleration in our estimated settled ADR than to CPI’s +2.0%.
Source: Compiled by the HotelBank Editorial Team from MetroEngines Research and the Statistics Bureau of Japan, “Consumer Price Index” (estimated settled ADR: monthly values for all 47 prefectures, weighted by number of properties covered, N=15,793–17,209 properties per month)
From mid-2025 through year-end, CPI and our data broadly pointed the same way. The divergence becomes conspicuous only from 2026. Since February 2026, listed prices have held at +8–10% year on year while growth in the estimated settled ADR decelerated sharply, sinking into negative territory in June and July. Asking prices keep rising, but the level at which rooms actually sell has not kept up — and that is what the widening gap between these two lines shows.
A 14.7-Point Gap Opened in Three Years — Indexed and Overlaid
Because single-month year-on-year figures swing widely, we overlay the three series on a 12-month moving average to strip out seasonality. With the 2023 average set to 100, as of July 2026 CPI reads 125.6, listed price 120.1, and estimated settled ADR 110.9. The gap between CPI and the estimated settled ADR is 14.7 points.
Source: Compiled by the HotelBank Editorial Team from MetroEngines Research and the Statistics Bureau of Japan, “Consumer Price Index” (12-month moving average, 2023 average = 100)
What matters is how the gap widened. It was 8.4 points as of December 2024, expanded to 13.8 points by October 2025, and has since plateaued in the 13–15 point range. In other words, the divergence is not a one-off step change: it built up steadily through 2024 and has not narrowed since.
| Period (12-month moving average) | CPI Lodging | Listed Price | Estimated Settled ADR | Gap vs CPI |
|---|---|---|---|---|
| Dec 2023 (base) | 100.0 | 100.0 | 100.0 | — |
| Dec 2024 | 114.7 | 106.5 | 106.3 | −8.4pt |
| Dec 2025 | 122.5 | 115.1 | 109.3 | −13.2pt |
| Jul 2026 | 125.6 | 120.1 | 110.9 | −14.7pt |
Source: Compiled by the HotelBank Editorial Team from MetroEngines Research and the Statistics Bureau of Japan, “Consumer Price Index”
That said, the level of any index depends heavily on the base year chosen. Setting 2023 as the base introduces a distortion on the CPI side that cannot be ignored. The next section starts there.
Gap Factor 1: Base-Year Distortion — The National Travel Subsidy Pushed Down H1 2023
The national travel subsidy launched in October 2022 discounted room rates at participating properties, which directly pushed down the CPI lodging index because CPI captures the price consumers actually pay.The Statistics Bureau of Japan publishes reference estimates that exclude policy effects, showing that the lodging index in the first half of 2023 was suppressed by the subsidy program.
That makes 2023 an awkward base year. The CPI lodging index was 110.8 in January 2023 and 157.3 that August — a move of more than 40% in just seven months. Actual room rates did not move that much in such a short span; this was the unwinding of the subsidy compounded by seasonality.
Source: Compiled by the HotelBank Editorial Team from the Statistics Bureau of Japan, “Consumer Price Index” (2020 base, 2020 average = 100)
The year-on-year overlay shows that only 2023 dips sharply in January–March. From 2024 onward the same shape repeats — an August peak with troughs in June and January — so the seasonal pattern itself is stable. This means that as long as 2023 is set to 100, the CPI-side growth rate will read somewhat high. The question is whether a 14.7-point gap remains after discounting for this, and the factors below all operate independently of the base year.
Gap Factor 2: The Property-Type Mix Shift Explains Only 0.9 Points
A common explanation is that “the share of cheaper property types has grown, so the average only looks lower.” Test it, and the effect turns out to be smaller than expected. Here we compare estimated settled ADR by property type for 2023 and 2026, both limited to January–July.
Source: MetroEngines Research (comparison of January–July averages; 2026 N = 7,434 business / 1,106 city / 1,576 resort / 6,788 ryokan properties)
| Property type | Jan–Jul 2023 | Jan–Jul 2026 | Change | Share 2023→2026 |
|---|---|---|---|---|
| Business hotels | ¥7,100 | ¥8,700 | +22.8% | 42.1% → 44.0% |
| City hotels | ¥10,600 | ¥13,200 | +25.2% | 6.4% → 6.5% |
| Resort hotels | ¥14,400 | ¥16,500 | +14.6% | 8.4% → 9.3% |
| Ryokan | ¥13,600 | ¥14,700 | +8.2% | 43.1% → 40.2% |
Source: MetroEngines Research (estimated settled ADR, double occupancy, tax-exclusive equivalent)
Holding the four property types at their 2023 shares and applying 2026 prices yields +14.1%; using the actual shares yields +13.1%. The 0.9-point difference is the drag from the mix shift. The ryokan share moved from 43.1% to 40.2% and business hotels from 42.1% to 44.0%, but that is an order of magnitude too small to explain a 14.7-point gap.
What stands out instead is that ryokan estimated settled ADR rose only 8.2% over three years. While business and city hotels posted gains above 20%, ryokan alone are clearly sluggish. And for ryokan, the CPI lodging index uses “Japanese-style room, one night with two meals” as its representative item. That leads directly to the next factor.
Gap Factor 3: The Sampled Items Are Fixed — The Distance Between “Western Room, Breakfast Included” and the Cheapest Plan
The items sampled by the CPI lodging index are fixed: “Japanese-style room, one night with two meals” for ryokan and “Western-style room, one night with breakfast” for hotels. Our estimated settled ADR, by contrast, starts from each property’s cheapest plan, which in practice is usually room-only. That difference in conditions affects both the level and the rate of change.
Isolating only cases where the same hotel sells both a room-only plan and a breakfast-included plan and measuring the difference (a paired comparison) gives a nationwide weighted average of +9.1%, or roughly ¥2,000 in added value (N=18,788 pairs, May–August 2026). Comparing the levels of two indices that do not hold meal conditions constant embeds a systematic gap of about this size. How far that premium swings by prefecture and property type is a separate question, and the spread is wide.
On top of that, price revisions do not proceed at the same pace for meal-inclusive and room-only plans. Rising ingredient and labor costs are passed through more strongly to meal-inclusive plans, so an index that fixes “two meals” or “breakfast included” as its sampled item is structurally more prone to reading high.
Gap Factor 4: A Fixed Panel of About 400 Properties Against More Than 1,700 New Entrants a Year
The CPI lodging index covers about 400 lodging properties nationwide (2020 base). Under the 2015 base it covered 320 properties nationwide with 640 price quotes, so the 2020 base expanded both property and quote counts substantially. Even so, the population remains a fixed panel.
Properties whose operation can be confirmed through OTA and similar listings number about 27,000, with roughly 1.26 million rooms (MetroEngines Research, based on listings confirmed as of July 2026).Of those, the verified property types eligible for estimated settled ADR calculation number about 17,000 per month (15,793–17,209 properties per month from January 2023 through July 2026).
And new properties enter the market every year. Within our coverage, new openings confirmed through OTA and similar listings numbered 1,975 properties in 2024 and 1,741 in 2025. A fixed-panel index does not, by design, absorb that inflow.
Source: MetroEngines Research & Consulting (based on confirmed OTA listings, N = 1,975 properties in 2024 / 1,741 in 2025). Note: listings typically appear several months before opening, so counts for the most recent periods may rise as further listings appear.
Here is a counterintuitive fact. New entrants are not “large, high-rate hotels.” Of the 1,975 properties that opened in 2024, the largest group was rental villas at 837, followed by business hotels at 215 and guesthouses at 180. In 2025, rental villas again led with 747. Average room count was 20 in 2024 and 24 in 2025. Even narrowing to properties with 100 or more rooms, 37 of the top 50 were business hotels in both 2024 and 2025. On how the picture changes when the same supply is recounted on a room basis, Japan’s 1,242 openings and 33,749 rooms in 2026 sets out the contrast between property counts and room counts.
In short, new supply is not pushing the market average up; if anything it is adding weight to the small, lower-rate end. The hypothesis that “new high-rate openings are lifting the real-world average and CPI is missing them” is not supported, at least on a property-count basis. The problem with a fixed panel is not that it overlooks expensive newcomers — it is that it does not see the turnover at the base of the market at all.
Gap Factor 5: A Design That Fixes the Price at Two Months Before the Stay Date
The 2020-base CPI lodging index uses the price paid two months before the stay date. That timing was set based on a 2017 survey and fiscal 2018 interviews with travel agencies as the point at which consumers most often book. The design is reasonable in itself, but by definition it captures none of the price movement that occurs as the stay date approaches.
How much movement follows can be seen by tracking listed prices by lead time. The table below shows average listed prices by lead time (LT) for major areas, for check-ins in July 2026.
Source: MetroEngines Research (check-ins in July 2026, listed prices, all-plan average; LT0 = day of check-in)
| Area | LT60 (CPI observation point) | LT7 | LT0 | LT60→LT0 |
|---|---|---|---|---|
| Tokyo | ¥24,500 | ¥24,200 | ¥21,700 | −11.3% |
| Osaka | ¥16,200 | ¥14,700 | ¥12,800 | −20.8% |
| Kyoto | ¥26,900 | ¥24,400 | ¥21,200 | −21.3% |
| Hokkaido | ¥26,900 | ¥28,000 | ¥23,400 | −13.1% |
| Okinawa | ¥32,200 | ¥30,700 | ¥24,700 | −23.5% |
Source: MetroEngines Research (check-ins in July 2026)
From LT60 to LT0, the average listed price falls 11.3% in Tokyo, 20.8% in Osaka, 21.3% in Kyoto, and 23.5% in Okinawa. Hokkaido recovers once between LT30 and LT7 before dropping 13.1% into the day of stay. That range of movement lies outside what the CPI design observes. As for when price revisions actually happen, When Do Hotels Raise Rates? observes the distribution of price revisions across 12,821 properties.
One caveat on interpretation: the LT0 listed price is “the price of remaining inventory,” not the average price at which rooms sold. If higher-rate rooms sell first and cheaper inventory remains, the average falls — and the reverse can also happen. What can be said here is only that the price distribution keeps moving after the single point CPI fixes on, and that this movement does not enter the index.
Rebuilding the 14.7 Points — What Can Be Quantified and What Cannot
Of the five factors above, only some can be converted into yen or index points using public data. Separating what can be quantified from what cannot, we rebuild the 14.7 points. First, we measure how much the choice of base year matters by moving the starting point.
| Base month | Span | CPI Lodging | Estimated Settled ADR | Gap | Annualized gap |
|---|---|---|---|---|---|
| Dec 2023 | 31 months | +25.6% | +10.9% | 14.7pt | 5.1 pt/yr |
| Dec 2024 | 19 months | +9.5% | +4.3% | 5.2pt | 3.2 pt/yr |
| Dec 2025 | 7 months | +2.5% | +1.5% | 1.1pt | 1.9 pt/yr |
Source: Compiled by the HotelBank Editorial Team from MetroEngines Research and the Statistics Bureau of Japan, “Consumer Price Index” (the 12-month moving-average series used in the article, rebased to 100 at each base month; annualization uses the geometric mean)
Simply excluding the first half of 2023, still affected by the national travel subsidy, drops the annualized gap from 5.1 points/year to 3.2 points/year. Over the most recent seven months it is 1.9 points/year. The gap itself remains elevated in the 13–15 point band, but the speed at which it is still widening has slowed — the level and the rate of change need to be read separately.
This relationship allows a counterfactual estimate of how much including the first half of 2023 in the base year contributes. Had the pace since December 2024 (CPI +5.9%/year, estimated settled ADR +2.7%/year) continued for 31 months, the July 2026 gap would have been just 8.8 points. The difference from the actual 14.7 points — about 5.9 points — is what arises from including the first half of 2023 in the starting point.
| Factor | Contribution to the 14.7 pt | Quantifiable? Basis |
|---|---|---|
| 1. Including the first half of 2023 (the unwinding of the national travel subsidy) in the base year | approx. 5.9 pt | Yes. The difference from a counterfactual extending the post-December 2024 pace over 31 months |
| 2. Shift in property-type mix | 0.9pt | Yes. +14.1% holding 2023 shares constant, +13.1% at actual shares |
| 3–5. Fixed sampled items, a fixed panel of about 400 properties, and a single observation point two months before the stay date | approx. 7.9 pt (residual) | No. These cannot be separated from one another using public information. Clues to the level difference are the +9.1% meal-condition gap (N=18,788 pairs) and the −11.3% to −23.5% move from LT60 to LT0 |
Source: Compiled by the HotelBank Editorial Team from MetroEngines Research and the Statistics Bureau of Japan, “Consumer Price Index.” Note: item 1 is a counterfactual on a 12-month moving-average basis, while item 2 compares January–July 2023 with January–July 2026, so the estimation periods and aggregation units differ. Read this as an approximation intended to convey orders of magnitude, not a strict additive decomposition. The residual is a composite of items 3–5 and includes unknown factors.
Two things follow. First, just under 40% of the gap (about 6.8 points) can be explained by circumstances outside the measurement itself — the choice of base year and the property-type mix — while the remaining 7.9 points or so stems from the CPI survey design itself. Second, that residual cannot be split into its individual causes using public data. That is precisely why the next section is about choosing the indicator that fits your purpose, rather than treating CPI’s year-on-year change as a proxy for market reality.
Comparing the Designs — Not Which Is Right, But What Each Measures
Here we organize the factors above as differences in survey design.
| Item | CPI Lodging Index (2020 base) | MetroEngines Research |
|---|---|---|
| Properties covered | About 400 properties nationwide (fixed panel) | About 27,000 properties whose operation can be confirmed via OTA and similar listings; about 17,000 per month are eligible for ADR calculation |
| Sampled items | Ryokan = Japanese-style room, one night with two meals / hotels = Western-style room, one night with breakfast | All plans (listed price) / cheapest plan as the starting point (estimated settled ADR) |
| Price observation point | Two months before the stay date (a single fixed point) | Continuous observation from LT90 to LT0 |
| Treatment of extreme values | Plans that are extremely expensive relative to typical rates, or extremely cheap due to sales, are excluded | Aggregated on a median basis (limiting the influence of outliers) |
| Reflection of new openings | Reviewed at base-year revisions | On a rolling basis once listings are confirmed (1,700–2,000 properties a year) |
| Weights | Spending composition of domestic households, based on the Family Income and Expenditure Survey | Property-count basis (demand from inbound visitors is also reflected in prices) |
| Publication lag | About one month | Confirmed months in the following month; forward months observed via listing snapshots |
| Number of price quotes | Just over one million per month (2020 base) | All property-by-day observations in the monthly aggregate |
Source: Compiled by the HotelBank Editorial Team from the Statistics Bureau of Japan, “Price Indices for Travel Services under the 2020 Base” (June 7, 2021) and MetroEngines Research
This table makes clear that the two are not “measuring the same thing with different precision.” CPI is designed to track price change in the lodging costs paid by domestic households, holding definitions fixed so the series connects over the long run. Fixing the sampled item and the observation point is not a compromise on accuracy; it is a design principle that protects comparability over time. Our data, by contrast, goes after what is being sold in the market right now, at what price, and at what level it is likely settling — turnover in the population included. Different purposes give different answers.
There is one more difference that is easily overlooked. Because CPI weights are based on the Family Income and Expenditure Survey, spending by inbound visitors is excluded in principle. When rates move in areas and property types where inbound demand concentrates, that weight does not enter CPI. In discussing markets with a high inbound share, this difference becomes too large to ignore.
Which Indicator Investors, Governments, and Hotel Operators Should Watch
The conclusion is that these three groups should watch different indicators.
| Role | Primary indicator to watch | Why |
|---|---|---|
| Investors and analysts | Property-level ADR and RevPAR disclosed by REITs / estimated settled ADR | Earnings are driven by settled rate × occupancy. CPI measures household prices, not operator revenue |
| Government and policymakers | CPI lodging index plus the Japan Tourism Agency’s “Accommodation Travel Statistics Survey” | A fixed-definition long-run series is needed, alongside the burden felt by domestic households. Read it accounting for policy effects such as travel subsidies |
| Hotel operators and revenue managers | Own results plus estimated settled ADR in the local competitive market / remaining inventory and prices by lead time | Decisions are made at the level of one property’s own catchment and specific dates. National averages and CPI year-on-year changes are too coarse for pricing decisions |
| All | Treat months in which indicators point in different directions as a signal | A phase like June–July 2026, with listed prices positive and settled rates negative, is a sign that the gap between asking prices and actual bookings is widening |
Source: Compiled by the HotelBank Editorial Team
For hotel operators in particular, the key point is not to use CPI’s year-on-year change as grounds for raising your own rates. A 2.0% year-on-year rise in the CPI lodging index does not mean comparable-grade properties in your catchment were able to raise rates by 2%. Likewise, the fact that the nationwide estimated settled ADR fell 4.4% year on year in July 2026 cannot be used as-is for an individual property’s decisions. What you need is the actual market level, on the target dates, at the few dozen properties you actually compete with.
Conversely, when investors set ADR assumptions in a business plan, using growth in the CPI lodging index as a proxy for top-line growth can lead to overestimation on the order of 14.7 points over three years. Property-level results disclosed by listed REITs are the best public data available for checking that math.
Summary
Measured against the 2023 average, the CPI lodging index and the actual estimated settled ADR were 14.7 points apart as of July 2026. Almost none of that difference is explained by the shift in property-type mix (0.9 points). It arises instead from an accumulation of design characteristics: the national travel subsidy effect embedded in the base year, fixed sampled items (two meals for ryokan, breakfast for hotels), a fixed panel of about 400 properties, a single observation point two months before the stay date, and weights based on the Family Income and Expenditure Survey.
Neither is wrong. CPI was built to connect price change in the lodging costs paid by domestic households over the long run, and for that purpose it is appropriately designed. But that design is not built to measure the earnings trajectory of a hotel business. Reading government statistics alongside market data — an obvious enough exercise — needs to be done with particular care in the lodging sector. The split in direction between listed prices and settled rates in June–July 2026 is the most recent example of why.
Related Reading
- 76.8% of Japan’s 27,248 Hotels Are Independent — 42.5% by Room Count, Chain Penetration 2026
- OTA Price Gaps: 71% Identical Across 9,030 Matched Pairs (2026)
- Japan Inbound July 2026: 3.44M Arrivals, 41.7–42.8M Full-Year Landing Range
- Japan 2026: 1,242 Openings, 33,749 Rooms — 47% Villas, 42% Business Hotel Rooms
- When Do Hotels Raise Rates? 12,821 Hotels Show Hikes Win Only at Longer Lead Times
- Does New Hotel Supply Cut ADR? 47 Prefectures Tested — It Only Bites Below 13,000 Rooms
References and Sources
■ Data Sources
The CPI lodging index uses the monthly series for the “lodging” sub-group of the Statistics Bureau of Japan’s “Consumer Price Index” (2020 base), rebased to 2023 average = 100 for the comparisons in this article. Market-side figures are monthly aggregates for all 47 prefectures (listed price = all-plan average; estimated settled ADR = cheapest plan level with property-type correction factors applied; January 2023 through July 2026, N=15,793–17,209 properties per month). The property-type comparison uses 2026 N = 7,434 business / 1,106 city / 1,576 resort / 6,788 ryokan properties. The meal-condition gap is a paired comparison of room-only and breakfast-included plans within the same property (N=18,788 pairs, May–August 2026). Lead-time prices cover check-ins in July 2026. REIT results are from each investment corporation’s monthly disclosures.
■ Assumptions
All three series are compared on a 12-month moving average to strip out seasonality, with each index rebased to 100 at the base month. Annualization uses the geometric mean (compounding). The “gap under different base months” divides the same series by each base month rather than re-aggregating the data. The roughly 5.9-point base-year contribution is calculated as the difference between the actual 14.7 points and a counterfactual gap of 8.8 points, assuming the post-December 2024 annual pace (CPI +5.9%/year, estimated settled ADR +2.7%/year) continued for 31 months. The 0.9-point mix-shift figure is the difference between holding 2023 shares constant (+14.1%) and using actual shares (+13.1%).
■ Limitations and Caveats
The estimated settled ADR is an estimate and differs from each property’s actual transaction prices and accounting figures (median error of about 7% when cross-checked against REIT disclosures). Because CPI and the estimated settled ADR differ in population, sampled items, observation point, and weighting, their levels cannot be compared directly; this article is limited to comparing rates of change. The breakdown of the gap places side by side values with different estimation periods and aggregation units, and is an approximation rather than a strict additive decomposition. The residual of about 7.9 points is a composite of sampled items, the fixed panel, and the observation point, and includes unknown factors. Listed prices by lead time represent “the price of remaining inventory,” not the average settled price. REIT results depend on each investment corporation’s disclosure scope (such as properties under variable-rent structures) and are not representative of the whole market.
■ Government Statistics
- Statistics Bureau of Japan, “Consumer Price Index (CPI)” (e-Stat table ID: 0003427113, “lodging” sub-group, nationwide, monthly, 2020 base)
- Statistics Bureau of Japan, Price Statistics Office, “Price Indices for Travel Services under the 2020 Base” (June 7, 2021) — primary source for the sampled items, number of properties covered, and price collection timing for lodging
- Statistics Bureau of Japan, “Retail Price Survey: Glossary of Terms”
- Ministry of Internal Affairs and Communications, “2020-Base Consumer Price Index, Japan, December 2023 and 2023 Annual Average” — reference estimates excluding the effect of the national travel subsidy
- Japan Tourism Agency, “Accommodation Travel Statistics Survey”
■ REIT Disclosures
- Invincible Investment Corporation, “Monthly Operating Status, July 2026” (101 domestic hotels)
- Japan Hotel REIT Investment Corporation, “Hotel Operating Results” — monthly results for the 29 hotels under variable-rent and similar structures (July 2026, as of August 26, 2026)
■ Market Data
- MetroEngines Research — monthly ADR for all 47 prefectures (listed price and estimated settled ADR, January 2023 through July 2026), listed prices by lead time, paired comparison by meal type, and new-opening data
- MetroEngines Research & Consulting — new-opening aggregates (based on confirmed OTA listings)