

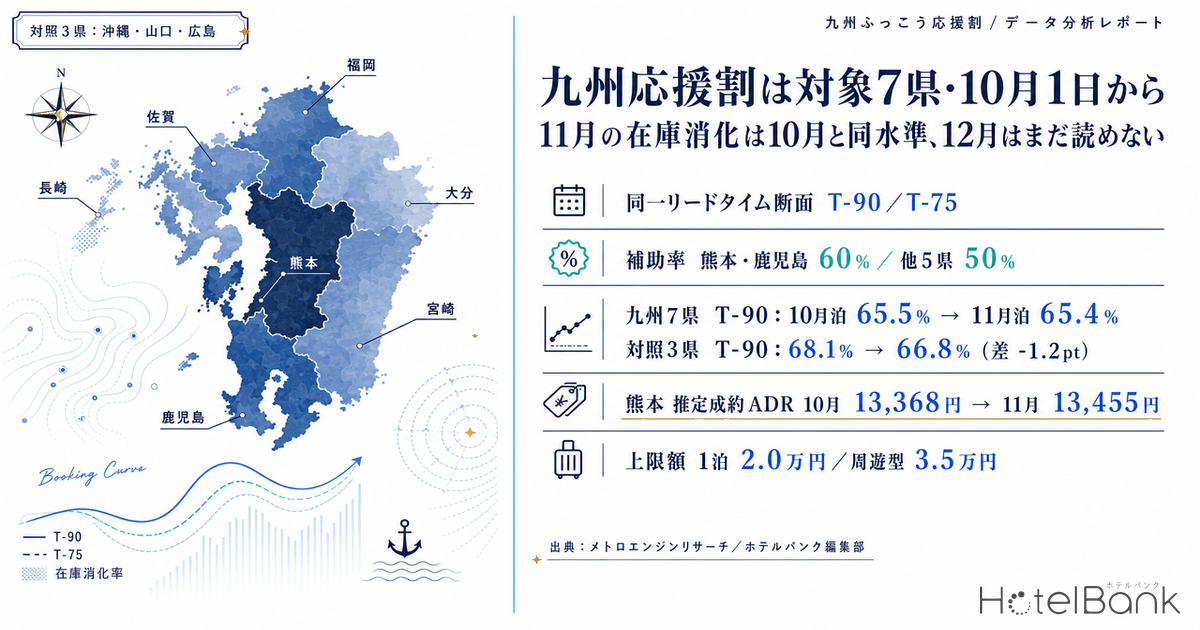
The Kyushu Reconstruction Support Subsidy (九州ふっこう応援割) applies to stays from 1 October 2026 onward and covers all seven Kyushu prefectures. The subsidy rate is 60% for Kumamoto and Kagoshima and 50% for the other five prefectures; because each prefecture sets its own end date and booking-open date, those remained unannounced as of the 28 August 2026 release. For revenue managers on the ground, the practical question is whether demand pulling into October means softer advance pickup for November and December. This article lines up inventory absorption at matched lead-time snapshots and four months of listed prices for the seven Kyushu prefectures and three control prefectures (Okinawa, Yamaguchi, Hiroshima), separating what can be read now from what cannot yet.
Metric Definitions Used in This Article
- ADR (average daily rate) = an estimated settled rate (tax-excluded equivalent), calculated by applying a business-type correction coefficient to the lowest published plan rate each property lists on OTAs and similar channels (two guests per room, per-room rate, tax included). Cross-checked against property-level results disclosed by listed hotel REITs (91 properties, most recent 3 months), the median error is approximately 7%. It is an estimate and differs from each property’s actual settled rates and accounting figures. Area-level ADR is the median of the properties covered (the level of a typical property in that area).
- Listed price (all-plan average) = the average listed rate across all plans, from room-only to meal-inclusive (two guests per room, per-room rate, tax included). Because it uses a different basis from estimated settled ADR, the two must not be added to or subtracted from each other.
- OCC (occupancy rate) = the share of sold rooms against total rooms in the area (an estimate based on OTA sales inventory). This article writes it as “occupancy rate (OTA-listed-inventory basis, estimated).” It is an estimate based on how inventory offered on OTAs is being absorbed, and differs from each property’s actual overall occupancy.
- LT (lead time) = days remaining until the check-in date. LT0 = same day. T-90 refers to the snapshot 90 days before check-in.
- Data source: MetroEngines Research
- — Inventory absorption for November stays is roughly level with October stays (seven-prefecture Kyushu average: T-90 -0.2pt, T-75 +0.6pt). The gap sits within the spread between prefectures (standard deviation 1.1-1.8pt), so no wait-and-see effect specific to Kyushu in November can be confirmed.
- — If anything, the softening is in the three control prefectures (Okinawa, Yamaguchi, Hiroshima), at T-90 -1.2pt and T-75 -0.7pt. A shift of demand toward Okinawa is likewise not visible in the pickup data.
- — Neither listed prices nor estimated settled ADR spike in October, and in six of the seven prefectures November’s estimated settled ADR exceeds October’s. Properties have not yet priced on the assumption of a discount.
- — December stays cannot be judged — there were zero observation points as of the survey date (1 September 2026). T-60 becomes readable in mid-October and T-45 in early November, and that sets the calendar for price revisions.
Confirmed So Far: Start Date, Eligible Prefectures and Subsidy Rates — End Dates Set by Each Prefecture
First, the outline of the scheme. According to the Japan Tourism Agency’s announcement, discounts apply to stays from 1 October 2026 onward across the seven Kyushu prefectures. The subsidy rate is 60% for Kumamoto and Kagoshima, the prefectures most affected by the 2026 Kumamoto Earthquake, and 50% for Fukuoka, Saga, Nagasaki, Oita and Miyazaki. Caps per person per trip are ¥20,000 for a single accommodation-only night, ¥30,000 for transport-inclusive stays of two nights or more, and ¥35,000 for multi-prefecture itineraries covering two or more prefectures. On the other hand, the booking-open date and the end of the discount period are set individually by each prefecture, and neither was fixed as of the 28 August announcement. How a 10pt difference in subsidy rate across a prefectural border feeds through to net rates is examined concretely in the net-rate gap between Kurokawa Onsen and Yufuin.
| Name | Kyushu Reconstruction Support Subsidy (tourism demand recovery support following the 2026 Kumamoto Earthquake) |
| Eligible stay period | Stays from Thursday 1 October 2026 onward. End date set by each prefecture; unannounced as of the 28 August 2026 release |
| Eligible prefectures | The seven Kyushu prefectures: Fukuoka, Saga, Nagasaki, Kumamoto, Oita, Miyazaki and Kagoshima |
| Subsidy rate | Kumamoto and Kagoshima 60% / Fukuoka, Saga, Nagasaki, Oita and Miyazaki 50% |
| Cap (per person per trip) | Accommodation-only one night or transport-inclusive one night ¥20,000 / transport-inclusive two nights or more ¥30,000 / multi-prefecture itinerary (two or more prefectures) ¥35,000 |
| Booking-open date | Set individually by each prefecture (unannounced as of the release) |
Source: Japan Tourism Agency, “2026 Kumamoto Earthquake related information (on the Kyushu Reconstruction Support Subsidy)”; compiled by the HotelBank Editorial Team
From a property’s point of view, this unannounced end date feeds into both pricing and inventory design. Whether the scheme ends with October or extends into November and December changes both the prices to place on November and December now and how much potentially subsidy-eligible inventory to hold back. So the first step is to check how demand is actually moving, through inventory absorption.
Matched Lead-Time Snapshots: November Absorption Is Roughly Level with October
The comparison design is deliberately simple. For each check-in month, occupancy rates (OTA-listed-inventory basis, estimated) are averaged at the same lead time (T-90 / T-75), and October stays are placed alongside November stays. Because lead time is held constant, apparent differences caused by different observation dates disappear. If November stays were absorbing more slowly, that would read as a sign of wait-and-see.
Source: MetroEngines Research; compiled by the HotelBank Editorial Team
The result: for the seven-prefecture Kyushu average, T-90 was 65.5% for October stays against 65.4% for November stays (-0.2pt), and T-75 was 66.4% against 67.0% (+0.6pt). At the same snapshots the three control prefectures went from 68.1% to 66.8% at T-90 (-1.2pt) and from 69.8% to 69.1% at T-75 (-0.7pt). The direction is in fact the opposite: it is the three control prefectures whose November absorption is relatively softer. That said, every gap stays in the 1-2pt range, and by prefecture the signs vary — Kumamoto -1.6pt, Saga +1.2pt, Nagasaki -1.8pt. At this point there is no clear gap indicating wait-and-see specific to Kyushu in November — that is the straightforward reading.
Judgment benchmark — group-average gaps versus between-prefecture spread
Prefecture-level gaps within Kyushu (November stays minus October stays) average -0.2pt at T-90 with a standard deviation of 1.10pt and a range of -1.8 to +1.2pt, and +0.6pt at T-75 with a standard deviation of 1.83pt and a range of -2.6 to +3.7pt. At both snapshots the spread between prefectures exceeds the group-average gap, so a difference of -0.2pt or +0.6pt is not at a level that can be read as “wait-and-see specific to Kyushu in November.” The three control prefectures show a comparable T-90 standard deviation of 1.10pt, and their -1.2pt group-average gap also falls within that spread. As a practical decision threshold, a group-specific movement should only be treated as real once the group-average gap persistently exceeds the between-prefecture standard deviation (approximately 1.1-1.8pt in these observations). (N = 7 Kyushu prefectures and 3 control prefectures; standard deviation is the population standard deviation; as of 1 September 2026.)
| Prefecture | T-90 (90 days out) | T-75 (75 days out) | October stays only | |||||
|---|---|---|---|---|---|---|---|---|
| Oct stays | Nov stays | Diff | Oct stays | Nov stays | Diff | T-60 | T-45 | |
| Kumamoto(Kyushu 7) | 63.6 | 62.0 | -1.6 | 63.8 | 64.3 | +0.5 | 65.7 | 67.6 |
| Kagoshima(Kyushu 7) | 51.3 | 51.3 | +0.0 | 52.5 | 52.3 | -0.2 | 53.9 | 54.2 |
| Oita(Kyushu 7) | 66.4 | 67.0 | +0.6 | 67.4 | 69.1 | +1.7 | 68.7 | 69.7 |
| Fukuoka(Kyushu 7) | 68.7 | 69.6 | +0.9 | 70.3 | 71.7 | +1.4 | 72.3 | 73.9 |
| Nagasaki(Kyushu 7) | 73.0 | 71.2 | -1.8 | 73.7 | 73.3 | -0.4 | 74.6 | 73.4 |
| Saga(Kyushu 7) | 68.9 | 70.1 | +1.2 | 69.9 | 73.6 | +3.7 | 70.9 | 70.5 |
| Miyazaki(Kyushu 7) | 66.8 | 66.3 | -0.5 | 67.0 | 64.4 | -2.6 | 68.2 | 67.9 |
| Okinawa(control) | 67.6 | 65.4 | -2.2 | 69.9 | 68.9 | -1.0 | 72.7 | 76.1 |
| Yamaguchi(control) | 68.6 | 68.9 | +0.3 | 69.7 | 70.3 | +0.6 | 71.5 | 72.9 |
| Hiroshima(control) | 68.0 | 66.2 | -1.8 | 69.7 | 68.0 | -1.7 | 71.9 | 73.0 |
| Kyushu 7 average | 65.5 | 65.4 | -0.2 | 66.4 | 67.0 | +0.6 | 67.8 | 68.2 |
| Control 3 average | 68.1 | 66.8 | -1.2 | 69.8 | 69.1 | -0.7 | 72.0 | 74.0 |
October stays N=31 days; November stays N=29 days at T-90 and N=15 days at T-75 (averaged across each prefecture’s check-in dates). Source: MetroEngines Research; compiled by the HotelBank Editorial Team
The other thing worth noting is the difference in the levels themselves. At T-90, Nagasaki is at 73.0% and Fukuoka at 68.7%, against Kagoshima at 51.3%. Even within Kyushu, the depth of unsold capacity remaining 90 days out varies by more than 20pt. Kagoshima, where the subsidy discount is largest, reaches the scheme’s start date holding thicker capacity than the other prefectures in both October and November. How much of October’s unsold inventory sits in Kumamoto and Kagoshima at the 60% subsidy rate is measured prefecture by prefecture in Kyushu Subsidy: Kumamoto & Kagoshima Hold 34.9% of Oct Unsold Rooms.
Viewed Along the Lead-Time Axis, Kyushu’s Curve Rises More Gently
Seen as curves rather than snapshots, Kyushu and the three control prefectures differ in shape. For October stays, the control group builds about 5.9pt from 68.1% at T-90 to 74.0% at T-45, while the seven Kyushu prefectures build about 2.7pt, from 65.5% at T-90 to 68.2% at T-45. Kyushu’s curve is flatter, carrying unsold capacity further into the near-in window. That shape is well suited to a measure like this subsidy, where demand is added later. Carrying capacity into the near-in window is also characteristic of Kyushu’s peak season; the same between-prefecture gaps appear in Obon T-7: Kyushu’s 31.7pt Gap.
Source: MetroEngines Research; compiled by the HotelBank Editorial Team
The November-stay curve breaks off around T-63. That is a matter of observation, not demand. T-90 for a 30 November stay falls on 1 September, and T-61 for a 1 November stay also falls on 1 September, so for November stays no snapshot closer in than T-60 yet exists. Anything said about “near-in demand for November” therefore has to wait until October at the earliest.
The Structural Reason December Cannot Yet Be Read
For December stays, this article presents no inventory-absorption figures. T-90 for a 1 December stay is 2 September, so as of the survey date (1 September 2026) not a single observation point exists for December stays. The booking curves in this article cover only lead times within 90 days; earlier windows are excluded because coverage is unstable in the initial observation period.
The practical implication is clear: whether December advance pickup is slowing cannot be judged until observations accumulate through September. Put the other way, because December stays enter the observation window daily from early September, the T-60 snapshot for December stays becomes readable in mid-October and the T-45 snapshot in early November. For properties that would rather not lock in December pricing while the end date remains unannounced, this observation schedule provides a guide to price-revision timing.
The listed-property count is likewise on the “still growing” side. Kumamoto Prefecture has 693 properties listed on OTAs for September stays against 534 for December, and Okinawa 2,200 against 1,853 — fewer the further out the month. This does not mean fewer properties operate in December; it shows that listing is still in progress.
Listed Prices Do Not Spike in October — November Is Higher in Most Prefectures
Next, the price side. If demand were pulling into October, you would expect listed prices to spike in October, or November and December to fall. The measurements do not show that.
Source: MetroEngines Research; compiled by the HotelBank Editorial Team
Year-on-year changes in listed prices (all-plan average, two guests per room, tax included) average +10.3% in September, +10.0% in October, +8.7% in November and +13.0% in December across the seven Kyushu prefectures. The three control prefectures average +13.5%, +14.8%, +13.8% and +11.6% respectively, so no October-specific rise on the Kyushu side can be confirmed. If anything, from September to November Kyushu’s increases are milder than the control group’s.
Looking at the four-month series of estimated settled ADR (all aligned on the same listing-snapshot basis), Kumamoto runs ¥13,628 in September → ¥13,368 in October → ¥13,455 in November → ¥12,618 in December. October is not the peak; November is slightly higher. The same shape appears in Kagoshima, Oita, Fukuoka, Saga and Miyazaki, so in six of the seven prefectures November’s estimated settled ADR is higher than October’s. Oita rises consistently from ¥14,530 in September to ¥17,865 in December — ordinary year-end seasonality showing through as it is.
| Prefecture | Listed price (all-plan average, two guests per room, tax included / year-on-year) | Estimated settled ADR (tax-excluded equivalent) | ||||||
|---|---|---|---|---|---|---|---|---|
| Sep | Oct | Nov | Dec | Sep | Oct | Nov | Dec | |
| Kumamoto | 25,961 +7.5% | 25,710 +4.8% | 26,025 +3.2% | 26,353 +5.6% | 13,628 | 13,368 | 13,455 | 12,618 |
| Kagoshima | 17,866 +8.4% | 17,816 +7.0% | 17,912 +5.6% | 18,214 +7.1% | 9,676 | 9,685 | 9,866 | 9,603 |
| Oita | 34,277 +12.5% | 35,618 +9.3% | 37,364 +10.4% | 41,101 +20.3% | 14,530 | 15,696 | 16,430 | 17,865 |
| Fukuoka | 24,397 +10.0% | 28,229 +13.9% | 29,677 +12.2% | 30,632 +21.8% | 12,554 | 14,118 | 14,965 | 14,198 |
| Nagasaki | 19,550 +5.4% | 21,218 +7.3% | 20,513 +0.6% | 21,127 +7.5% | 10,534 | 11,746 | 11,207 | 10,902 |
| Saga | 28,896 +8.7% | 30,958 +14.1% | 34,524 +16.6% | 33,154 +14.0% | 13,718 | 14,533 | 15,700 | 15,149 |
| Miyazaki | 17,391 +19.8% | 17,442 +13.3% | 17,829 +12.4% | 17,023 +14.7% | 9,537 | 9,805 | 9,873 | 9,522 |
| Okinawa | 28,507 +14.4% | 28,063 +16.6% | 27,124 +18.4% | 28,637 +22.4% | 12,646 | 12,512 | 11,379 | 12,002 |
| Yamaguchi | 19,825 +10.2% | 20,656 +13.9% | 20,284 +13.0% | 18,683 +3.9% | 10,346 | 10,747 | 10,598 | 10,903 |
| Hiroshima | 21,870 +15.8% | 23,086 +13.9% | 22,951 +9.9% | 20,592 +8.4% | 12,042 | 12,430 | 12,328 | 10,763 |
Only the listed-price figures are year-on-year comparisons against the prior year (2025). Estimated settled ADR is aligned on the listing-snapshot basis for all four months of September-December 2026. Sample sizes (October 2026 stays) are N=222-2,138 properties for listed price and N=150-502 properties for estimated settled ADR (by prefecture; Kumamoto listed N=673 / settled N=382, the smallest being Saga at listed N=222 / settled N=150, the largest Okinawa at listed N=2,138 / settled N=502). Source: MetroEngines Research; compiled by the HotelBank Editorial Team
What this shows is that properties have not yet placed “discount-assumed” prices on October. With a 50-60% subsidy rate and a ¥20,000 cap, any price band that does not press against the cap leaves the guest paying roughly half. Reaching the start date without moving listed prices first is a stance that preserves room to adjust once the effect of the cap is visible.
The First Week After the Announcement: October Pitch Held, November Barely Moved
The announcement came on 28 August. In the matched-LT snapshots above, T-90 for October stays was observed in July and T-90 for November stays from early to late August, so most of that falls before the announcement. To look closer in, only check-in dates with matching observation windows were extracted as a fixed cohort, and the daily build-up in occupancy from 18 August was tracked.
Source: MetroEngines Research; compiled by the HotelBank Editorial Team
Comparing the daily pitch for 20-27 August against 27-30 August, October stays in the seven Kyushu prefectures held pace, moving from +0.19pt/day to +0.21pt/day, while October stays in the three control prefectures softened from +0.27pt/day to +0.17pt/day. For November stays, Kyushu went from +0.16pt/day to +0.13pt/day and the control group from +0.21pt/day to +0.12pt/day, so both groups softened in the same direction — November in Kyushu is not softening in any special way. With only three days of post-announcement observation, no firm conclusion can be drawn from this.
The 2016 Subsidy’s Monthly Pattern Does Not Map Directly onto This One
As a historical reference point there is the 2016 Kyushu Reconstruction Subsidy. Introduced after the 2016 Kumamoto Earthquake, it ran from July to December 2016 and finished with 2,719,000 users, about 1.8 times the original target. However, at that time the full period was set out in advance as six months, and the discount rate was designed to step down partway through (Kumamoto and Oita at up to 70% from July to September and 50% from October to December). From a traveller’s perspective, a “go earlier, save more” incentive along the time axis was made explicit from the start.
This time the start is 1 October, with end dates set by each prefecture and unannounced. Discount rates are 60% for Kumamoto and Kagoshima and 50% for the other five prefectures, with no step-down partway through indicated so far. The structural pressure to “go earlier to save more” is weaker than in 2016, replaced by the uncertainty of not knowing how long the scheme runs. Overlaying the 2016 monthly absorption pattern (front-loaded) directly onto this scheme is therefore not appropriate. Better to hold open both possibilities: that front-loading is less pronounced than in 2016, and that demand shifts again when end dates are announced.
How to Sell November and December Until End Dates Are Announced
On the basis of the measurements above, four action points for properties. All of them are built around the premise that the end date is unannounced.
| Issue | What the measurements show | Action |
|---|---|---|
| November and December pricing | Listed prices do not spike in October, and estimated settled ADR is higher in November than October in six of the seven prefectures | Do not place discount-assumed prices ahead of time. If the scheme extends past October, the subsidy lands on top of prices already cut; if it does not, you compete at the bare level. Decide first on a level that survives either outcome |
| Inventory on high-absorption October dates | T-45 for the seven Kyushu prefectures averages 68.2%, thicker unsold capacity than the control group’s 74.0%. By prefecture the gap is close to 20pt, from Nagasaki 73.4% and Fukuoka 73.9% to Kagoshima 54.2% | On dates already well absorbed at T-45, it is straightforward to deliberately hold back non-discounted inventory (direct booking, room-only, higher room categories). Conversely, steer the discount toward dates with thicker remaining capacity |
| Cancellation policy | Both the booking-open date and the end date are set by each prefecture and unannounced. Rebooking may occur around the point the scheme is confirmed | Align policies between subsidy-eligible plans and standard plans to limit the operational load at switchover. State clearly in the booking flow that eligible dates may change later |
| Timing of the December decision | Observation of December inventory absorption begins on 2 September, with T-60 readable in mid-October and T-45 in early November | Do not finalise December pricing during September; design the point at which the T-60 snapshot appears as the revision moment |
Source: MetroEngines Research; compiled by the HotelBank Editorial Team
A Shift of Demand to Okinawa Cannot Be Confirmed from Current Pickup
Okinawa Prefecture is not among the areas covered. Since Kyushu becomes relatively cheaper, it is reasonable to ask whether demand moves to Okinawa — or the reverse, from Okinawa to Kyushu — so this was checked as a secondary question using pickup data.
Okinawa’s T-90 goes from 67.6% for October stays to 65.4% for November stays (-2.2pt), and T-75 from 69.9% to 68.9% (-1.0pt). That is comparable to Hiroshima (-1.8pt at T-90), and together with Yamaguchi (+0.3pt) the three control prefectures show no consistent direction. In the fixed cohort covering the three days after the announcement, Okinawa’s October and November stays also move in the same direction as the other control prefectures.
On year-on-year listed prices, Okinawa continues to run higher than the Kyushu prefectures, at +14.4% in September, +16.6% in October, +18.4% in November and +22.4% in December. This trend long predates the subsidy announcement, however, and is not material that can be interpreted in connection with the scheme.At this point, no sign of demand moving between Kyushu and Okinawa can be confirmed from pickup data。
Summary: November Is Level, December Awaits Observation
Three conclusions. First, at matched lead-time snapshots, inventory absorption for November stays across the seven Kyushu prefectures is roughly level with October stays (-0.2pt at T-90, +0.6pt at T-75), and it is the three control prefectures whose November absorption is softer. Wait-and-see specific to Kyushu in November does not show up as a clear gap at this point.
Second, neither listed prices nor estimated settled ADR spike in October, and in six of the seven prefectures November’s estimated settled ADR exceeds October’s. Properties are set to reach the start date without having placed discount-assumed prices.
Third, December stays fall outside the observation window and cannot be judged. T-90 observation for December stays begins on 2 September, with T-60 readable in mid-October and T-45 in early November. Until end dates are announced, using this observation schedule as the price-revision calendar is the realistic approach. And since the scheme differs in design from 2016, preparation built on that year’s monthly absorption pattern is best avoided.
⚠ Note on ADR for future dates: The October, November and December ADR and listed-price figures in this article are estimates based on rates published on OTAs and similar channels as of the survey date (1 September 2026), and they change as check-in dates approach. Current levels will not necessarily become settled levels. Inventory-absorption figures are likewise estimates based on how inventory offered on OTAs is being absorbed, and differ from each property’s actual overall occupancy.
Related Reading
- Kyushu Subsidy: Kumamoto & Kagoshima Hold 34.9% of Oct Unsold Rooms
- Kyushu Subsidy: 10pt Border Step Cuts Kurokawa-Yufuin Gap to ¥665
- Kyushu Subsidy Start Date Unset: ¥15.5bn = 2.3-4.6M Person-Nights
- Kyushu Subsidy: All 7 Prefectures Beat Control on October Saturdays
- Kyushu Recovery Subsidy Set: 60%/50% Split, ¥20,000 Cap Hits Top 10%
- Oita’s 5-Day Silver Week: Ryokan Occupancy Splits 93.4% vs 72.6%
- Estimated OCC vs Sell-Out Rate: Tokyo Business 77.7% vs Capsule 93.8%
References and Sources
■ Data sources
Listed prices and estimated settled ADR are monthly aggregations of publicly listed OTA rates collected by MetroEngines (10 prefectures, September-December 2026 stays). Occupancy is estimated from how inventory offered on OTAs is being absorbed, aggregated at lead-time snapshots for each check-in date (T-90 / T-75 / T-60 / T-45). Daily pitch immediately after the announcement was calculated by extracting only check-in dates with matching observation windows as a fixed cohort. Scheme details (start date, eligible prefectures, subsidy rates, caps) follow published Japan Tourism Agency materials.
■ Calculation assumptions
ADR is a per-room rate at two guests per room. Listed price is the all-plan average (tax included); estimated settled ADR is an estimated settled rate (tax-excluded equivalent) derived by applying a business-type correction coefficient to the lowest plan level. Because the bases differ, the two are never added to or subtracted from each other. Future months (October-December 2026 stays) are aligned across all four months on the listing snapshot as of the survey date, 1 September 2026. Prefecture-level occupancy is the simple average across the check-in dates covered, and group averages (7 Kyushu prefectures, 3 control prefectures) are simple averages of prefectures rather than room-count weighted. Standard deviations are population standard deviations with the prefecture as the unit.
■ Limitations and caveats
Occupancy is an estimate on an OTA-listed-inventory basis and differs from each property’s actual overall occupancy. Estimated settled ADR is an estimate with a median error of approximately 7% when cross-checked against property-level results disclosed by listed hotel REITs (91 properties, most recent 3 months). Because November stays are unobserved closer in than T-60 and December stays are unobserved at every snapshot as of the survey date, those windows were excluded from assessment. Post-announcement observation covers only three days, so no firm conclusion can be drawn from changes in daily pitch. Neither the booking-open date nor the end date of the scheme has been announced, and the possibility that demand moves once they are is not factored in.
■ Market data
- MetroEngines Research — listed prices and estimated settled ADR (September-December 2026, 10 prefectures); occupancy rate (OTA-listed-inventory basis, estimated) at matched lead-time snapshots (October 2026 stays N=31 days / November stays N=29 days)
■ Government and public information
- Japan Tourism Agency, “2026 Kumamoto Earthquake related information (includes the Kyushu Reconstruction Support Subsidy)”
- Japan Tourism Agency, “2026 Kumamoto Earthquake related information”
- Japan Meteorological Agency, “2026 Kumamoto Earthquake portal site” (occurred 28 July 2026 at 16:27, maximum seismic intensity 7)
■ Historical cases and press coverage
- Nikkei, “Kyushu Reconstruction Subsidy used by 2,719,000 people, 1.8 times the target”
- Kyushu Tourism Organization, “On the Kyushu Reconstruction Subsidy results (estimate) and related matters”
- Travel Voice, “Kumamoto Earthquake: accommodation cancellations in the prefecture expected to reach roughly 65,000 person-nights and ¥900 million” (3 August 2026)
- Kanko Keizai Shimbun, “¥900 million in accommodation cancellations from the Kumamoto Earthquake; ryokan and hotels begin accepting secondary evacuees”