

A resort hotel development plan will spell out the floor area of guest rooms, restaurants, the spa and the car park. It rarely spells out the floor area and cost of the place where staff sleep. At an urban hotel, employees rent their own homes and commute; at a resort, there is no commuting catchment to speak of. If the operator does not provide housing, the workforce simply does not materialise.
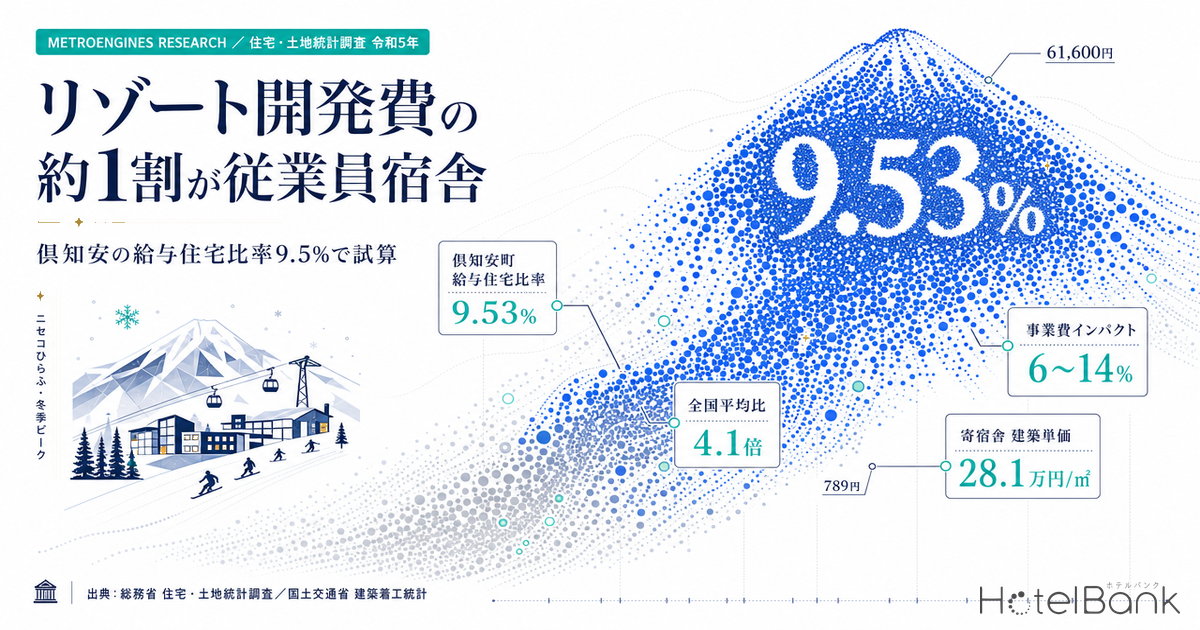
This “staff housing” — employer-provided housing (kyuyo jutaku) in statistical terms — is tabulated in every round of the Ministry of Internal Affairs and Communications’ Housing and Land Survey as one category of housing tenure. Using the final figures from the 2023 survey, this article quantifies the share of employer-provided housing in the residential stock of resort municipalities, the gap against market rents, and — from land prices and construction costs — the order of magnitude of staff housing cost. The conclusion first: the employer-provided housing ratio in Kutchan, Hokkaido is 9.53%, 4.1 times the national average of 2.34%, and 10th out of the 1,210 municipalities covered. Nine of the top 10 are company towns built on steel, paper or automobiles. Kutchan is the only one whose main industry is tourism.
Metric Definitions Used in This Article
- Employer-provided housing (kyuyo jutaku) = housing owned or managed by the employer — a company, government office or organisation — and occupied by the employee for work reasons or as part of remuneration. Company apartments and public-servant housing fall into this category. It includes cases where the employer rents ordinary housing on the market and the employee lives there, whether or not rent is paid (Ministry of Internal Affairs and Communications, “2023 Housing and Land Survey: Explanation of Terms”).
- Employer-provided housing ratio = number of employer-provided dwellings ÷ number of occupied dwellings. Vacant homes are not in the denominator.
- ADR (average daily rate) = an estimated settled rate (tax-exclusive equivalent) calculated by applying a segment-specific adjustment factor to the lowest published plan level on OTAs (double occupancy, per-room rate, tax-inclusive). Cross-checked against property-level results disclosed by listed hotel REITs (91 properties, most recent 3 months), the median error is roughly 7%. These are estimates and differ from each property’s actual transacted rates and accounting figures. Area-level ADR is the median of the properties covered — the level of a typical property in that area.
- Data sources: Ministry of Internal Affairs and Communications, “2023 Housing and Land Survey” / Ministry of Land, Infrastructure, Transport and Tourism, “Statistics on Building Construction Starts” and “Real Estate Information Library” / MetroEngines Research & Consulting
- — Kutchan’s employer-provided housing ratio of 9.53% is 4.1 times the national average of 2.34% and ranks 10th among the 1,210 municipalities with 1,000 or more total dwellings. Nine of the top 10 are company towns built on steel, paper or automobiles; Kutchan is the only one whose main industry is tourism.
- — The correlation coefficient is 0.86 between tourism intensity (guest rooms ÷ total dwellings) and the employer-provided housing ratio (N=12 municipalities). The larger a town’s room count relative to its housing stock, the fewer alternatives exist to the operator supplying accommodation.
- — Rent for employer-provided housing in Kutchan is 31% of private rental housing (¥348/m² vs ¥1,137/m²). The ¥789/m² gap works out to ¥545,000 per dwelling per year — not a discount but, in substance, part of labour cost, and it persists throughout the operating life.
- — Converting vacant homes does not work. Of Karuizawa’s 20,030 vacant dwellings, 17,940 are secondary homes (holiday houses) and only 310 are available for rent. Even in Kutchan, 550 vacant rental dwellings sit against 690 units of employer-provided housing — converting every one of them would still not replace the existing stock.
- — Construction cost for dormitory-type buildings is ¥281,000/m² (2024, nationwide — 47% of the ¥591,000/m² for lodging buildings). For a 100-room resort hotel, staff housing amounts to 6–14% of project cost, or ¥150–320mn, equivalent to about 10 guest rooms.
Kutchan ranks 10th nationally — and the rest of the top 10 are company towns
Once every five years, the Housing and Land Survey classifies every dwelling in Japan into five tenure categories: owner-occupied, publicly managed rental, UR/public corporation rental, private rental, and employer-provided housing. The last of these is housing owned or leased by companies for their employees. In the 2023 survey (reference date: 1 October 2023), the national total was 1,302,100 dwellings, or 2.34% of the 55,665,000 occupied dwellings.
Of the 1,283 areas included in the municipal tabulation, ranking the 1,210 municipalities with 1,000 or more total dwellings by ratio gives a median of 1.72%. The top 10 are as follows.
| Rank | Municipality | Employer-housing ratio | Employer-provided dwellings | Occupied dwellings | Main industrial background |
|---|---|---|---|---|---|
| 1 | Kimitsu, Chiba | 10.88% | 3,650 | 33,560 | Steel |
| 2 | Shikokuchuo, Ehime | 10.50% | 3,680 | 35,060 | Paper |
| 3 | Satsumasendai, Kagoshima | 10.34% | 4,240 | 41,000 | Power generation, manufacturing |
| 4 | Oyama, Shizuoka | 10.25% | 620 | 6,050 | Manufacturing |
| 5 | Yahatahigashi-ku, Kitakyushu, Fukuoka | 10.02% | 3,070 | 30,640 | Steel |
| 6 | Kashima, Ibaraki | 9.93% | 2,830 | 28,490 | Steel |
| 7 | Oizumi, Gunma | 9.92% | 1,820 | 18,340 | Automobiles |
| 8 | Kanegasaki, Iwate | 9.76% | 560 | 5,740 | Automobiles |
| 9 | Kamogawa, Chiba | 9.66% | 1,380 | 14,280 | Healthcare, tourism |
| 10 | Kutchan, Hokkaido | 9.53% | 690 | 7,240 | Tourism, resorts |
Ranks 1 through 8 are all municipalities hosting large manufacturing plants — a distribution that traces the history of Japanese industry itself, where companies built corporate housing to secure labour. Ninth-placed Kamogawa mixes large medical institutions with tourism. Among them, only Kutchan at 10th reaches the same level without any manufacturing cluster at all.
Kutchan’s employer-provided housing accommodates 940 people, or 6.66% of the town’s 14,110 residents in occupied dwellings. The comparable national figure is 1.82%, so people live in “housing provided by the employer” at roughly 3.7 times the national density.
Tourism intensity moves with the housing ratio — correlation 0.86
To test whether Kutchan is an exception or a structure common to resort municipalities, we lined up the employer-provided housing ratio against “tourism intensity” (guest rooms in lodging facilities ÷ total dwellings) for the 12 tourism and hot-spring municipalities included in the municipal tabulation.
The Pearson correlation across the 12 municipalities is 0.857. The more guest rooms a town has relative to its housing stock, the higher its employer-provided housing ratio. Kutchan has 5,596 guest rooms against 9,150 total dwellings — rooms equal to 61.2% of the housing stock. Toba, Mie follows (43.7%; employer housing 8.49%). Conversely, in destinations with a sizeable everyday population nearby — Beppu, Oita (12.5%; 2.87%) or Nago, Okinawa (12.4%; 2.87%) — the ratio stays close to the national average.
The reading is straightforward. Where a town does not contain enough housing to match the room count of its lodging facilities, employees either commute in from outside or live in accommodation the operator provides. And in mountainous areas with thin public transport — a winter ski resort, for instance — the first option effectively disappears. The pattern in the Specified Skilled Worker (Lodging) intake points the same way: the greater the weight of foreign workers in a region, the more housing becomes the operator’s problem to solve.
This figure is a lower bound. In the Housing and Land Survey, “buildings such as company or public-office single-person dormitories that house unmarried employees who do not share a livelihood” are classified not as dwellings but as “non-dwelling buildings in which people live”, and are not counted as employer-provided housing. Nationwide there are 9,300 such company dormitories and boarding houses. The employer-provided housing ratio used here therefore counts only unit-type company housing with its own kitchen and bathroom — a conservative measure. Actual staff accommodation capacity, including shared-facility dormitories, is larger.
Kutchan, Hakuba and Onna — positioning and data limits
Of the three resort municipalities covered here, municipal-level employer-provided housing data is available only for Kutchan. Hakuba, Nagano and Onna, Okinawa are not included in the municipal tabulation of the Housing and Land Survey (1,283 areas). We therefore fall back to prefectural figures for those two villages rather than filling in municipal values by estimation.
| Item | Kutchan, Hokkaido | Hakuba, Nagano | Onna, Okinawa |
|---|---|---|---|
| Lodging facilities | 428 | 1,025 | 386 |
| Total guest rooms | 5,596 | 9,618 | 6,468 |
| Of which facilities with 20+ rooms | 56 facilities · 3,970 rooms | 92 facilities · 3,424 rooms | 40 facilities · 5,579 rooms |
| Estimated settled ADR (January 2026) | approx. ¥61,600 (N=20) | approx. ¥21,500 (N=44) | approx. ¥16,900 (N=38) |
| Estimated settled ADR (July 2026) | approx. ¥17,500 (N=22) | approx. ¥11,700 (N=44) | approx. ¥30,400 (N=42) |
| Employer-provided housing ratio | 9.53% (town) | 2.07% (Nagano Pref.) | 1.86% (Okinawa Pref.) |
| Private rental, monthly rent | ¥1,137/m² (town) | ¥1,081/m² (Nagano Pref.) | ¥1,161/m² (Okinawa Pref.) |
| Employer-provided housing, monthly rent | ¥348/m² (town) | ¥629/m² (Nagano Pref.) | ¥569/m² (Okinawa Pref.) |
| Highest residential land point | ¥200,000/m² (+10.5%) | ¥27,400/m² (+33.0%) | ¥54,700/m² (+9.4%) |
| Highest commercial land point | ¥181,000/m² (+16.0%) | ¥40,300/m² (+35.2%) | ¥108,000/m² (+9.5%) |
| Land price basis | 2026 Official Land Price Survey | 2026 Official Land Price Survey | 2025 Prefectural Land Price Survey |
All three are clearly in a land-price upswing. Residential land in Hokujo, Hakuba rose +33.0% year on year in the 2026 Official Land Price Survey, and commercial land in the village +35.2% — among the steepest rates of change in the country. Residential land in Kutchan’s Niseko Hirafu district has reached ¥200,000/m², an extraordinary level for a rural town. Commercial land in Onna (Maeganeku) stands at ¥108,000/m².
Demand patterns differ sharply across the three. Kutchan’s estimated settled ADR swings to an extreme in winter — approximately ¥61,600 in January 2026 (N=20 facilities) — before falling to approximately ¥17,500 in July (N=22 facilities). Onna is the mirror image, a summer market at approximately ¥30,400 in July (N=42 facilities) against approximately ¥16,900 in January (N=38 facilities). Hakuba runs at approximately ¥21,500 in January and ¥11,700 in July: seasonal, but with a smaller amplitude than Kutchan. As shown in our analysis of Niseko’s supply structure, Kutchan has limited high-rate room supply while its seasonal rate swing is the largest of the three — and staffing needs concentrate into the peak by the same measure.
The real cost of staff housing — a ¥789 monthly gap per m² against market rent
Employer-provided housing is a category defined “whether or not rent is paid”, and in most cases it is offered to employees below market rent. Because the Housing and Land Survey tabulates monthly rent per m² of total floor area by tenure category, private rental and employer-provided housing can be compared directly within the same municipality.
Nationally, rent for employer-provided housing is 60% of private rental; in Kutchan it falls to 31%. Per m² per month, that is ¥348 against ¥1,137 for private rental — a gap of ¥789. Kutchan’s employer-provided dwellings average 57.58 m² of total floor area, so the gap against market rent is roughly ¥45,400 per dwelling per month, or about ¥545,000 a year. Applied across all 690 dwellings in the town, operators are absorbing the equivalent of roughly ¥380mn a year.
That gap is not a discount; in substance it is part of labour cost. Private rents in Kutchan run at ¥1,137/m², above the ¥1,065 for Hokkaido as a whole. The rental market is tight despite this being a rural town, so making staff secure housing at market prices would cost the operator its competitiveness in recruitment. The structure in which the operator absorbs the gap has evidently become entrenched. How that burden feeds back into turnover and operational continuity is a question we have examined separately from the business-case side, in an analysis of hotel staff housing and workforce infrastructure investment.
Vacant homes are no substitute — most resort vacancies are holiday houses
“Resorts have high vacancy rates, so convert the existing stock into staff housing” looks like a natural idea. Open the vacancy breakdown in the Housing and Land Survey, however, and the premise falls apart.
Karuizawa, Nagano has one of the highest vacancy rates in Japan at 70.4% — but of its 28,460 total dwellings, 17,940 are secondary homes (holiday houses), and only 310 vacant dwellings are available for rent. Atami, Shizuoka likewise shows 11,730 secondary homes against a 53.4% vacancy rate. These are assets their owners continue to hold; they never reach the rental market.
In Kutchan, of 1,730 vacant dwellings, 550 are for rent and 420 are secondary homes. The town’s 690 units of employer-provided housing exceed the 550 vacant rental dwellings. Even if every vacant rental dwelling in the town were converted to staff housing, it would not replace the existing employer-provided housing stock. Statistically, the option of meeting dormitory demand by procuring from the market is already closed.
| Municipality | Total dwellings | Vacancy rate | Vacant, for rent | Secondary homes | Employer-provided housing | Employer housing ÷ vacant for rent |
|---|---|---|---|---|---|---|
| Kutchan, Hokkaido | 9,150 | 18.9% | 550 | 420 | 690 | 1.25x |
| Karuizawa, Nagano | 28,460 | 70.4% | 310 | 17,940 | 200 | 0.65x |
| Atami, Shizuoka | 39,510 | 53.4% | 4,710 | 11,730 | 500 | 0.11x |
| Toba, Mie | 10,530 | 30.2% | 510 | 490 | 620 | 1.22x |
| Gero, Gifu | 13,500 | 19.7% | 360 | 210 | 810 | 2.25x |
| Ishigaki, Okinawa | 24,630 | 7.4% | 1,150 | 100 | 1,270 | 1.10x |
| Miyakojima, Okinawa | 29,960 | 15.2% | 1,640 | 240 | 1,370 | 0.84x |
| Furano, Hokkaido | 11,000 | 16.4% | 990 | 50 | 360 | 0.36x |
The cost of building — dormitories at ¥281,000/m², 47% of lodging buildings
If it cannot be procured from the market, it has to be built. The Ministry of Land, Infrastructure, Transport and Tourism’s “Statistics on Building Construction Starts” tabulates planned construction cost and floor area by building use, which allows us to track unit costs for “quasi-residential buildings for living (dormitories, boarding houses, etc.)” — the category corresponding to staff housing.
| Lodging buildings | ¥591,000/m² (¥1.955mn/tsubo) |
| Dormitories etc. (quasi-residential for living) | ¥281,000/m² (¥927,000/tsubo) |
| Residential buildings | ¥249,000/m² (¥825,000/tsubo) |
Unit costs for dormitory-type buildings rose +29.3% in five years, from ¥217,000/m² in 2019 to ¥281,000/m² in 2024. Over the same period, lodging buildings rose +62.4%, from ¥364,000/m² to ¥591,000/m². The increase for staff housing is mild next to guest rooms, but it is still enough that a project budget built on older assumptions will come up short.
| Location | Residential land price | Building cost | Land cost | Total per unit | vs one hotel room (40 m² GFA) |
|---|---|---|---|---|---|
| Kutchan Kita 7-jo Nishi (northern town) | ¥35,000/m² | ¥16.15mn | ¥2.02mn | ¥18.17mn | 77% |
| Kutchan Minami 3-jo Higashi (town centre) | ¥67,000/m² | ¥16.15mn | ¥3.86mn | ¥20.01mn | 85% |
| Niseko Hirafu 5-jo 3-chome | ¥200,000/m² | ¥16.15mn | ¥11.52mn | ¥27.67mn | 117% |
The bottom row is the one to note. Build staff housing at Niseko Hirafu residential land prices and the total per unit exceeds the building cost of one hotel room. Because staff housing, unlike a guest room, generates no revenue, the higher land prices climb in the resort core, the further out staff housing is pushed. That arithmetic is why staff housing in Kutchan sits away from the resort centre.
The order of magnitude is 6–14% of project cost — a sensitivity analysis
So how much does staff housing add to a resort hotel’s development budget? Start from Kutchan’s actual figures. The town has 690 units of employer-provided housing against 5,596 guest rooms in lodging facilities — 12.3 units per 100 rooms. That employer-provided housing also includes stock held by the municipal office, construction firms, retailers and other non-lodging employers, so it does not represent the requirement of the lodging sector alone. Below, 12.3 units is taken as the central case, with 8 and 16 units as the low and high cases.
| Housing required (per 100 rooms) | Cost, northern town location | Cost, town centre location | Hotel building cost | Share of project cost |
|---|---|---|---|---|
| 8 units (low case) | ¥145mn | ¥160mn | ¥2.365bn | 6.1–6.8% |
| 12.3 units (Kutchan actual equivalent) | ¥223mn | ¥246mn | ¥2.365bn | 9.4–10.4% |
| 16 units (high case) | ¥291mn | ¥320mn | ¥2.365bn | 12.3–13.5% |
At the central case, about 10% of project cost goes to staff housing. For a 100-room resort hotel that is ¥223–246mn, equivalent to roughly 10 guest rooms. Even the low case carries 6%, and the high case exceeds 13%. If that cost is not built into the design stage, the question of “what do we do about staff housing” lands from outside the funding plan after construction has begun.
On top of that, the rent gap described in the previous section persists for the entire operating life. Running 12.3 units at Kutchan’s level (¥545,000 per unit per year) costs about ¥6.7mn a year. This is a fixed cost that pushes GOP down directly and, like municipal differences in operating costs such as water and sewerage, belongs in the comparison at the site-selection stage.
Initial investment: 6–14% of project cost
¥150–320mn for 100 rooms, equivalent to 10 guest rooms. The site must be secured separately from the hotel site, and rising land prices push it further out. There is room to build this into the project budget from the early design stage.
Operating phase: a ¥545,000 gap per unit per year
The gap against market rent is ¥789/m² per month in Kutchan — about ¥6.7mn a year in fixed cost for 12.3 units. It is hard to cut because it is tied directly to recruitment competitiveness, which makes it worth factoring into location comparisons.
Site decision: whether a commuting catchment exists
Tourism intensity and the employer-provided housing ratio correlate at 0.86. The larger the room count relative to housing stock, the heavier the housing burden. Destinations with an everyday population nearby — Beppu, Nago — stay close to the national average.
Two-axis sensitivity — nine combinations of unit count and housing location
Table 5 looked at two locations, the northern town and the town centre. Where to secure the housing site is the operator’s decision, and land prices between standard sites within Kutchan differ by as much as 5.7 times. Crossing the unit requirement (8, 12.3, 16 units) with the housing location (the three standard sites in Table 4) gives nine combinations, and makes the range of the burden immediately visible.
| Units required (per 100 rooms) | Northern town ¥18.17mn/unit | Town centre ¥20.01mn/unit | Niseko Hirafu ¥27.67mn/unit |
|---|---|---|---|
| 8 units (optimistic, low case) | ¥145mn 6.1% | ¥160mn 6.8% | ¥221mn 9.4% |
| 12.3 units (central, Kutchan actual equivalent) | ¥223mn 9.4% | ¥246mn 10.4% | ¥340mn 14.4% |
| 16 units (pessimistic, high case) | ¥291mn 12.3% | ¥320mn 13.5% | ¥443mn 18.7% |
The 6–14% cited in the text is the range across the six combinations for the northern-town and town-centre locations (6.1–13.5%). Securing a housing site at Niseko Hirafu residential land prices pushes it up to 9.4–18.7%, but as Table 4 shows, the total per unit at that location exceeds the building cost of one hotel room — so it reads better as an upper bound than as a realistic option. Conversely, even the optimistic case (8 units, northern town) carries 6.1%, which means a business plan that puts staff housing at zero does not stand up under any combination.
The larger sensitivity is location, not unit count. Doubling the unit count from 8 to 16 roughly doubles the ratio, but at the same 12.3 units, moving the location from the northern town to Hirafu alone swings it from 9.4% to 14.4% — a factor of 1.5. That is the economic case for identifying candidate housing sites at the same time as the hotel site, in the sequence of land acquisition.
Frequently asked questions
Q. What exactly counts as employer-provided housing?
A. Housing owned or managed by the employer — a company, government office or organisation — and occupied by the employee for work reasons or as part of remuneration. Company apartments and public-servant housing fall into this category. It also includes cases where the employer or employing company rents ordinary housing on the market and the employee lives there, whether or not rent is paid (Ministry of Internal Affairs and Communications, “2023 Housing and Land Survey: Explanation of Terms”).
Q. Why do the employer-provided housing ratios for Hakuba and Onna not appear in the text?
A. The municipal tabulation of the Housing and Land Survey covers 1,283 areas, and Hakuba, Nagano and Onna, Okinawa are not among them. Because no municipal figures exist, this article presents only the prefectural values (Nagano 2.07%, Okinawa 1.86%) and does not construct municipal values by estimation.
Q. Where do the construction unit costs for staff housing come from?
A. They are derived from the tabulation by building use in the Ministry of Land, Infrastructure, Transport and Tourism’s “Statistics on Building Construction Starts”, dividing planned construction cost by floor area for “quasi-residential buildings for living (dormitories, boarding houses, etc.)”. The 2024 nationwide figure is ¥280,500 per m² (¥927,000 per tsubo). Lodging buildings in the same year came to ¥591,300 per m².
Q. Resorts have plenty of vacant homes — why build new staff housing?
A. Because most vacant homes in resort areas are secondary homes (holiday houses) and never reach the rental market. In Karuizawa, 17,940 of 20,030 vacant dwellings are secondary homes, and only 310 are available for rent. In Kutchan, 550 vacant rental dwellings sit against 690 existing units of employer-provided housing, so converting every vacant unit on the market would still not replace the current stock.
Q. How is the 6–14% share of project cost calculated?
A. The hotel building cost is set at 100 rooms × 40 m² GFA × ¥591,300/m² = ¥2.365bn, staff housing at ¥18.17mn per unit (northern town) to ¥20.01mn per unit (town centre), multiplied by requirements of 8, 12.3 and 16 units. The 12.3 figure is an actual-equivalent derived from Kutchan’s 690 employer-provided dwellings ÷ 5,596 guest rooms × 100, but employer-provided housing includes stock held by employers outside the lodging sector. This is a simplified estimate excluding land acquisition, design and supervision fees, and furniture, fixtures and equipment.
Methodology and sources
Figures for employer-provided housing, private rental housing and vacant dwellings were compiled from e-Stat data for the Ministry of Internal Affairs and Communications’ “2023 Housing and Land Survey: Basic Tabulation on Dwellings and Households” (reference date 1 October 2023; released 25 September 2024). The denominator for the employer-provided housing ratio is occupied dwellings; the denominator for the vacancy rate is total dwellings. National rankings cover the 1,210 municipalities with 1,000 or more total dwellings among the 1,283 areas in the municipal tabulation, excluding prefectural totals, the national total and city totals for ordinance-designated cities. Rents use the “monthly rent per square metre of total floor area (rented dwellings, exclusively residential)” series, excluding zero-rent cases.
Unit construction costs were calculated from the tabulation by use and by client (client total) in the Ministry of Land, Infrastructure, Transport and Tourism’s “Statistics on Building Construction Starts”, dividing planned construction cost (¥10k) by total floor area (m²). Land prices come from the Official Land Price Survey and Prefectural Land Price Survey data in the Ministry’s “Real Estate Information Library”: the 2026 Official Land Price Survey (valuation date 1 January 2026) for Kutchan and Hakuba, and the 2025 Prefectural Land Price Survey (valuation date 1 July 2025) for Onna, which has no standard site in the Official Land Price Survey.
Facility and room counts were extracted by location description from the facility master maintained by MetroEngines Research & Consulting. Estimated settled ADR is the company’s own aggregation; from August 2026 onward it is an estimate based on selling prices published as of the time of the survey, and is subject to change.
⚠ A note on the estimates: The staff housing cost estimates in this article are simplified calculations using averages from public statistics. Actual staff housing unit costs vary widely with specification, structure, location and scale, and the estimates exclude land acquisition, site preparation, design and supervision fees, furniture, fixtures and equipment, and pre-opening costs. The 12.3-unit requirement is a reference value derived from all-industry employer-provided housing in Kutchan and does not indicate the requirement for any individual hotel. An investment decision requires a property-specific feasibility study.
Related reading
- Niseko’s Top Tier: Just 2 Hotels, 75 Rooms — Where Fairmont’s 165 Fit
- Japan Hotels: 1,968 Skilled Foreign Workers, 1.55 per 1,000 Rooms
- Hakodate Station Land +10.3%, Goryokaku Flat: 226 Hotels, 11,449 Rooms
- Matsumoto ADR ¥13,400 vs ¥18,300 Ceiling: Absorbing 222 New Rooms
- Hotel Water & Sewer Costs Vary 2.1x by Municipality: ¥7.85mn NOI Gap
- Leasehold Hotel Development: 1.38x Land Price Reach Across 9 Markets
- Snow as Cost or Asset: Winter RevPAR 53% vs Winter ADR 2.66x
References and sources
■ Government statistics and public data
- Statistics Bureau, Ministry of Internal Affairs and Communications, “2023 Housing and Land Survey” — survey results (Basic Tabulation on Dwellings and Households, released 25 September 2024) (e-Stat tables 0004021424 / 0004021421 / 0004021492)
- Statistics Bureau, Ministry of Internal Affairs and Communications, “2023 Housing and Land Survey: Explanation of Terms” (PDF) — definitions of employer-provided housing and of non-dwelling buildings in which people live
- e-Stat, “Statistics on Building Construction Starts: by use and by client / number of buildings, floor area, planned construction cost” (table ID: 0003114490)
- Ministry of Land, Infrastructure, Transport and Tourism, “Real Estate Information Library” — Official Land Price Survey and Prefectural Land Price Survey
■ Data sources
Counts of employer-provided dwellings and occupied dwellings, the vacancy breakdown and monthly rent per m² of total floor area were compiled from e-Stat tables 0004021424 / 0004021421 / 0004021492 of the Ministry of Internal Affairs and Communications’ “2023 Housing and Land Survey: Basic Tabulation on Dwellings and Households” (reference date 1 October 2023; final figures released 25 September 2024). Unit construction costs are planned construction cost ÷ floor area from the by-use, by-client tabulation of the Ministry of Land, Infrastructure, Transport and Tourism’s “Statistics on Building Construction Starts” (table ID 0003114490). Land prices come from the Ministry’s “Real Estate Information Library”: the Official Land Price Survey (Kutchan and Hakuba = 2026) and the Prefectural Land Price Survey (Onna = 2025, as no standard site is set in the Official Land Price Survey). Facility counts, room counts and estimated settled ADR are aggregated data from MetroEngines Research & Consulting (Kutchan N=428 facilities, Hakuba N=1,025 facilities, Onna N=386 facilities).
■ Estimation assumptions
Total floor area of 57.58 m² per housing unit (the actual average per employer-provided dwelling in Kutchan); construction cost of ¥280,500/m² (2024, nationwide, dormitories etc.); site area assumed equal to total floor area (two storeys, equivalent to a 100% floor-area ratio). The hotel is 100 rooms at 40 m² GFA per room and ¥591,300/m², giving a building cost of ¥2.365bn. The unit requirement is centred on Kutchan’s 690 employer-provided dwellings ÷ 5,596 guest rooms × 100 = 12.3 units, with 8 units as the optimistic case and 16 as the pessimistic case. The two-axis sensitivity in Table 6 simply crosses the three standard sites in Table 4 with the building cost in Table 5, adding no new assumptions. The denominator of “share of project cost” is the ¥2.365bn hotel building cost.
■ Limitations and caveats
(1) The employer-provided housing ratio is a lower bound counting only unit-type company housing. Single-person dormitories and similar “non-dwelling buildings in which people live” (9,300 company dormitories and boarding houses nationwide) are not included, so actual staff accommodation capacity is larger. (2) The 12.3-unit requirement is a reference value derived from all-industry employer-provided housing in Kutchan, not the requirement of the lodging sector alone. (3) Hakuba and Onna are not included in the municipal tabulation of the Housing and Land Survey (1,283 areas), so prefectural values are used as substitutes and no municipal values have been estimated. (4) The staff housing cost estimates are simplified calculations using averages from public statistics and exclude land acquisition (for the hotel site), site preparation, design and supervision fees, furniture, fixtures and equipment, and pre-opening costs. Actual unit costs vary widely with specification, structure and scale. (5) Estimated settled ADR is an estimate and differs from actual transacted rates and accounting figures. An investment decision requires a property-specific feasibility study.
■ Market data
- MetroEngines Research & Consulting — facility and room counts (Kutchan N=428 facilities, Hakuba N=1,025 facilities, Onna N=386 facilities), estimated settled ADR