

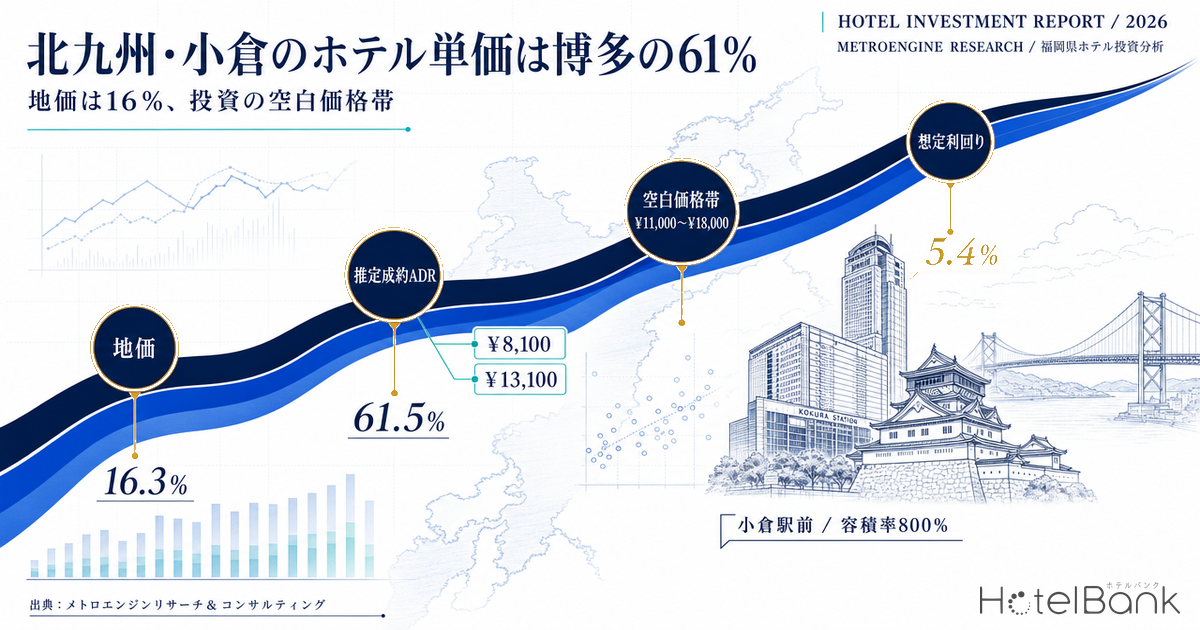
Fukuoka Prefecture is home to two government-designated cities: Fukuoka City, with a population of roughly 1.66 million, and Kitakyushu City, with roughly 920,000. As lodging markets, these two cities sit inside the same prefecture yet operate on entirely different price structures. According to MetroEngines Research, the estimated settled ADR in Kokurakita Ward — the heart of Kitakyushu — stood at ¥8,100 as of July 2026, just 61.5% of the ¥13,100 recorded in Hakata Ward that same month. Meanwhile, the published land price for commercial sites in front of Kokura Station is 16.3% of the level around Hakata Station. Six-tenths of the revenue, one-sixth of the land cost — this asymmetry is the crux of the argument for any investor weighing the acquisition or development of a mid-scale hotel in Kyushu.
HotelBank’s previous coverage of Fukuoka Prefecture has concentrated on Fukuoka City (Hakata and Tenjin). This article instead takes Kitakyushu City head-on as an investment subject. It quantifies the structure of two government-designated cities coexisting within a single prefecture, using estimated settled ADR and room-level inventory depletion data, and identifies exactly where the gap in the price ladder lies. Our intended readers are investors considering the acquisition of mid-scale assets and asset managers designing the repositioning of existing properties.
Metric Definitions Used in This Article
- ADR (Average Daily Rate): An estimated settled rate (tax-excluded equivalent) calculated by applying a property-type correction coefficient to the lowest published plan rate each property lists on OTAs (double occupancy, per-room rate, tax-included). Cross-checked against property-level results disclosed by listed hotel REITs (91 properties, most recent three months), the median error is approximately 7%. These are estimates and differ from each property’s actual transacted rates and accounting figures. Area-level ADR is the median across the properties covered (the level of a typical property in that area).
- Published price: The average price across all plans listed on OTAs (double occupancy, per-room, tax-included). This is a separate metric from ADR.
- LT (lead time): Days remaining until the check-in date. LT0 = same day.
- Early sell-out LT: The lead time at which remaining rooms first reached zero. A larger value indicates an earlier sell-out.
- Data source: MetroEngines Research & Consulting
- — Kokurakita Ward’s estimated settled ADR is ¥8,100, or 61.5% of Hakata Ward’s ¥13,100 (as of July 2026; Kokurakita N=29 properties, Hakata N=148 properties). Year on year, Kokurakita rose just +0.6% against Hakata’s +4.8% — the gap is not closing.
- — Commercial land around Kokura Station costs 16.3% of land around Hakata Station. Add a floor-area ratio of 800% versus 600%, and the land burden per square metre of gross floor area falls to 12.2% — one-eighth.
- — Only 3 properties (15% of the sample) occupy the ¥11,000–¥18,000 band in Kokurakita Ward. Against 38% in Hakata Ward and 51% in Chuo Ward, this is the widest divergence — and the whitespace this article identifies.
- — A development scenario aimed at that empty band yields 5.4–6.1%. A scenario that simply tracks today’s rate level yields 3.3–3.7% — no better than Hakata (3.2–3.5%). Cheap land only pays off once the rate is raised.
- — Even a downside of ADR −10% combined with occupancy −5pt still secures 4.5%. In the two-axis ADR × occupancy sensitivity grid, all 25 cells exceed Hakata’s market level (3.2%), and even the most conservative combination — 70% occupancy (full-year) at ¥11,000 — holds 3.7%.
Kokurakita’s Estimated Settled ADR Is 61.5% of Hakata’s — and the Gap Is Not Closing
Start with the absolute level. Lining up MetroEngines Research’s estimated settled ADR by month, the gap between Kokurakita Ward and Hakata Ward is not a temporary phenomenon but a structural difference that holds steady through the year. In July 2026, Kokurakita stood at ¥8,100 (N=29 properties), Hakata at ¥13,100 (N=148 properties), and Chuo Ward (Tenjin) at ¥13,800 (N=83 properties).
What matters is the direction of travel. Year on year, Hakata Ward gained +4.8%, Chuo Ward +1.2%, and Kokurakita Ward +0.6%. In other words, while the Fukuoka City side has been stacking up rate, Kokurakita has moved roughly sideways. The gap is not narrowing — it is widening, gently. That said, this is not a story about Kokura being weak. As shown below, Kokurakita’s estimated settled ADR from September onward climbs to ¥9,300–¥10,500, so the price band itself has started to move.
Source: MetroEngines Research & Consulting (Kokurakita N=28–30 properties, Hakata N=138–149 properties)
Figures from September 2026 onward are estimates based on rate levels published at the time of the survey, and they will move as the check-in date approaches. Even so, the fact that Kokurakita is on track to trade in a ¥9,300–¥10,500 range from September through December is itself a clear break from the prior year, when the ward was pinned in the ¥8,000s.
Land at 16.3% of Hakata, With an 800% vs 600% Floor-Area Ratio — an Asymmetry in Investment Terms
Sitting at 60% of the revenue level is not, by itself, an investment case. What decides the matter is how much capital must be committed to generate that revenue. Extracting land price data from the Ministry of Land, Infrastructure, Transport and Tourism’s Real Estate Information Library (2025 Official Land Price Survey and Prefectural Land Price Survey) for the areas around Kokura Station and Hakata Station respectively, the asymmetry in terms comes through sharply.
| Item | Around Kokura Station | Around Hakata Station | Kokura / Hakata |
|---|---|---|---|
| Commercial land price (median) | ¥588,000/㎡ | ¥3,610,000/㎡ | 16.3% |
| Land price at the closest-to-station point (highest) | ¥1,160,000/㎡ | ¥8,100,000/㎡ | 14.3% |
| Land price change YoY (median) | +4.9% | +10.6% | — |
| Floor-area ratio, commercial land by the station | 800% | 600% | 1.33x |
| Zoning designation | Commercial zone | Commercial zone | — |
| Land burden per ㎡ of gross floor area | ¥73,500 | ¥601,700 | 12.2% |
Source: Compiled by MetroEngines Research & Consulting from the Ministry of Land, Infrastructure, Transport and Tourism Real Estate Information Library (2025 Official Land Price Survey and Prefectural Land Price Survey; commercial sites around each station, N=12 points each)
Commercial land in front of Kokura Station is designated at a floor-area ratio of 800% and a building coverage ratio of 80%, above the 600% applied east of Hakata Station. Land costs one-sixth as much, and the same site area supports more gross floor area. Restated as land burden per square metre of gross floor area, Kokura is 12.2% of Hakata — one-eighth. Land price growth is also gentler in Kokura at +4.9% against Hakata’s +10.6%, which means the terms differ on acquisition timing as well.
Positioning Analysis — Only 3 Properties Sit in the ¥11,000–18,000 Band in Kokurakita
This is the core of the article. We plotted individual properties across the three wards on estimated settled ADR (vertical axis) against average early sell-out LT (horizontal axis), the latter a measure of room-level inventory depletion speed. The sample covers properties whose inventory movement could be observed for the seven check-in nights from 17 to 23 August 2026 and whose OTA-published allocation is at least 30% of total rooms: Kokurakita N=20 properties, Hakata N=39, Chuo N=51 (three properties with an estimated settled ADR below ¥3,000 or above ¥40,000 are excluded from the display).
Source: MetroEngines Research & Consulting (Kokurakita N=20, Hakata N=39, Chuo N=51 properties; bubble size = room count)
The structure the scatter reveals is unambiguous. Kokurakita’s properties cluster tightly in the ¥5,000–¥10,000 band, with 15 of 20 falling inside it. Hakata and Chuo, by contrast, fight their main battle in the ¥9,000–¥18,000 range. Sorting property counts by price band makes the skew even plainer.
Source: MetroEngines Research & Consulting (average estimated settled ADR, May–August 2026; Kokurakita N=20, Hakata N=39, Chuo N=51 properties)
Only 3 properties (15% of the sample) occupy the ¥11,000–¥18,000 band in Kokurakita Ward. Hakata has 15 (38%) and Chuo 26 (51%) in the same band. Upper-midscale and lifestyle formats form the core of the market on the Fukuoka City side, whereas in Kokurakita that tier is all but absent. This is the whitespace this article identifies. For comparison, our reading of the price-band structure in other Kyushu prefectures using the same estimated settled ADR × early sell-out LT framework is set out in Miyazaki & Saga Hotel Investment Whitespace.
Crowded band: ¥5,000–¥10,000
15 of Kokurakita’s 20 properties. Dominated by limited-service formats, with little room to differentiate on price. This is where an existing property’s own strengths count for most.
Empty band: ¥11,000–¥18,000
Just 3 properties in Kokurakita (15%). The widest divergence against Hakata’s 38% and Chuo’s 51%. Thin capacity for upper-midscale and lifestyle formats.
Upper band: ¥18,000 and above
One property in Kokurakita. Served by an existing full-service hotel; building up from the empty band is more realistic than entering here directly.
Inventory Depletes More Slowly Than in Hakata — 24.1pt vs 32.8pt From LT90 to LT47
An empty price band is only worth filling if the demand is there. To test how tight supply and demand actually are, we tracked room-level inventory movement. For check-in on Friday 16 October 2026, we indexed remaining rooms at LT90 to 100 and followed the depletion path. The sample covers 31 properties and 5,101 rooms in Kokurakita Ward, and 218 properties and 22,973 rooms in Hakata Ward.
Source: MetroEngines Research & Consulting (check-in 16 October 2026; Kokurakita N=31 properties / 5,101 rooms, Hakata N=218 properties / 22,973 rooms)
Between LT90 and LT47 (the survey date for this article), Kokurakita depleted 24.1pt of its remaining inventory against Hakata’s 32.8pt. Hakata moves faster. Kokurakita, in other words, is not a market where inventory tightens 90 days out. Lifting the rate a notch there calls for identifying the specific nights that can carry a higher price and building a rate ladder around them, rather than pushing the whole year up at once.
Those nights do exist. Over the same 17–23 August 2026 window, the fastest-selling property in Kokurakita sold out on all seven nights, with an average early sell-out LT of 42.1 days (a 55-room property). The runner-up averaged 35.2 days (52 rooms). Within a single week that includes weekdays, there are nights on which mid-scale properties fill more than a month ahead. Even where an area looks unhurried in aggregate, distinct demand peaks are observable at the property level.
Demand Base — Employment Within 1km of Kokura Station Is 29% of Hakata’s, Supply 25%
To test whether the demand to fill that empty band genuinely exists, we start from the fundamentals of location. Comparing a 1km radius around each station using the Statistics Bureau and METI Economic Census for Business Activity, the Kokura Station catchment holds 4,087 establishments and 49,964 employees. Against the Hakata Station catchment (9,758 establishments, 171,730 employees), that is 41.9% on establishments and 29.1% on employment.
| Metric | Kokura Station, 1km radius | Hakata Station, 1km radius | Kokura / Hakata |
|---|---|---|---|
| Establishments | 4,087 | 9,758 | 41.9% |
| Employees | 49,964 | 171,730 | 29.1% |
| Share of office-sector employment | 19.6% | 30.4% | — |
| Lodging properties | 55 | 252 | 21.8% |
| Rooms | 5,723 rooms | 22,906 rooms | 25.0% |
| Rooms per 1,000 employees | 114.6 rooms | 133.4 rooms | 85.9% |
Source: Statistics Bureau of Japan / METI, Economic Census for Business Activity (2021); boundaries from the 2020 Population Census small-area statistics (e-Stat Statistical GIS); lodging supply from MetroEngines Research & Consulting
Demand measured by employment is 29.1% of the Hakata catchment, while room supply is 25.0%. Rooms per 1,000 employees run at 114.6 in Kokura against 133.4 in Hakata, meaning supply density is lower in Kokura. Read plainly, this is not a market with surplus rooms relative to the depth of its business demand. A side-by-side comparison of regional government-designated cities including Kitakyushu, covering five markets, is set out in Hotel Investment in Japan’s “Second-Tier” Cities.
The residential population side is worth checking too. According to the 250m-mesh population projections in the Ministry of Land, Infrastructure, Transport and Tourism’s National Land Numerical Information, the resident population within a 1.5km radius of Kokura Station was 34,529 in 2025, with a working-age share of 65.2%; the 2040 projection is 33,623, or −2.1% against 2025. For the centre of a regional city, that is an exceptionally gentle rate of decline. Kitakyushu City itself has made “evolution into a major tourism city” a priority theme of its FY2025 initial budget, targeting 2.4 million overnight visitors (as reported by Nishinippon Shimbun). Kokura Station is a northern Kyushu interchange where the Shinkansen, conventional lines and the monorail meet.
Distribution of lodging properties within a 1.2km radius of Kokura Station (10 rooms or more, N=55 properties / 5,876 rooms). Bubble size = room count. Source: MetroEngines Research & Consulting
Development Scenario Modelling — 5.4–6.1% Targeting the Empty Band, 3.2–3.5% in Hakata
We now translate everything above into per-room investment cost and income. The assumptions are 35㎡ of gross floor area per room (25㎡ guestroom plus common areas), 80% occupancy (full-year basis; 82% for Hakata), ancillary revenue at 15% of rooms revenue, and a 35% GOP margin. Construction cost starts from the per-tsubo level for hotel-use buildings in the Ministry of Land, Infrastructure, Transport and Tourism’s Statistics on Building Construction Starts (the 2024 national average was ¥1.95m per tsubo), with a midscale assumption of ¥2.3m per tsubo (¥695,700/㎡). Land is derived from the commercial median and floor-area ratio shown above.
Construction cost is presented in two stages. Stage 1 is on a 2025 actual basis; Stage 2 builds in inflation over the construction period, assuming a 2029 opening with a construction mid-point in 2028 and compounding annual rates of +5.3% / +5.0% / +4.5% (Turner & Townsend forecast), giving a factor of 1.155.
| Item | A. Kokura, empty band | B. Kokura, current level | C. Hakata, market level |
|---|---|---|---|
| Assumed ADR (tax-excluded equivalent) | ¥14,000 | ¥8,500 | ¥13,100 |
| Assumed occupancy | 80% | 80% | 82% |
| Land (per room) | ¥2.6M | ¥2.6M | ¥21.1M |
| Construction cost, Stage 1 (2025 actual) | ¥24.4M | ¥24.4M | ¥24.4M |
| Total investment, Stage 1 | ¥26.9M | ¥26.9M | ¥45.4M |
| GOP (per room, per year) | ¥1.65M | ¥1.00M | ¥1.58M |
| Yield, Stage 1 | 6.1% | 3.7% | 3.5% |
| Total investment, Stage 2 (post-inflation) | ¥30.7M | ¥30.7M | ¥49.2M |
| Yield, Stage 2 | 5.4% | 3.3% | 3.2% |
| Payback period, Stage 2 | 19 years | 31 years | 31 years |
Source: Compiled from the Ministry of Land, Infrastructure, Transport and Tourism’s Statistics on Building Construction Starts and Real Estate Information Library, and MetroEngines Research & Consulting. This is a simplified model; an actual investment decision requires a detailed feasibility study.
The conclusion is simple. Build in Kokura at today’s rate level (Scenario B) and the yield lands in the 3% range — much the same as Hakata. The advantage of cheap land is cancelled out by the low rate. The advantage only comes alive when the ¥11,000–¥18,000 empty band is the target (Scenario A). Only then does the yield clear 5% and the payback period compress from 31 years to 19. Cheap land is not itself the opportunity; the opportunity is that cheap land lets you attempt a higher rate with limited downside.
The sensitivity analysis preserves that structure. Taking Scenario A (Stage 2) as the base, a 10% ADR cut to ¥12,600 still yields 4.8%, a 5pt occupancy cut to 75% yields 5.0%, and both together yield 4.5% — all above the Hakata market-level scenario (3.2%). Even where the assumed ADR is not achieved as planned, the light land burden absorbs the downside.
| Sensitivity scenario (A, Stage 2) | ADR | Occupancy | GOP | Yield |
|---|---|---|---|---|
| Base case | ¥14,000 | 80% | ¥1.65M | 5.4% |
| ADR −10% | ¥12,600 | 80% | ¥1.48M | 4.8% |
| Occupancy −5pt | ¥14,000 | 75% | ¥1.54M | 5.0% |
| Both | ¥12,600 | 75% | ¥1.39M | 4.5% |
Source: Compiled by MetroEngines Research & Consulting (simplified model)
A one-dimensional sensitivity analysis only shows what happens when ADR or occupancy moves on its own. Real downside hits both at once. Taking Scenario A (Stage 2, total investment ¥30.7M per room) as the base, the grid below flexes assumed ADR and assumed occupancy (both full-year) along two axes. Dark blue marks the base case; light blue marks the region yielding 5% or more.
| Yield | ADR ¥11,000 | ADR ¥12,600 | ADR ¥14,000 | ADR ¥15,400 | ADR ¥17,000 |
|---|---|---|---|---|---|
| Occupancy 70% (full-year) | 3.7% | 4.2% | 4.7% | 5.2% | 5.7% |
| Occupancy 75% (full-year) | 3.9% | 4.5% | 5.0% | 5.5% | 6.1% |
| Occupancy 80% (full-year) | 4.2% | 4.8% | 5.4% | 5.9% | 6.5% |
| Occupancy 85% (full-year) | 4.5% | 5.1% | 5.7% | 6.3% | 6.9% |
| Occupancy 90% (full-year) | 4.7% | 5.4% | 6.0% | 6.6% | 7.3% |
Yield = GOP ÷ total investment (per room). GOP = ADR × occupancy × 365 × 1.15 (ancillary revenue) × 0.35 (GOP margin). Total investment is fixed at the Stage 2 figure of ¥30.7M per room (after applying the 1.155 inflation factor). Source: Compiled by MetroEngines Research & Consulting (simplified model)
What the grid shows is the range over which this opportunity holds up. Even the most conservative combination — ADR ¥11,000, the bottom of the empty band, at 70% full-year occupancy — returns 3.7%, above Hakata’s market level of 3.2%. Conversely, if ADR fails to reach ¥11,000 and stays near today’s ¥8,500, the yield tops out in the high 3% range even at 90% occupancy (Scenario B above). What decides this investment is ADR, not occupancy — evident in the fact that the gradient across the columns (ADR) is steeper than the gradient down the rows (occupancy).
Repositioning Existing Assets: The Second Way In
New development is not the only option. In Kitakyushu’s case, redeploying the existing stock is arguably the more realistic entry point. Within the scope MetroEngines Research covers, Kitakyushu City has 184 properties and 10,976 rooms in operation (of which 55 properties and 5,876 rooms sit within 1.2km of Kokura Station). Against Fukuoka City’s 779 properties and 48,572 rooms, that is 23.6% on properties and 22.6% on rooms.
New supply is being added slowly. On an OTA-listing basis, properties confirmed to have opened since 2023 total 15 properties and 884 rooms in Kitakyushu City, against 78 properties and 2,255 rooms in Fukuoka City. Of Kitakyushu’s 884 rooms, 809 are concentrated in 2023, with only small increments from 2024 onward. That said, OTA listings appear only a few months before opening, so recent months may still grow as further listings appear — a caveat worth applying when reading these figures.
Looking at grade composition, only 5 of the 55 properties within 1.2km of Kokura Station are upper-midscale or above. The ¥11,000–¥18,000 empty band does not have to be filled by new build alone. Redesigning guestroom specification, breakfast and common areas at an existing mid-scale property (50–150 rooms) to lift the rate ladder one step is a workable move in this territory. With no land acquisition involved, the capital deployed is a fraction of a new development. Existing business hotels in Kokura and Kurosaki also compete for extended-stay demand, and we have compiled the rates they offer property by property in separate coverage of the Kitakyushu long-stay market.
Several tailwinds support a move into this band. Fukuoka Prefecture’s room occupancy came in at 72.6% for 2025, third-highest nationally and well above the national average of 61.8% (Japan Tourism Agency, Overnight Travel Statistics Survey, 2025). Prefecture-wide demand is deep. Kitakyushu City has additionally set an explicit target of 2.4 million overnight visitors and is pursuing large-event attraction at the West Japan General Exhibition Center and the promotion of its night-time economy as policy. Event-night demand peaks show up in the inventory data above, and the 42.1-day average early sell-out LT recorded by a mid-scale property bears that out.
Risk Factors and the Next Steps to Verify
| Risk | Description | What to check |
|---|---|---|
| Demand in the price band | We cannot rule out that the band is thin because the demand is not there | Daily inventory depletion at the three existing upper-band properties, plus price response on corporate-contract and event nights |
| Evenness of demand | Depletion from LT90 is slower than Hakata’s (24.1pt vs 32.8pt) | Demand peaks and troughs by day of week and event date. How many nights a year can be designed as high-rate nights |
| Construction cost | Assumes +15.5% by 2028 against 2025. Any overshoot lowers the yield | Contractor capacity and prevailing unit rates across Kyushu. Conversely, rising costs also restrain new supply |
| Demographics | The 1.5km station catchment declines just −2.1% by 2040 against 2025, but the city as a whole keeps shrinking | Whether growth in visitor population (Shinkansen, events, Kanmon tourism) outpaces the fall in residents |
| Exit | Government-designated city status notwithstanding, the investor base is thinner than Fukuoka City’s | NOI growth over the holding period, and whether land price growth (+4.9%) is sustained |
Source: Compiled by MetroEngines Research & Consulting
Conclusion — How to Use the Asymmetry Between Two Designated Cities in One Prefecture
Fukuoka Prefecture’s two government-designated cities sit inside the same prefecture on entirely different investment terms. Kokurakita Ward’s estimated settled ADR is 61.5% of Hakata Ward’s, but its land price is 16.3% and its land burden per square metre of gross floor area just 12.2%. That asymmetry means the downside on attempting to build rate is small.
The most important finding, though, is structural: the ¥11,000–¥18,000 price band holds only 3 properties (15%) in Kokurakita Ward, against a concentration of 38% in Hakata and 51% in Chuo. Track today’s rate level and the yield stays in the 3% range, no different from Hakata. Only by targeting the empty band does 5.4–6.1% come into view — and even with downside applied in the sensitivity analysis, 4.5% is secured.
The next thing to verify is how many nights a year that band can actually be filled. Area-wide inventory depletion is slower than Hakata’s, but at the property level an average early sell-out LT of 42.1 days is on the record. Mapping the year’s demand peaks night by night, and determining whether a rate ladder can be designed around them, is what will decide whether this opportunity converts into actual income.
⚠ Note on ADR for future dates: ADR figures for September 2026 onward in this article are estimates based on selling prices published on OTAs at the time of the survey, and they will move as the check-in date approaches. Current levels will not necessarily be realised as shown. The development scenario modelling is likewise a simplified calculation based on publicly available information; an actual investment decision requires a detailed feasibility study.
Related Reading
- Fukuoka Hotel Supply 2026-2028: ~1,000 Rooms/Year in Hakata & Tenjin
- Miyazaki & Saga Hotel Investment Whitespace: Zero Hotels at ¥18-25k
- Fukuoka Settled ADR +10.9% in H1 2026 While Osaka Falls 32.8% in June
- Hakodate Station Land +10.3%, Goryokaku Flat: 226 Hotels, 11,449 Rooms
- Hotel Investment in Japan’s “Second-Tier” Cities: ADR, Supply & Yield Across 5 Markets
References and Sources
■ Data sources
Monthly estimated settled ADR series, room-level inventory movement and early sell-out LT, and the lodging property master (property counts, room counts, grade composition, opening year) are compiled by MetroEngines Research & Consulting. Land prices, floor-area ratios and zoning are from the Ministry of Land, Infrastructure, Transport and Tourism’s Real Estate Information Library (2025 Official Land Price Survey and Prefectural Land Price Survey; commercial sites around each station, N=12 points each). Establishment and employment counts are from the Statistics Bureau of Japan / METI Economic Census for Business Activity (2021), with boundaries from the 2020 Population Census small-area statistics. Projected population is from the 250m-mesh estimates in the Ministry of Land, Infrastructure, Transport and Tourism’s National Land Numerical Information. Construction costs are from the same ministry’s Statistics on Building Construction Starts and from Turner & Townsend’s International Construction Market Survey.
■ Modelling assumptions
Development scenarios are standardised on a per-room basis: 35㎡ of gross floor area per room (25㎡ guestroom plus common areas), 80% occupancy (full-year basis; 82% for the Hakata scenario only), ancillary revenue at 15% of rooms revenue, and a 35% GOP margin. Construction cost is ¥2.3m per tsubo (¥695,700/㎡); land is derived by dividing the commercial median around each station by the floor-area ratio to restate it per square metre of gross floor area. Stage 1 is on a 2025 actual basis; Stage 2 assumes a 2029 opening with a construction mid-point in 2028, applying a factor of 1.155 to construction cost by compounding annual rates of +5.3% / +5.0% / +4.5%. Yield = GOP ÷ total investment. The positioning scatter covers properties whose inventory movement could be observed for check-in nights from 17 to 23 August 2026 and whose OTA-published allocation is at least 30% of total rooms (three properties with an estimated settled ADR below ¥3,000 or above ¥40,000 are excluded from the display).
■ Limitations and caveats
Estimated settled ADR is an estimate produced by applying a property-type correction coefficient to OTA-published prices; cross-checked against property-level disclosures by listed hotel REITs (91 properties, most recent three months), the median error is approximately 7%. It differs from each property’s actual transacted rates and accounting figures. ADR from September 2026 onward is an estimate based on published rate levels for future dates and will move as the check-in date approaches. The development scenarios are simplified calculations treating only land and construction costs as investment, excluding finance costs, pre-opening expenses, FF&E replacement, management agreement terms and various tax burdens. An actual investment decision requires a detailed feasibility study. Inventory data is based on OTA-published allocations and therefore sits at a different level from actual occupancy, which includes corporate-contract and direct bookings.
■ Market data
- MetroEngines Research & Consulting — estimated settled ADR (monthly series for Kokurakita, Hakata and Chuo wards), room-level inventory movement and early sell-out LT, lodging property master (property counts, room counts, grade composition, opening year)
■ Government statistics and public data
- Ministry of Land, Infrastructure, Transport and Tourism — Real Estate Information Library — Official Land Price Survey and Prefectural Land Price Survey (2025), zoning and floor-area ratios
- Ministry of Land, Infrastructure, Transport and Tourism, Statistics on Building Construction Starts — hotel construction cost per tsubo (2025 actual)
- Ministry of Land, Infrastructure, Transport and Tourism, National Land Numerical Information, “Projected Population by 250m Mesh (R6 National Land Policy Bureau estimates)” — resident population, age composition and 2040 projection within a 1.5km radius of Kokura Station
- Statistics Bureau of Japan / METI, Economic Census for Business Activity (2021); boundaries = 2020 Population Census small-area statistics (e-Stat Statistical GIS) — establishment counts, employment counts, office-sector share
- Kitakyushu City — Kitakyushu Tourism Trends Survey
- Kitakyushu City — Tourism Policy (PDF)
■ Industry reports and press coverage
- Nishinippon Shimbun — “Kitakyushu City targets 2.4 million overnight visitors: ‘evolution into a major tourism city’ a priority theme of the initial budget”
- Fukuoka Prefecture lodging occupancy of 72.6% (full-year 2025), third-highest nationally
- Deloitte Tohmatsu — “Accommodation Market Trends in Japan’s Major Cities, Part 4: Fukuoka”
- Turner & Townsend, International Construction Market Survey — construction cost inflation forecast (2026 +5.3%, 2027 +5.0%, 2028 onward +4.5%)