

When Hokkaido hotel investment comes up, the conversation gravitates toward the high-rate segment in Kutchan and Niseko, redevelopment in Sapporo, or the occupancy-driven assets of Chitose and Tomakomai. Meanwhile, there is remarkably little material that re-counts Donan — southern Hokkaido, the zone centred on Hakodate and stretching through Hokuto and Nanae out to Matsumae, Esashi, Yakumo and Oshamambe — as a single trade area. This report treats those 16 Donan municipalities as one investable market and lays out the supply inventory, settled-ADR estimate, land prices, ground conditions, demographics and listed-REIT ownership, all measured against our internal database and primary public sources.
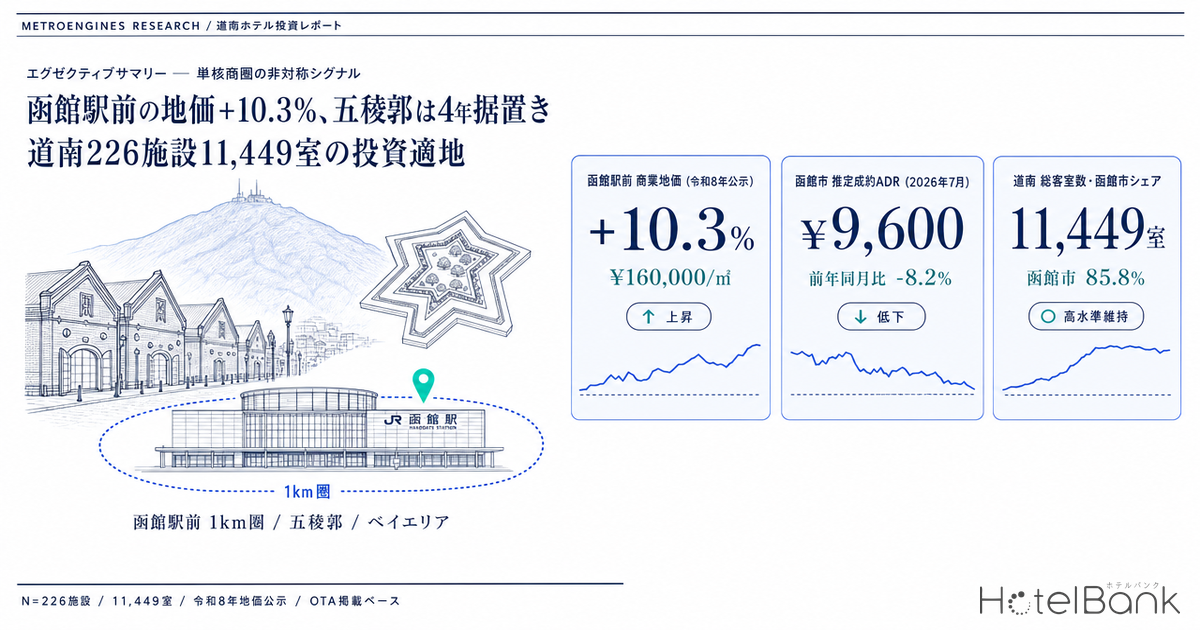
The conclusion first. Donan’s accommodation supply is 226 properties and 11,449 rooms, of which 85.8% sit in Hakodate. On price, the settled-ADR estimate is among the lowest of Hokkaido’s major markets, and the January–July 2026 average ran below the same period a year earlier. On land, however, the FY2026 (Reiwa 8) official land price survey put the commercial site in front of Hakodate Station at ¥160,000/m², up 10.3% year on year — a third consecutive annual rise — while Goryokaku-koen-mae, the highest-priced site in the city, has been frozen at ¥181,000/m² since 2023 (three straight years at 0.0%). The market as a whole is not moving; a single point — the station front — is. That is where Donan hotel investment stands today.
Metric Definitions Used in This Article
- ADR (average daily rate): a settled-rate estimate (tax-exclusive equivalent) derived by applying category-specific adjustment factors to each property’s lowest publicly listed plan on OTAs (double occupancy, per room, tax-inclusive). Cross-checked against property-level results disclosed by listed hotel REITs (N=184 property-months, April–May 2026), the median error is approximately 7%. These are estimates and differ from each property’s actual transacted rates and accounting figures. Area-level ADR is the median across the covered properties (the level of a typical property in that area).
- Listed price: figures explicitly labelled “listed price (all-plan average, tax-inclusive)” are the average of every published plan from room-only through meal-inclusive, and are not settled rates.
- OCC (occupancy): sold rooms as a share of total rooms in the area (an estimate based on OTA sales inventory). This article does not use area-level estimated OCC; it cites only the property-level and portfolio-level actuals disclosed by listed REITs.
- Supply aggregation basis: properties confirmed as listed on OTAs for check-in dates from 19 August to 30 September 2026 are treated as “operating,” and their master-registered room counts are summed. Ryokan, minshuku and simple lodging houses not listed on OTAs are excluded.
- Data sources: MetroEngines Research & Consulting / MLIT Real Estate Information Library / REIT disclosure materials
- — Of 226 properties and 11,449 rooms, Hakodate accounts for 173 properties and 9,818 rooms (85.8%). The other 15 municipalities combined total just 1,631 rooms, so investing in Donan is effectively investing in Hakodate.
- — The commercial site in front of Hakodate Station reached ¥160,000/m², up 10.3% year on year, in the FY2026 survey — a third straight annual rise. Goryokaku-koen-mae, the city’s highest-priced site, has been unchanged for four years (three consecutive years at 0.0%).
- — The settled-ADR estimate for July 2026 was ¥9,600 (N=87 properties), or 53.0% of Sapporo’s Chuo Ward. The January–July 2026 average was down 2.7% year on year, placing Hakodate outside Hokkaido’s rate-growth phase.
- — Listed REITs hold 4 properties and 812 rooms in Donan. Per-room acquisition prices have shifted upward from ¥6.7–13.4mn in 2015 to ¥38.7–45.3mn in 2024–2025.
- — After pricing in construction inflation, GOP yields come to 6.0% and 5.5% for new-build scenarios versus 7.4% for repositioning older stock. There are 2,986 rooms (26.1%) in buildings more than 35 years old.
Executive Summary — 226 Properties, 11,449 Rooms, 85.8% Concentrated in a Single-Core Hakodate Market
Four numbers frame the Donan trade area. First, the single-core nature of supply. Of 226 properties and 11,449 rooms, Hakodate holds 173 properties and 9,818 rooms; adding Hokuto and Nanae brings three municipalities to 93.1% of rooms. The towns of the Hiyama subprefecture — Matsumae, Esashi, Kaminokuni, Imakane — each have only one to four listed properties, with room counts in the double digits. Donan is all but synonymous with the Hakodate market, and the surrounding towns are unlikely to stand alone as investment targets: that is the first fact from the supply side.
Second, record demand. According to the Hakodate City Tourism Department, visitor arrivals in FY2025 reached 6.058 million, a record for the second consecutive year, of which overnight guests numbered 5.043 million, up 6.7% year on year. First-half foreign overnight guests came to 226,000 (up 12% year on year); Taiwan accounts for 47%, while China grew 41% and South Korea 55%. Demand is unambiguously rising.
Third, rates are not following demand. Hakodate’s settled-ADR estimate averaged ¥8,100 over January–July 2026 (N=87 properties), down 2.7% from ¥8,300 a year earlier. Over the same period Hokkaido as a whole moved from ¥9,300 to ¥9,900 (N=952 properties), up 7.3%, meaning Hakodate sits outside the prefecture’s rate-growth phase. Read the other way, it is the major Hokkaido market where an investor can underwrite the lowest entry rate assumption.
Fourth, land price movement at a single point. Only the station front is rising; Goryokaku and Yunokawa Onsen are flat to slightly down. That asymmetry in the price signal dictates where in Donan one should build — or buy. The measured evidence follows.
Supply Inventory — Hakodate Has 173 Properties and 9,818 Rooms; All 15 Other Towns Together Add Only 1,631
For the 16 Donan municipalities (those in the Oshima and Hiyama subprefectures where OTA listings could be confirmed), we counted properties observed as listed for check-in dates from 19 August to 30 September 2026 and summed their master-registered room counts. Fukushima and Okushiri had no confirmable listings in the period and were excluded.
| Municipality | Properties | Rooms | Room share | Avg. size |
|---|---|---|---|---|
| Hakodate | 173 | 9,818 | 85.8% | 56.8 rooms |
| Hokuto | 8 | 471 | 4.1% | 58.9 rooms |
| Nanae | 10 | 375 | 3.3% | 37.5 rooms |
| Yakumo | 8 | 147 | 1.3% | 18.4 rooms |
| Mori | 6 | 135 | 1.2% | 22.5 rooms |
| Shikabe | 2 | 120 | 1.0% | 60.0 rooms |
| Esashi | 4 | 70 | 0.6% | 17.5 rooms |
| Setana | 2 | 65 | 0.6% | 32.5 rooms |
| Assabu | 3 | 64 | 0.6% | 21.3 rooms |
| Kikonai | 2 | 56 | 0.5% | 28.0 rooms |
| Otobe | 2 | 46 | 0.4% | 23.0 rooms |
| Matsumae | 1 | 28 | 0.2% | 28.0 rooms |
| Shiriuchi | 1 | 26 | 0.2% | 26.0 rooms |
| Kaminokuni | 2 | 15 | 0.1% | 7.5 rooms |
| Imakane | 1 | 13 | 0.1% | 13.0 rooms |
| Oshamambe | 1 | — | — | rooms unknown |
| Donan 16 municipalities, total | 226 | 11,449 | 100% | 50.9 rooms |
On size structure, 18 properties of 200 rooms or more hold 4,905 rooms (42.8% of all rooms); adding the 21 properties of 100–199 rooms with 3,025 rooms (26.4%) means 39 properties control 69.2% of inventory. At the other end, 118 properties in the 1–19 room band account for just 592 rooms (5.2%). Small properties dominate the count while room inventory concentrates in large ones — the two-tier structure typical of a regional core city. In practice, the lot sizes that work as investment targets are limited to the top 39 properties.
The vintage distribution is more telling still. Forty-five properties with 2,986 rooms opened in or before 1989, meaning 26.1% of rooms are in buildings more than 35 years old. Adding the 1990s brings the total to 86 properties and 4,705 rooms, or 41.1% of inventory at roughly 30 years or older. At the other end, 71 properties with 2,549 rooms (22.3%) opened or were first listed in the 2020s, including 13 large projects of 100-plus rooms totalling 2,280 rooms. Donan holds both an ageing stock ripe for renewal and a wave of supply from the past five years, and the room base open to repositioning or conversion runs to roughly 4,000 rooms.
Price — The Settled-ADR Estimate Sits at the Bottom of Hokkaido’s Major Markets, Down 2.7% YoY in Jan–Jul 2026
Turning to price: Hakodate’s settled-ADR estimate for July 2026 was ¥9,600 (N=87 properties). That is 53.0% of Sapporo’s Chuo Ward at ¥18,100 (N=137), 50.3% of Otaru at ¥19,100 (N=26), and 54.9% of Kutchan at ¥17,500 (N=22). Among Hokkaido’s principal accommodation markets, Hakodate sits in the lowest rate tier.
| Area | Jul 2025 | Jul 2026 | YoY | N (Jul 2026) |
|---|---|---|---|---|
| Otaru | ¥17,500 | ¥19,100 | +9.4% | 26 properties |
| Sapporo, Chuo Ward | ¥17,500 | ¥18,100 | +3.9% | 137 properties |
| Kutchan | ¥17,800 | ¥17,500 | -1.7% | 22 properties |
| Hokkaido, total | ¥12,000 | ¥12,200 | +1.4% | 952 properties |
| Asahikawa | ¥13,500 | ¥12,100 | -10.6% | 38 properties |
| Hakodate | ¥10,500 | ¥9,600 | -8.2% | 87 properties |
Single-month comparisons pick up seasonality and changes in the property mix, so it is worth checking the seven-month January–July average as well. Hakodate went from ¥8,300 in 2025 to ¥8,100 in 2026, down 2.7%, while Hokkaido as a whole went from ¥9,300 to ¥9,900, up 7.3%. Even on a seven-month average, Hakodate stays flat while the prefecture rises.
Breaking the market down by category makes the rate structure clearer. For July 2026 in Hakodate: business hotels ¥8,700 (N=47), ryokan ¥8,800 (N=25), city hotels ¥15,100 (N=5) and resort hotels ¥15,800 (N=10). The business and ryokan categories that carry the bulk of room inventory are pinned around ¥9,000, and only 15 properties sit above ¥15,000. That structure implies that the thinness of the upper price bands is itself the opening for entry.
Rates in the surrounding towns rest on samples of only one to seven properties and must be treated as indicative. Even so, the pattern is that Nanae at ¥9,800 (N=4) and Kikonai at ¥11,500 (N=2) come in above Hakodate, while Yakumo at ¥7,600 (N=7) and Hokuto at ¥6,800 (N=4) fall below. That Hokuto — home to Shin-Hakodate-Hokuto Station — prices some 30% below Hakodate shows that a Shinkansen station location has not yet converted into rate. This reading is consistent with the land price data discussed next.
Location — Only the Hakodate Station Front Is Moving; Goryokaku Has Been Flat for Four Years
From the MLIT Real Estate Information Library we pulled the official land price survey points in Hakodate (commercial and quasi-residential zones) for 2023 through 2026 and arranged them as a time series. The result is unusually clear-cut.
| Survey point (nearest station, distance, zoning) | 2023 | 2024 | 2025 | 2026 | 2026 YoY |
|---|---|---|---|---|---|
| Goryokaku-koen-mae 0m, commercial zone (FAR 600%) | ¥181,000 | ¥181,000 | ¥181,000 | ¥181,000 | 0.0% |
| Hakodate Station front 0m, commercial zone (FAR 600%) | ¥132,000 | ¥134,000 | ¥145,000 | ¥160,000 | +10.3% |
| Goryokaku-koen-mae 300m, commercial zone (FAR 600%) | ¥79,900 | ¥79,100 | ¥79,100 | ¥79,100 | 0.0% |
| Hakodate Station 500m, commercial zone (FAR 600%) | ¥66,000 | ¥66,000 | ¥66,000 | ¥66,000 | 0.0% |
| Yunokawa Onsen 200m, commercial zone (FAR 400%) | ¥54,700 | ¥54,100 | ¥53,500 | ¥53,000 | -0.9% |
| Shinkawa-cho 0m, commercial zone (FAR 400%) | ¥52,000 | ¥51,600 | ¥51,400 | ¥51,200 | -0.4% |
| Chiyogadai 0m, neighbourhood commercial zone (FAR 300%) | ¥53,500 | ¥53,200 | ¥53,000 | ¥52,800 | -0.4% |
The commercial site in front of Hakodate Station rose from ¥132,000/m² in 2023 to ¥160,000/m² in 2026, up 21.2% over three years. The annual pace has accelerated year by year: +1.5% in 2024, +8.2% in 2025 and +10.3% in 2026. By contrast, Goryokaku-koen-mae, the city’s highest-priced site, has printed 0.0% for three consecutive years from 2024, as has the point 300m away. Yunokawa Onsen has declined for three straight years since 2024.
That asymmetry matches the movement of accommodation supply precisely. Of the 13 large properties of 100-plus rooms (2,280 rooms) that opened in Donan from 2020 onward, more than half sit within a 1km radius of Hakodate Station. Listed-REIT acquisitions are likewise concentrated on the station and bay side, so capital on the demand side is clearly heading for the station front. Land prices are moving there because that is the only place investment is going.
| Zoning | Commercial zone |
| FAR / building coverage | 600% / 80% |
| District plan | Hakodate Station area |
| High-density use districts | Ekimae-Higashi, Minami and Wakamatsu (3 districts) |
| Establishments | 1,150 |
| Employees | 9,898 |
| Office-sector share | 15.0% |
The likely slippage of the Sapporo Shinkansen extension to around the end of FY2038 cuts two ways for Donan investment decisions. In the near term it pushes out the upside of “more through-traffic demand from the extension”, but it also means Shin-Hakodate-Hokuto stays the terminus for arrivals from Honshu for roughly another decade. Work is proceeding on the basis that the Hakodate–Shin-Hakodate-Hokuto section will keep passenger service, so the link between the transfer flow on that section and accommodation demand at the Hakodate station front and bay area will not change for the foreseeable future. For projects underwritten on a 10–15 year payback, the delay reads as a stabiliser of assumptions rather than a setback.
On the Hokuto side, land price data shows that the development potential of the Shinkansen station front has yet to materialise. In the 2026 survey, the only points obtainable near Shin-Hakodate-Hokuto Station were residential sites at ¥19,200/m² 2.6km away (down 0.5% year on year) and ¥15,100/m² 3.7km away (down 0.7%); no commercial survey point has been established at the station front itself. Accommodation rates in Hokuto, at ¥6,800 (N=4), run 30% below Hakodate. In both land price and room rate terms, the area in front of Shin-Hakodate-Hokuto Station is still at the stage where no market has formed. How an extension opening eventually converts into rates and investment headroom is a question that markets such as Fukui, two years on from the Hokuriku Shinkansen reaching Tsuruga, are only beginning to answer.
Ground and Disaster Risk — Assess Bay-Area Liquefaction and Tsunami Inundation Separately
The Hakodate station front and bay area attract the most investment on both land price and demand, yet they also demand the most careful scrutiny of ground conditions. Pulling the MLIT Real Estate Information Library’s liquefaction tendency map (250m mesh) for the tiles around Hakodate Station gives the following breakdown across 208 mesh cells.
| Micro-landform | Liquefaction tendency | Mesh cells | Share |
|---|---|---|---|
| Sandy-gravel terrace | Not prone to liquefaction | 90 | 43.3% |
| Sandbar / gravel bar | Somewhat prone to liquefaction | 73 | 35.1% |
| Reclaimed land | Highly prone to liquefaction | 40 | 19.2% |
| Valley-floor lowland (gradient < 1/100) | Somewhat prone to liquefaction | 4 | 1.9% |
| Valley-floor lowland (gradient ≥ 1/100) | Somewhat resistant to liquefaction | 1 | 0.5% |
The bay area’s 40 reclaimed-land mesh cells (19.2%) fall in the “highly prone to liquefaction” class. This is precisely where scenic value is high and room rates are easiest to command, yet the difference in foundation work costs feeds straight into project economics. The sandy-gravel terrace on the Goryokaku side (90 cells, 43.3%) is classed as “not prone to liquefaction” and is favourable on ground conditions. Note that the ground-risk assessment runs in the opposite direction to the price signal of flat land prices at Goryokaku and rising ones at the station front.
On tsunami, Hakodate publishes a hazard map based on the megaquake models for the Japan and Kuril trenches. Roughly 32.2% of the municipal area falls within the projected inundation zone, with a maximum projected depth of about 10.0m. Many points at the station front and in the bay area fall inside that zone, so in practice, acquisition and development work should start from the city’s web hazard map, confirming point-level inundation depth and reference water level before setting the ground-floor use plan, evacuation plan and insurance structure. Put the other way, these are risks that can be designed around, not factors that negate project viability. The practical framing is to treat hazard conditions as a fourth axis of location assessment, quantified alongside rate levels and disaster-resilience capex rather than handled as a separate compliance checklist.
Trade-Area Population — Residents Within 2km of Hakodate Station Fall 32.6% by 2040 vs 2020; Demand Shifts to Visitors
Set the investment horizon at 10–20 years and the resident population projection becomes unavoidable. Within a 2km radius of Hakodate Station (120 cells of 250m mesh), the resident population was 31,676 in the 2020 census and an estimated 28,874 in 2025. By 2040 it is projected to shrink to 21,365, down 32.6% against 2020 (and 26.0% against the 2025 estimate). On age structure, people aged 65 and over already account for 12,563 residents, or 43.5%, as of 2025, while the working-age population stands at 14,272, or 49.4%.
Applying the same view to the 2km radius around Shin-Hakodate-Hokuto Station (72 cells) gives 2,430 residents in 2020, 2,240 in 2025 and 1,762 in 2040 (down 27.5% versus 2020 and 21.3% versus the 2025 estimate), with an ageing rate of 37.9%. Despite being a Shinkansen station, its 2km catchment holds less than 8% of the population around Hakodate Station. The business demand base is thin too: set against 1,150 establishments, 9,898 employees and a 15.0% office-sector share within 1km of Hakodate Station, the difference in demand structure is stark.
What this demographic trajectory means is that the carrier of Donan’s accommodation demand has shifted entirely from residents to visitors — tourism, business travel and events. The record 5.043 million overnight guests in FY2025, up 6.7% year on year, is precisely what that visitor flow supports. As an investment premise, revenue has to be designed around “how much of the wider flow can be captured,” not around “stable demand underpinned by the local population.”
Reference: competition with short-stay inventory
Across the Hakodate station and bay area (a 2km radius centred on Hakodate Kokusai Hotel), 61 hotels with 4,351 rooms coexist with 131 listed short-stay units offering total capacity for 887 guests. That is 20.4 short-stay guest places per 100 hotel rooms. By capacity band, 38 units sleep five to six, 38 sleep seven to ten and 18 sleep eleven or more, so 94 of the 131 units (71.8%) accommodate five or more guests, and by building type detached houses are the largest group at 53. In other words, this inventory does not compete head-on with single- and twin-led business hotels; it absorbs group and larger-party demand. Any plan for multi-guest or kitchen-equipped units has to start from the depth of that existing inventory.
“Short-stay inventory” here is not limited to lodging under the Private Lodging Business Act; it refers to listing-based short-stay inventory that includes properties operating under different legal bases such as the Hotel Business Act and special-zone private lodging. Listing counts do not match the number of filings registered with the authorities.
Listed REIT Ownership — 4 Assets, 812 Rooms in Donan, Acquired at ¥6.7–45.3mn per Room
Querying the ownership master for the seven hotel-focused listed REITs returns four holdings totalling 812 rooms in Donan. All are in Hakodate; no holdings were found in Hokuto, Nanae or any of the smaller towns.
| Property | Holding REIT | Rooms | Acquired | Acquisition price | Per room |
|---|---|---|---|---|---|
| Hakodate Kokusai Hotel (函館国際ホテル) | Invincible Investment Corporation (インヴィンシブル投資法人) | 435 | Jul 2024 | ¥16,830mn | ¥38.7mn |
| Hotel MyStays Hakodate Goryokaku (ホテルマイステイズ函館五稜郭) | Invincible Investment Corporation (インヴィンシブル投資法人) | 208 | Feb 2015 | ¥2,792mn | ¥13.4mn |
| Comfort Hotel Hakodate (コンフォートホテル函館) | Hoshino Resorts REIT (星野リゾート・リート投資法人) | 139 | May 2015 | ¥937mn | ¥6.7mn |
| fav Hakodate (fav 函館) | Kasumigaseki Hotel REIT (霞ヶ関ホテルリート投資法人) | 30 | Aug 2025 | ¥1,360mn | ¥45.3mn |
| Donan total | 812 | — | ¥21,919mn | ¥27.0mn | |
What stands out is how per-room acquisition prices have changed over a decade. The two 2015 acquisitions came in at ¥6.7mn and ¥13.4mn per room, whereas Hakodate Kokusai Hotel, acquired in July 2024, was ¥38.7mn per room and fav Hakodate, acquired in August 2025, ¥45.3mn per room. Within the same city, the acquisition price range has moved sharply upward over nine years. Property grade and location differ, so these are not directly comparable, but it is clear that listed investors re-rated the Hakodate market at the same time the station front began rising in the land price survey.
Operating results at the Hakodate properties are strong as well. Invincible Investment Corporation’s property-level disclosure for June 2026 puts Hakodate Kokusai Hotel at 88.4% occupancy, ADR ¥18,366 and RevPAR ¥16,229. For the same month, the REIT’s 103 domestic hotels as a whole posted 82.2% occupancy, ADR ¥12,306 and RevPAR ¥10,118, so Hakodate Kokusai Hotel runs 6.2 points above on occupancy and about 1.60 times the portfolio average on RevPAR. Hotel MyStays Hakodate Goryokaku also held above the portfolio average on occupancy at 83.4% (June 2026 actual), with ADR ¥9,799 and RevPAR ¥8,174.
Against an area-wide settled-ADR estimate of ¥9,600, upper-grade properties on the station and bay side are achieving the ¥18,000 range. From that contrast follows the reading that Hakodate’s low rates reflect the composition of its inventory rather than a low ceiling on the market. Put together with the structure identified in the previous section — only 15 properties above ¥15,000 — the room to enter the upper price bands is unmistakable.
Positioning — Only 15 Properties Above ¥15,000; the Upper Bands Are Structurally Thin
Setting Hakodate’s category breakdown alongside room counts brings the gaps in the price ladder into focus. Forty-seven business properties and 25 ryokan cluster around the ¥9,000 band, and only five city hotels and ten resort hotels sit above ¥15,000. Demand has built to 5.04 million overnight guests a year, yet just 15 properties exist to catch it in the upper bands.
Crowded ¥8,000–¥10,000 band
47 business properties, 25 ryokan
Settled-ADR estimates cluster at ¥8,700–¥8,800. This is the main battleground of existing stock and a band where differentiating as a new entrant is hard. Lifting grade through renovation is the more realistic option.
Gap 1 ¥12,000–¥15,000 band
Upper-middle
A clear gap sits between the business-category ceiling (¥8,700) and the city-hotel level (¥15,100). For a 100–180 room project on commercial land at the station front (FAR 600%), this is the most realistically attainable band.
Gap 2 Above ¥20,000
Upper to luxury
Only a handful of large properties on the station and bay side consistently clear ¥18,000. The raw materials — scenery, food and hot springs — are all in place, leaving headroom for a 40–80 room, small-format, high-rate play.
Development Scenario Modelling — New Builds Land in the 6% Range; Repositioning Older Stock Wins at 7%
Taking the measured values above as inputs, we model three investment scenarios at the Hakodate station front. These are simplified calculations built from public data, and any actual investment decision requires a full feasibility study — a caveat worth stating up front.
■ Modelling assumptions
- Land: Hakodate station front, commercial zone, FAR 600% / building coverage 80%. Unit price taken as ¥160,000/m² from the 2026 official land price survey. New-build scenarios assume a 1,200m² site and 5,500m² of gross floor area.
- Construction cost (stage 1, 2025 actual basis): ¥2.3mn per tsubo (3.3m²) for a rooms-led format and ¥2.5mn per tsubo for upper-middle. MLIT’s building starts statistics put 2025 at ¥2.405mn per tsubo for steel-frame and ¥2.026mn for reinforced concrete, and we adopted this range as the working level for hotel use.
- Construction cost (stage 2, inflation over the build period): assuming a 2031 opening and a three-year build, we applied a compounded factor of 1.155 from construction cost increases of +5.3% in 2026, +5.0% in 2027 and +4.5% in 2028.
- ADR: from the band structure measured for Hakodate in this article, Scenario A is set at ¥12,500 (midway between the ¥8,700 business ceiling and the ¥15,100 city-hotel level) and Scenario B at ¥24,000 (a new-build premium band above the ¥18,366 achieved by upper-tier station and bay properties).
- GOP margin: 45% for rooms-led, 38% for upper-middle and 42% for repositioning. Referencing the GOP actually recorded on Invincible Investment Corporation’s operator-managed properties (38.9%, FY ended December 2024), we set rooms-led above and full-service at or below that level, a conservative stance.
- Definition of yield: GOP divided by total investment. It is stated before rent, management fees, taxes and public dues, insurance and FF&E reserves, and is not an NOI yield.
| Item | A. Rooms-led midscale | B. Upper-middle | C. Repositioning older stock Recommended |
|---|---|---|---|
| Approach | New build | New build | Acquire existing + renovate |
| Rooms | 170 | 106 | 120 |
| Area per room | 22m² | 32m² | As existing |
| Assumed ADR | ¥12,500 | ¥24,000 | ¥13,000 |
| Assumed occupancy | 80% | 78% | 82% |
| Land / acquisition cost | ¥192mn | ¥192mn | ¥1,800mn |
| Construction / renovation cost | ¥3,827mn | ¥4,159mn | ¥720mn |
| Total investment | ¥4,019mn | ¥4,351mn | ¥2,520mn |
| Annual rooms revenue | ¥620mn | ¥724mn | ¥467mn |
| GOP | ¥279mn | ¥275mn | ¥196mn |
| GOP yield (2025 construction cost) | 6.9% | 6.3% | 7.8% |
| Total investment (after inflation) | ¥4,614mn | ¥4,997mn | ¥2,632mn |
| GOP yield (after inflation) | 6.0% | 5.5% | 7.4% |
| Simple payback (after inflation) | 16.5 years | 18.2 years | 13.4 years |
The implication is clear. Once construction inflation is priced in, new-build yields fall to 6.0% for A and 5.5% for B, while acquiring and renovating older stock holds 7.4%. As shown earlier, Donan has 2,986 rooms (26.1% of all rooms) in buildings more than 35 years old. With construction running at ¥2.3–2.5mn per tsubo, the economic value of being able to reuse an existing structure grows precisely in markets like Donan where rates sit in the ¥9,000 range. In Hakodate, conversion of existing stock has already begun to move — the “T9 HAKODATE” project, for instance, regenerates a historic building into a mixed-use complex with accommodation.
Construction cost inflation is also a tailwind for incumbents on the competitive front. The higher the bar for a new build to pencil, the more near-term new supply pressure is held back. After the recent wave of 13 large projects of 100-plus rooms totalling 2,280 rooms opened in the 2020s, there is a good chance of a phase in which supply has run its course while demand keeps growing.
■ Sensitivity analysis (Scenario A, 2025 construction cost basis)
| Case | Annual revenue | GOP | GOP yield |
|---|---|---|---|
| Base case (ADR ¥12,500 / OCC 80%, full-year assumption) | ¥620mn | ¥279mn | 6.9% |
| ADR -10% (¥11,250) | ¥558mn | ¥251mn | 6.3% |
| OCC -5pt (75%) | ¥582mn | ¥262mn | 6.5% |
| ADR -10% and OCC -5pt | ¥524mn | ¥236mn | 5.9% |
■ Two-axis sensitivity (Scenario A, GOP yield, 2025 construction cost basis)
| OCC \ ADR | ¥10,000 | ¥11,250 | ¥12,500 | ¥13,750 | ¥15,000 |
|---|---|---|---|---|---|
| 70% | 4.9% | 5.5% | 6.1% | 6.7% | 7.3% |
| 75% | 5.2% | 5.9% | 6.5% | 7.2% | 7.8% |
| 80% | 5.6% | 6.3% | 6.9% | 7.6% | 8.3% |
| 85% | 5.9% | 6.6% | 7.4% | 8.1% | 8.9% |
| 90% | 6.3% | 7.0% | 7.8% | 8.6% | 9.4% |
Read on two axes, lifting the 6.9% base case into the 7% range requires either holding ADR at ¥12,500 while pushing full-year OCC to 85%, or taking ADR to ¥13,750 while holding OCC at 80%. On the downside, falling to ADR ¥10,000 and OCC 75% takes the yield to 5.2%. The grid uses the same assumptions as the single-axis sensitivity above, and the cell for ADR -10% with OCC -5pt (¥11,250 × 75%) matches at 5.9%. Acquiring and renovating existing stock (Scenario C) can hold the 7% range because it keeps that denominator — total investment — to a little over 60% of a new build.
Risk Assessment and Investment Summary
| Risk category | Description | Level | Direction of response |
|---|---|---|---|
| Market (rate) | Settled-ADR estimate below the Hokkaido average, down 2.7% year on year over January–July 2026 | Medium | Underwrite entry rates conservatively and design the rate lift through a shift of inventory into upper bands |
| Demand (structural) | Residents within the 2km catchment fall 32.6% by 2040 versus 2020 (26.0% versus the 2025 estimate); the ageing rate is already 43.5% | High | Build revenue on visitor demand — tourism, business travel and events — rather than local demand |
| Inbound concentration | Taiwan accounts for 47% of foreign overnight guests, a high dependence on a single market | Medium | Actively diversify the country mix on the back of growth from South Korea (+55%) and China (+41%) |
| Construction cost | On top of the ¥2.3–2.5mn per tsubo level, roughly +15.5% of inflation must be priced in over a three-year build | High | Prioritise acquiring and renovating existing stock over new builds; for new builds, lock construction contracts early |
| Ground (liquefaction) | 40 reclaimed-land mesh cells in the bay area (19.2%) are classed as highly prone to liquefaction | High | Make point-level ground surveys a condition precedent to acquisition; build foundation cost overruns into the business plan |
| Tsunami | About 32.2% of the municipal area is in the projected inundation zone, with a maximum projected depth of about 10.0m | Medium | Confirm point-level inundation depth and reference water level, and respond through ground-floor use planning, evacuation planning and insurance design |
| Transport infrastructure | The Sapporo Shinkansen extension has slipped to roughly the end of FY2038; the framework for the parallel conventional line is still being settled | Low–Medium | Do not underwrite revenue on the extension; work from retained passenger service between Hakodate and Shin-Hakodate-Hokuto |
| Competing supply | 13 projects of 100-plus rooms totalling 2,280 rooms already delivered in the 2020s; 131 short-stay listings with capacity for 887 coexist | Medium | Existing inventory is deep in multi-guest and kitchen-equipped units; differentiate on private-room rate instead |
1. Narrow the location to the station front and bay area
Hakodate Station is the only place where land prices are rising, at ¥160,000/m² in the 2026 survey, up 10.3% year on year. Three high-density use districts are designated and FAR 600% is available. Reclaimed land carries the harshest liquefaction classification, so a ground survey should be a condition precedent to acquisition.
2. Renew existing stock rather than build new
After construction inflation, yields are 6.0% and 5.5% for new builds versus 7.4% for acquiring and renovating older stock. Donan has 2,986 rooms in buildings over 35 years old, so the renewal opportunity reaches a quarter of the market by rooms.
3. Target the ¥12,000–¥15,000 band
The space between the ¥8,700 business ceiling and the ¥15,100 city-hotel level is empty. Against 5.04 million overnight guests a year, only 15 properties sit above ¥15,000, so shifting into the upper bands is the shortest route to better rates.
Finally, a word on timing. Land price growth at the Hakodate station front has accelerated from +8.2% in 2025 to +10.3% in 2026, so acquisition costs are still heading up. At the same time, the Sapporo Shinkansen extension has receded to around the end of FY2038, which means there will be no near-term rush of land price appreciation ahead of an opening. Put together, the read is that acquiring land at the station front faces a continued gradual climb but limited risk of a spike. Acquiring older stock, by contrast, is the kind of trade that attracts more competition the longer construction costs stay elevated, and therefore ranks higher on timing priority.
Conclusion — What Re-Counting the “Hakodate Market” Reveals
Sixteen Donan municipalities, 226 properties, 11,449 rooms. Hakodate accounts for 173 properties and 9,818 rooms, or 85.8% of inventory. The other 15 towns together come to only 1,631 rooms, so investing in Donan is in practice investing in Hakodate. For an investor, that single-core structure is also a simplification: the locations worth considering are few, and the decision narrows to roughly three choices — the station front, Goryokaku, or Yunokawa.
On that basis, the price signal points only at the station front. In the 2026 official land price survey, the commercial site in front of Hakodate Station reached ¥160,000/m², up 10.3% year on year and rising for a third consecutive year, with the pace accelerating. Goryokaku-koen-mae, the city’s highest-priced site, has been unchanged for four years, and Yunokawa Onsen has fallen for three. Listed-REIT acquisitions and the large openings of the 2020s are likewise concentrated on the station and bay side.
Demand keeps setting records: 5.043 million overnight guests in FY2025, up 6.7% year on year, including roughly 579,000 foreign overnight guests. Even so, the settled-ADR estimate stays at ¥9,600 and only 15 properties sit above ¥15,000. That mismatch between demand growth and inventory composition is the core opportunity in Donan hotel investment. The fact that an upper-tier station-front property held by a listed REIT ran at 88.4% occupancy with RevPAR of ¥16,229 (June 2026 actual), far above its portfolio average, shows that this market’s ceiling sits well above its current average.
With construction at ¥2.3–2.5mn per tsubo and roughly +15.5% of inflation to price in over a three-year build, new-build yields now fall below 6%. Meanwhile 2,986 rooms — a quarter of the market — sit in buildings more than 35 years old. The next thing to move in Donan is not building something new, but making something that already exists new again.
Related Reading
- Chitose & Tomakomai Worker Lodging — 7 New Hotels, 738 Rooms in 2026
- Station Premium Ends at an 8-Minute Walk: 8 Stations, 1,012 Hotels
- Corporate Retreat Conversions: 8.27% GOP Yield Across 5 Onsen Areas
- Construction +41% & Labor Crunch Erase Japan’s 2027-2029 Hotel Supply
- Japan’s Second Cities: 21 Prefectures Where the Capital Isn’t #1
- Intra-Prefecture ADR Gaps 2026: Median 2.74x, Okinawa Widest at 5.86x
References and Sources
■ Data sources
The supply inventory treats properties confirmed as listed on OTAs for check-in dates from 19 August to 30 September 2026 as “operating” and sums their master-registered room counts (16 Donan municipalities, N=226 properties / 11,449 rooms). The settled-ADR estimate is the area median of estimated settled rates derived by applying category-specific adjustment factors to each property’s lowest listed plan, aggregated monthly by area (Hakodate July 2026 N=87 properties; Hokkaido total for the same month N=952 properties). Land prices, zoning, district plans, high-density use districts and the liquefaction tendency map come from the MLIT Real Estate Information Library; the resident population within a 2km radius comes from the National Land Numerical Information 250m-mesh future population projection; establishments and employees come from the Economic Census for Business Activity. Listed-REIT holdings were queried against an ownership master covering seven hotel-focused REITs (N=302 domestic properties) and cross-checked against each REIT’s published materials.
■ Modelling assumptions
The assumptions behind the development scenario model — land unit price, construction cost level, build-period inflation factor, ADR settings, GOP margin and the definition of yield — are all stated in the “Modelling assumptions” list in the Development Scenario Modelling section. In short: land at ¥160,000/m² from the 2026 official land price survey; construction at ¥2.3–2.5mn per tsubo on a 2025 actual basis; a compounded build-period inflation factor of 1.155; GOP margins of 45% for rooms-led, 38% for upper-middle and 42% for repositioning; and yield defined as GOP divided by total investment (before rent, management fees, taxes and public dues, insurance and FF&E reserves — not an NOI yield). In the two-axis sensitivity grid, the ADR axis follows the category range measured for Hakodate in this article and the OCC axis is capped at the June 2026 actuals disclosed by listed REITs for their Hakodate properties; both are full-year assumptions.
■ Limitations and caveats
The settled-ADR estimate is an estimate and differs from each property’s actual transacted rates and accounting figures. Ryokan, minshuku and simple lodging houses not listed on OTAs are excluded from the supply count, and because one property is listed under both its old and new names following a rebrand, the building-level count is effectively 225. The development scenarios are simplified calculations built from public data; any actual investment decision requires a full feasibility study. The denominator of the assumed yields excludes pre-opening costs, working capital and financing costs. The official land price survey values individual survey points and is not a substitute for the acquisition price of a specific site. Liquefaction tendency and inundation projections are mesh-based, area-level classifications and do not substitute for site-level ground surveys or inundation assessments. Future population figures are projections. Note also that short-stay inventory is shown only as listing counts and capacity, and is never placed in the same table or chart as hotel-side metrics.
■ Market data
- MetroEngines Research & Consulting — settled-ADR estimate (16 Donan municipalities and major Hokkaido cities), OTA-listing-confirmed supply aggregation (N=226 properties / 11,449 rooms), REIT ownership master (N=302 domestic properties), short-stay inventory listing counts (N=131)
■ Government statistics and public data
- MLIT Real Estate Information Library — official land price survey (2023–2026), zoning, district plans, high-density use districts, liquefaction tendency map
- MLIT “Statistics on Building Construction Starts (Building Dynamics Statistics Survey)” — construction cost levels by structure
- MLIT National Land Numerical Information (250m-mesh future population projection, NIPSSR-based) — resident population within 2km of Hakodate Station and Shin-Hakodate-Hokuto Station
- MIC / METI “Economic Census for Business Activity” — establishments and employees within 1km of Hakodate Station
- Hakodate City Tourism Department, “Estimated Visitor Arrivals to Hakodate (FY2025)”
- Hakodate City, “About the Tsunami Hazard Map”
- Hokkaido Government, Crisis Management Bureau, “Earthquake and Tsunami Measures (Projected Tsunami Inundation)”
■ REIT and investment
- Invincible Investment Corporation, “Monthly Operating Status, June 2026” — occupancy, ADR and RevPAR for the domestic hotel portfolio, plus property-level results
- Hoshino Resorts REIT IR materials — acquisition dates and prices for portfolio properties
■ News and transport infrastructure
- Japan Railway Construction, Transport and Technology Agency, “Hokkaido Shinkansen — Projects Under Construction”
- Hokkaido Shimbun, “Sapporo Shinkansen extension worth ¥182bn in economic impact; opening assumed for end of FY2038”
- Hokkaido Shimbun, “Hakodate visitors hit record 6.05 million in FY2025”
- Railway Press Net, “Hakodate Line Oshamambe–Otaru abolition confirmed: 140km to convert to bus”
- Tabiris, “Hakodate Line Hakodate–Oshamambe: freight to be retained even as passenger service ends”
⚠ Note on ADR for future dates: ADR figures in this article from August 2026 onward are estimates based on selling prices published on OTAs at the time of the survey, and will move as check-in dates approach. The analysis centres on settled months through July 2026.