

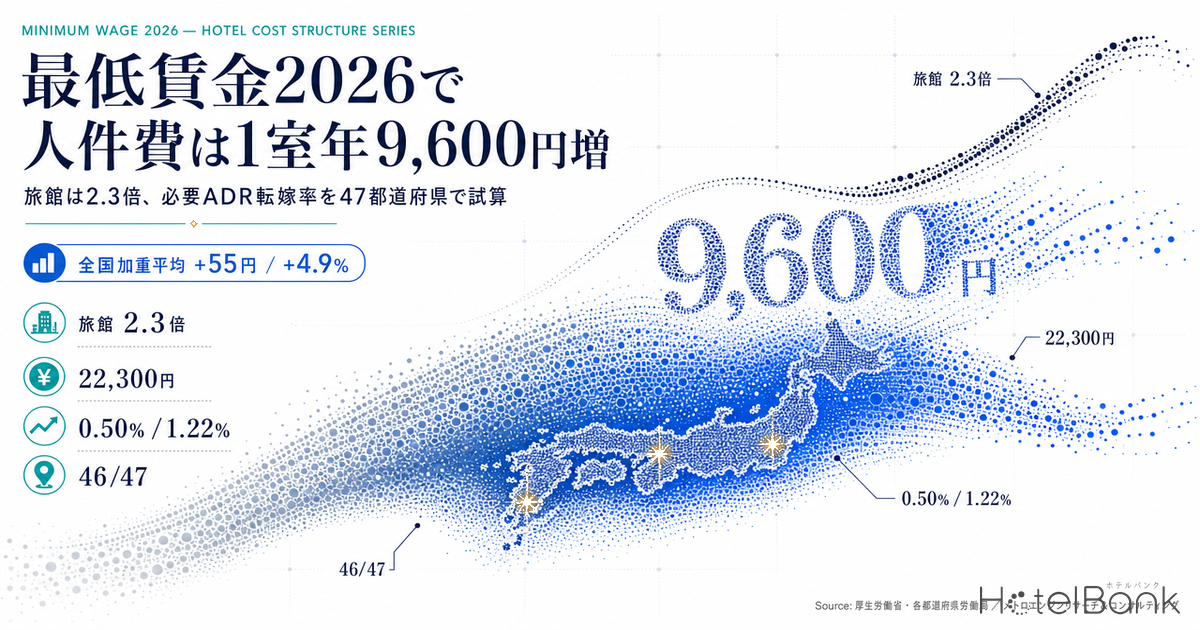
Labor is the single largest line item on a hotel or ryokan P&L. And from October 2026, the floor under that largest line item rises nationwide. The Central Minimum Wages Council’s 28 July 2026 recommendation set guideline increases of ¥54 for Rank A, ¥56 for Rank B and ¥56 for Rank C. If every prefecture had revised exactly in line with the guideline, the national weighted average would be ¥1,176 per hour (+¥55, or +4.9% year on year). As of 2 September 2026, 46 of 47 prefectural councils had issued their recommendations, with only Okinawa outstanding. Effective dates are spread widely, from 1 October to 1 December.
This article converts that revision into “how many yen per room per year” and “how many yen per room-night,” then works backwards to the percentage move in room rate needed to absorb it. We build it bottom-up from two model properties: a 150-room limited-service business hotel and an 80-room onsen ryokan. Every assumption is disclosed, and for the variable that matters most — the share of labor hours sitting at or near the minimum wage — we show a sensitivity band of 30%, 50% and 70%. As the latest instalment in HotelBank’s cost-structure series, following water and sewerage, electricity and gas, property tax and insurance, this piece quantifies the last and largest item remaining.
Metric Definitions Used in This Article
- ADR (average daily rate): an estimated settled rate (tax-exclusive equivalent) derived by applying a segment-specific adjustment coefficient to the lowest published plan rate each property lists on OTAs (double occupancy, per-room rate, tax-inclusive). Cross-checked against property-level actuals disclosed by listed hotel REITs (91 properties, most recent three months), the median error is approximately 7%. These are estimates and differ from each property’s actual transacted rates and accounting figures. Area-level ADR is the median of the properties covered (the level of a typical property in that area); this article uses the 12-month average for September 2025 to August 2026.
- OCC (occupancy rate): rooms sold as a share of total rooms in the area (an estimate based on OTA-listed inventory). The prefecture-level occupancy in this article is the average for June to August 2026 and reflects how OTA-listed inventory was absorbed. It differs from each property’s actual whole-house occupancy.
- Rooms sold per year in the model calculations: derived using the room occupancy rates by property type in the Japan Tourism Agency’s Overnight Travel Statistics Survey, calendar 2025 annual figures (preliminary) — 75.3% for business hotels and 38.4% for ryokan. This is a separate series from the OCC above, with a different source and definition.
- Required ADR pass-through rate: the minimum wage increase (¥ per hour) × labor hours per occupied room-night × the near-minimum-wage share × the statutory benefits coefficient, divided by estimated settled ADR. Labor hours are model assumptions; actual labor input varies widely by property.
- Data sources: minimum wage figures are published values from the Ministry of Health, Labour and Welfare, the Central Minimum Wages Council and each Prefectural Labour Bureau. Room rates and occupancy are from MetroEngines Research & Consulting.
Key Takeaways
- ¥9,600 per room per year (business hotel) and ¥22,300 (onsen ryokan) — assuming the +¥55 national weighted average, a 50% near-minimum-wage share and a 15% uplift for statutory benefits. The ryokan figure is 2.3x the business hotel’s.
- Per room-night the gap widens to 4.6x, at ¥35 versus ¥159 — driven not only by labor intensity but by the occupancy gap (75.3% versus 38.4%), which concentrates the same annual cost onto far fewer room-nights sold.
- Median required ADR pass-through is 0.50% (business hotel) and 1.22% (ryokan) — one-tenth and one-third respectively of the past 12 months’ ADR growth (+5.8% for business hotels, +4.3% for ryokan), so it sits well inside what rate design can absorb.
- Rank C prefectures face a double bind: larger increases on lower rates — average increase of ¥60.7 versus ¥54.5 in Rank A, while median business hotel ADR is ¥6,828 versus ¥8,709 in Rank A. Required pass-through therefore widens 1.4x, from 0.40% (A) to 0.55% (C).
- At the ¥1,500 national average (the government target), the cumulative figure reaches ¥56,400 and ¥131,600 per room per year — ¥8.46mn a year for the 150-room hotel and ¥10.53mn for the 80-room ryokan. Capitalised at a 5.0% cap rate, that equates to ¥169mn and ¥211mn of asset value, so the earlier rate design is locked in, the better.
46 prefectures confirmed — an unusual allocation that favours the regions over the cities
Start with where the process stands. The guideline the Central Minimum Wages Council issued on 28 July was ¥54 for Rank A, ¥56 for Rank B and ¥56 for Rank C. Setting B and C equal and ¥2 above A is a design consciously aimed at narrowing regional gaps. Rank A covers six prefectures — Saitama, Chiba, Tokyo, Kanagawa, Aichi and Osaka — with 28 in Rank B and 13 in Rank C.
As of 2 September 2026, 46 prefectural councils had published their recommendations, leaving only Okinawa. Few prefectures stopped at the guideline: actual increases range from ¥65 in Saga at the top down to ¥54 in Tokyo, Kanagawa and Osaka. Average increases by rank are ¥54.5 for Rank A, ¥57.6 for Rank B and ¥60.7 for Rank C — regional increases came in larger than even the guideline design implied. Our review at the mid-August stage, when 28 prefectures had reported, is set out in Japan Minimum Wage 2026: Chiba & Aichi ¥1,195, Oct 1-15 Rollout.
In Okinawa, reporting indicates the gap between labour and management positions in the specialist subcommittee had narrowed from ¥63 to ¥6. We have not filled that gap with an estimate: the prefecture is marked “pending” in the table below and excluded from the required pass-through calculations.
Effective dates are not uniform either. While 1 October is the most common, Kyoto takes effect on 16 November and Kumamoto and Iwate on 1 December — a two-month spread from the earliest prefectures. For operators running properties across several prefectures, the same revision therefore lifts payroll in stages, producing three distinct steps in the monthly P&L between October and December.
Model property assumptions — full disclosure of annual labor hours
This is the core of the analysis. How much a minimum wage revision lifts a property’s payroll comes down to two things: how many labor hours the property uses in a year, and what share of those hours sits near the minimum wage. We set the first as a model assumption and flex the second through a sensitivity range.
We use two models. The first is a 150-room limited-service business hotel (breakfast served, no restaurant operation; room cleaning treated identically in hours whether in-house or outsourced). The second is an 80-room onsen ryokan (one night with dinner and breakfast, large communal bath, in-room service by attendants). Rooms sold per year use the room occupancy rates by property type from the Japan Tourism Agency’s Overnight Travel Statistics Survey, calendar 2025 annual figures (preliminary), unchanged: 75.3% for business hotels and 38.4% for ryokan.
| Function | Annual labor hours |
|---|---|
| Room cleaning and linen (0.50 hours per room-night) | 20,614 hours |
| Front desk and night shift (36 hours per day in total) | 13,140 hours |
| Breakfast operation (20 hours per day in total) | 7,300 hours |
| Facility management, laundry and administration (12 hours per day in total) | 4,380 hours |
| Total | 45,434 hours |
| Full-time equivalent (2,000 hours per person) | 22.7 staff (0.151 per room) |
| Rooms sold per year (75.3% occupancy, Japan Tourism Agency, Jan-Dec 2025) | 41,227 room-nights |
| Labor input per occupied room-night | 1.10 hours |
| Function | Annual labor hours |
|---|---|
| Room cleaning and futon setting (1.20 hours per room-night) | 13,456 hours |
| Kitchen, dinner and breakfast (35 hours per day in total) | 12,775 hours |
| Room attendants, service and guest relations (38 hours per day in total) | 13,870 hours |
| Front desk and reservations (20 hours per day in total) | 7,300 hours |
| Communal bath, maintenance and facility management (16 hours per day in total) | 5,840 hours |
| Administration (9 hours per day in total) | 3,285 hours |
| Total | 56,526 hours |
| Full-time equivalent (2,000 hours per person) | 28.3 staff (0.353 per room) |
| Rooms sold per year (38.4% occupancy, Japan Tourism Agency, Jan-Dec 2025) | 11,213 room-nights |
| Labor input per occupied room-night | 5.04 hours |
The decisive difference between the two models is not only staffing density on a full-time-equivalent basis (0.151 versus 0.353 per room). It is that labor input per occupied room-night differs 4.6x, at 1.10 hours versus 5.04 hours. The ryokan adds kitchen and in-room service processes, and because occupancy is only 38.4%, the fixed daily hours for functions such as the front desk and bath maintenance are allocated across far fewer room-nights sold. The payroll burden is the product of labor intensity and occupancy.
Two further coefficients translate the revision into money: a statutory benefits coefficient of 1.15 (a 15% uplift on the hourly increase for the employer’s social insurance contributions and the knock-on effect on premium pay) and the near-minimum-wage share (the share of total labor hours that either falls below the revised minimum wage or must be lifted in step with it). The latter drives the result more than anything else, so the next section lays out three levels: 30%, 50% and 70%.
We take 50% as the base case because lodging is an industry with an exceptionally high part-time ratio. In the Ministry of Health, Labour and Welfare’s Monthly Labour Survey, final figures for FY2025, part-time workers accounted for 78.27% of employees in the accommodation and food services grouping — 2.5x the all-industry figure of 31.39%. The same ministry’s 2025 Basic Survey on Wage Structure puts scheduled cash earnings in accommodation and food services at ¥277,200, the lowest of any major industry division. Structurally, this sector carries a thicker layer of workers close to the hourly floor than most.
¥9,600 and ¥22,300 per room per year — read the range through the sensitivity
Now convert the assumptions into money. The formula is annual labor hours × near-minimum-wage share × the increase (¥ per hour) × the statutory benefits coefficient of 1.15. Applying the +¥55 national weighted average, the base case (50% near-minimum-wage share) gives ¥1.437mn a year for the 150-room business hotel and ¥1.788mn a year for the 80-room onsen ryokan.
| Near-minimum-wage share | Business hotel, 150 rooms, per year | Same, per room per year | Same, per room-night | Ryokan, 80 rooms, per year | Same, per room per year | Same, per room-night |
|---|---|---|---|---|---|---|
| 30% (conservative case) | ¥862,110 | ¥5,747 | ¥20.9 | ¥1,072,581 | ¥13,407 | ¥95.7 |
| 50% (base case) | ¥1,436,850 | ¥9,579 | ¥34.9 | ¥1,787,635 | ¥22,345 | ¥159.4 |
| 70% (aggressive case) | ¥2,011,590 | ¥13,411 | ¥48.8 | ¥2,502,689 | ¥31,284 | ¥223.2 |
What stands out is that while the ryokan’s total annual cost is only 1.24x the business hotel’s (¥1.788mn versus ¥1.437mn), per room per year the gap is 2.33x (¥22,345 versus ¥9,579) and per occupied room-night it reaches 4.57x (¥159.4 versus ¥34.9). Even with roughly half the rooms, the hours attached to each room and the scarcity of room-nights over which to recover them compound. That structure is the flip side of why ryokan rate discussions so often revolve around the per-night figure.
The sensitivity band itself is where the practical response lies. A property whose near-minimum-wage share is closer to 70% is more directly exposed to the revision — but that also means its labor hours are concentrated in the lowest hourly band, which leaves considerable room to compress the impact through shift redesign, reallocating hours between peak and trough periods, and reorganising tasks. Conversely, a property at the 30% end sees little direct impact, but because its wage levels already sit well above the floor, it is better placed on recruitment competitiveness. Knowing which side you are on is the starting point for budgeting from October.
| Near-minimum-wage share \ increase | +¥54 | +¥56 | +¥58 | +¥61 | +¥65 |
|---|---|---|---|---|---|
| 30% (conservative) | 0.28% 0.69% | 0.29% 0.72% | 0.30% 0.74% | 0.31% 0.78% | 0.33% 0.83% |
| 40% | 0.37% 0.92% | 0.38% 0.95% | 0.40% 0.99% | 0.42% 1.04% | 0.44% 1.11% |
| 50% (base) | 0.46% 1.15% | 0.48% 1.19% | 0.50% 1.24% | 0.52% 1.30% | 0.56% 1.38% |
| 60% | 0.55% 1.38% | 0.57% 1.43% | 0.59% 1.48% | 0.63% 1.56% | 0.67% 1.66% |
| 70% (aggressive) | 0.65% 1.61% | 0.67% 1.67% | 0.69% 1.73% | 0.73% 1.82% | 0.78% 1.94% |
Read across both axes, the business hotel stays within a 0.28-0.78% band and the ryokan within 0.69-1.94%. Even in the harshest bottom-right corner (70% share × +¥65), the figures are 0.78% and 1.94% — inside the past 12 months’ ADR growth of +5.8% and +4.3%. Put differently, if you fix which cell your property sits in first, the rate conversation from October becomes not “how much do we raise” but “how do we allocate within a band we have already absorbed.” The vertical axis (the near-minimum-wage share, up to 2.33x) moves the answer more than the horizontal one (the increase, up to 1.20x) — meaning the initiative over the size of the impact rests with shift design, not with the policy.
Placing it in the cost-structure series — one revision is small; the accumulation is not
This series has already quantified water and sewerage, electricity, property tax and fire insurance on a per-room annual basis. Putting the payroll revision on the same footing clarifies where it sits. All figures below are per occupied room-night, converted for the 150-room business hotel (274.8 room-nights sold per room per year).
Property tax runs ¥160,000-240,000 per room per year (¥582-873 per night); water and sewerage came to ¥6.99mn-14.85mn a year on a 100-room model, or ¥70,000-149,000 per room per year (¥254-540 per night); and the 2026 increase in electricity costs was ¥10mn a year on a 200-room model, or ¥50,000 per room per year (¥182 per night). Against those, the ¥35 from a single minimum wage revision is plainly small. Viewed in one year alone, it is not a level that warrants opening a rate discussion. Our separate analysis of holding taxes found that property tax of ¥160,000-240,000 per room per year drags the NOI yield down by about 0.7 percentage points.
What makes labor fundamentally different from the other items, however, is that it accumulates every year. Property tax moves on the three-yearly revaluation, water and sewerage tariffs are revised once every few years, and electricity moves up and down with the fuel cost adjustment. The minimum wage, by contrast, is revised every October without fail, and never downward. If the pace of +¥55 a year were to continue, annual payroll five years out would be ¥47,900 per room higher for the business hotel and ¥111,700 higher for the ryokan. The business hotel’s ¥47,900 equals 30-70% of the annual water and sewerage bill (¥70,000-149,000 per room), and the ryokan’s ¥111,700 equals 50-70% of annual property tax (¥160,000-240,000). The moment you set a five-year horizon, this becomes an item of the same order of magnitude as the rest.
Judged on a single year the impact looks small; judged on five years of accumulation it becomes one of the largest. That is what makes labor an awkward line item to handle — and equally what makes it the item best suited to being built into rates a little at a time, every year. Moving 0.5% in step with each annual revision is far easier for guests to accept, and far easier to agree internally, than one consolidated increase every five years.
Required ADR pass-through across 47 prefectures — the lower the rate, the higher the ratio
Now to the regional picture. Even under the same revision, the required rate adjustment varies widely by prefecture as a percentage, because the numerator is each prefecture’s increase and the denominator is its estimated settled ADR. The national range of increases is only 1.20x, from ¥54 to ¥65, whereas business hotel ADR spans 2.37x, from ¥5,959 in Tokushima to ¥14,118 in Tokyo. What drives the regional variation in pass-through is the rate side, not the wage side.
For business hotels the required pass-through has a median of 0.50%, a minimum of 0.24% in Tokyo and a maximum of 0.65% in Kagoshima — a 2.7x spread. Tokyo has the smallest increase in the country at +¥54 and the highest ADR at ¥14,118, so the adjustment needed is just ¥34 per occupied room-night, or 0.24% of rate. Kagoshima, by contrast, has a large increase at +¥64 and a low business hotel ADR of ¥6,236, requiring ¥41, or 0.65%.
Grouping by rank makes the structure clear. The six Rank A prefectures average a ¥54.5 increase on a median ADR of ¥8,709, for a required pass-through of 0.40%. The 12 Rank C prefectures that have reported average ¥60.7 on a median ADR of ¥6,828, for 0.55%. Rank C prefectures carry both conditions at once: larger increases and lower rates. Seen from the rate-design side of the lodging business, an allocation intended to narrow regional gaps asks for a larger adjustment from the prefectures where rates are lowest.
In the ryokan segment the regional spread is wider still. The median required pass-through is 1.22%, with a minimum of 0.69% in Kyoto and a maximum of 2.26% in Miyazaki — a range of 3.3x — because ryokan ADR spans 3.1x, from ¥24,190 in Kyoto to ¥7,777 in Tokushima. That said, even a figure in the 2% range means “building roughly ¥180 into the rate at a ryokan typically charging around ¥20,000 with two meals,” which is comfortably within what plan composition and optional add-ons can handle.
Mapping the regional variation in pass-through burden
The map below plots the required pass-through — the increase combined with ADR. Darker circles indicate a higher required pass-through; larger circles indicate a larger increase.
On the map, the areas with high required pass-through form a belt running from southern Kyushu through Shikoku and the San’in coast, with a further cluster in parts of Tohoku and northern Kanto. All are prefectures where the increase is +¥59 or more while business hotel ADR remains at or below the ¥7,000 range. At the other end, in higher-rate urban markets such as Tokyo, Osaka, Kyoto and Fukuoka, required pass-through settles around 0.3%.
From an investment standpoint, the practical way to read this map is not as “where it hurts” but as “where rate design carries the highest priority.” In prefectures where required pass-through exceeds 0.6%, building in an adjustment of roughly ¥40 per night before the October effective date is enough to absorb the full annual payroll increase. The amount is small — which is precisely why leaving it alone quietly thins the margin. Put the other way round, a property that already reviews its rate sheet once a year is handling this line item almost automatically.
All 47 prefectures — recommended wage, effective date and required pass-through
The full 47-prefecture table follows. Recommended amounts and effective dates are published figures from each Prefectural Labour Bureau; ADR is the 12-month average for September 2025 to August 2026; occupancy is the average for June to August 2026. Okinawa was still awaiting its recommendation as of 2 September 2026, so its cells are left blank rather than filled with an estimate.
| Prefecture | Rank | FY2026 recommendation | Increase | Effective | Business hotel ADR | Required pass-through | Ryokan ADR | Required pass-through | Estimated occupancy |
|---|---|---|---|---|---|---|---|---|---|
| Hokkaido | B | ¥1,131 | +¥56 | 10/1 | 8,986 | 0.40% | 9,846 | 1.65% | 91.1% |
| Aomori | C | ¥1,090 | +¥61 | 10/29 | 7,371 | 0.52% | 10,800 | 1.64% | 94.1% |
| Iwate | C | ¥1,090 | +¥59 | 12/1 | 6,570 | 0.57% | 9,078 | 1.88% | 86.9% |
| Miyagi | B | ¥1,098 | +¥60 | 10/1 | 7,667 | 0.50% | 13,629 | 1.28% | 89.7% |
| Akita | C | ¥1,090 | +¥59 | 10/14 | 7,657 | 0.49% | 9,364 | 1.83% | 90.2% |
| Yamagata | C | ¥1,092 | +¥60 | 10/30 | 7,093 | 0.54% | 13,383 | 1.30% | 89.0% |
| Fukushima | B | ¥1,094 | +¥61 | 10/16 | 6,380 | 0.61% | 11,057 | 1.60% | 87.8% |
| Ibaraki | B | ¥1,136 | +¥62 | 10/18 | 6,893 | 0.57% | 8,210 | 2.19% | 86.3% |
| Tochigi | B | ¥1,125 | +¥57 | 10/1 | 6,705 | 0.54% | 16,827 | 0.98% | 84.9% |
| Gunma | B | ¥1,120 | +¥57 | 10/3 | 6,652 | 0.54% | 15,760 | 1.05% | 83.3% |
| Saitama | A | ¥1,196 | +¥55 | 10/1 | 7,835 | 0.45% | 13,589 | 1.17% | 87.5% |
| Chiba | A | ¥1,195 | +¥55 | 10/1 | 8,158 | 0.43% | 13,706 | 1.16% | 87.9% |
| Tokyo | A | ¥1,280 | +¥54 | 10/1 | 14,118 | 0.24% | 11,276 | 1.39% | 92.3% |
| Kanagawa | A | ¥1,279 | +¥54 | 10/1 | 9,260 | 0.37% | 21,088 | 0.74% | 85.7% |
| Niigata | B | ¥1,108 | +¥58 | 10/1 | 6,970 | 0.53% | 13,759 | 1.22% | 87.6% |
| Toyama | B | ¥1,119 | +¥57 | 10/1 | 6,662 | 0.54% | 13,233 | 1.25% | 82.9% |
| Ishikawa | B | ¥1,113 | +¥59 | 10/3 | 7,892 | 0.47% | 18,095 | 0.94% | 82.0% |
| Fukui | B | ¥1,112 | +¥59 | 10/4 | 7,684 | 0.49% | 15,075 | 1.13% | 88.6% |
| Yamanashi | B | ¥1,113 | +¥61 | 11/1 | 8,139 | 0.47% | 12,889 | 1.37% | 85.4% |
| Nagano | B | ¥1,117 | +¥56 | 10/2 | 8,002 | 0.44% | 13,441 | 1.21% | 89.5% |
| Gifu | B | ¥1,121 | +¥56 | 10/1 | 7,517 | 0.47% | 14,962 | 1.08% | 85.2% |
| Shizuoka | B | ¥1,154 | +¥57 | 10/15 | 7,134 | 0.51% | 18,468 | 0.90% | 85.2% |
| Aichi | A | ¥1,195 | +¥55 | 10/1 | 7,881 | 0.44% | 14,470 | 1.10% | 85.6% |
| Mie | B | ¥1,143 | +¥56 | 10/1 | 6,930 | 0.51% | 16,669 | 0.97% | 83.0% |
| Shiga | B | ¥1,136 | +¥56 | 10/3 | 7,616 | 0.47% | 14,185 | 1.14% | 87.1% |
| Kyoto | B | ¥1,180 | +¥58 | 11/16 | 13,814 | 0.27% | 24,190 | 0.69% | 84.5% |
| Osaka | A | ¥1,231 | +¥54 | 10/1 | 9,964 | 0.34% | 11,403 | 1.37% | 85.4% |
| Hyogo | B | ¥1,172 | +¥56 | 10/1 | 8,520 | 0.42% | 21,894 | 0.74% | 88.9% |
| Nara | B | ¥1,107 | +¥56 | 10/4 | 8,721 | 0.41% | 16,882 | 0.96% | 82.3% |
| Wakayama | B | ¥1,101 | +¥56 | 10/3 | 6,537 | 0.54% | 13,708 | 1.18% | 84.0% |
| Tottori | C | ¥1,090 | +¥60 | 10/3 | 6,179 | 0.61% | 13,274 | 1.31% | 86.2% |
| Shimane | B | ¥1,092 | +¥59 | 10/10 | 7,564 | 0.49% | 15,848 | 1.08% | 86.3% |
| Okayama | B | ¥1,104 | +¥57 | 10/2 | 7,292 | 0.49% | 12,978 | 1.27% | 86.2% |
| Hiroshima | B | ¥1,141 | +¥56 | 10/11 | 7,757 | 0.46% | 16,802 | 0.97% | 87.6% |
| Yamaguchi | B | ¥1,101 | +¥58 | 10/8 | 6,402 | 0.57% | 15,462 | 1.09% | 86.2% |
| Tokushima | B | ¥1,103 | +¥57 | 11/1 | 5,959 | 0.61% | 7,777 | 2.12% | 85.8% |
| Kagawa | B | ¥1,092 | +¥56 | 10/1 | 7,437 | 0.48% | 12,000 | 1.35% | 85.1% |
| Ehime | B | ¥1,093 | +¥60 | 11/1 | 6,147 | 0.62% | 10,798 | 1.61% | 84.8% |
| Kochi | C | ¥1,086 | +¥63 | 10/29 | 7,501 | 0.53% | 9,993 | 1.83% | 87.5% |
| Fukuoka | B | ¥1,114 | +¥57 | 10/4 | 10,867 | 0.33% | 13,518 | 1.22% | 91.2% |
| Saga | C | ¥1,095 | +¥65 | 11/15 | 6,791 | 0.61% | 20,183 | 0.93% | 85.4% |
| Nagasaki | C | ¥1,087 | +¥56 | 11/2 | 6,866 | 0.52% | 10,410 | 1.56% | 82.2% |
| Kumamoto | C | ¥1,092 | +¥58 | 12/1 | 7,158 | 0.51% | 16,844 | 1.00% | 85.9% |
| Oita | C | ¥1,096 | +¥61 | 11/1 | 6,642 | 0.58% | 18,265 | 0.97% | 83.6% |
| Miyazaki | C | ¥1,085 | +¥62 | 10/24 | 6,449 | 0.61% | 7,937 | 2.26% | 83.2% |
| Kagoshima | C | ¥1,090 | +¥64 | 10/25 | 6,236 | 0.65% | 10,577 | 1.75% | 77.4% |
| Okinawa | C | Pending (as of 2 Sep 2026) | 8,838 | — | 8,533 | — | 88.7% | ||
Supply and demand conditions — the room to pass costs through is already there
Having established the size of the adjustment required, it is worth checking whether conditions actually allow it to be put into rates. The short answer is that, viewed from the demand side, they do.
First, rates are already rising. Comparing the 12-month average of prefecture-level estimated settled ADR (median) with the same period a year earlier, business hotels are up 5.8% and ryokan up 4.3%. Against median required pass-through of 0.50% and 1.22% respectively, the past year’s rate growth is roughly 11.6x what the business hotel needs and 3.5x what the ryokan needs. This revision fits comfortably inside the rate trend already under way.
Second, inventory is selling through strongly. Estimated occupancy for June to August 2026 (OTA-listed inventory basis) had a prefecture-level national median of 86.2%, and even the lowest prefecture was at 77.4%. That figure includes the summer peak and should be discounted accordingly, but at least for now the risk of losing demand by adjusting price into thin inventory is limited.
Third, the labor market itself is beginning to loosen. The perceived shortage of non-regular staff in the ryokan and hotel sector has improved for three consecutive years, suggesting the peak of hiring difficulty has passed. Hourly wages are rising, but securing the headcount needed is becoming easier — which means the extra revenue from a higher occupancy ceiling automatically absorbs part of the wage increase. The effect is largest at properties that had been restricting the rooms they put on sale for want of staff. How labor constraints set the ceiling on occupancy is addressed head-on in Only Hotels That Capture Demand Survive: 2026’s Occupancy Ceiling.
The ¥1,500 national average scenario — implications for investment returns
Finally, look at the destination rather than the single year. The government has set a target of a ¥1,500 national weighted average minimum wage “in the first half of the 2030s.” From FY2026’s ¥1,176, that leaves +¥324, or +27.6%. Running that through the model properties gives the following.
| Item | 150-room limited-service business hotel | 80-room onsen ryokan |
|---|---|---|
| Annual labor hours | 45,434 hours | 56,526 hours |
| Rooms sold per year | 41,227 room-nights | 11,213 room-nights |
| FY2026 revision (+¥55) | ¥1.437mn/year | ¥1.788mn/year |
| Per room per year | ¥9,579 | ¥22,345 |
| Per occupied room-night | ¥34.9 | ¥159.4 |
| Required ADR pass-through (national median ADR basis) | 0.47% | 1.17% |
| Cumulative to ¥1,500 (+¥324) | ¥8.464mn/year | ¥10.531mn/year |
| Per room per year | ¥56,429 | ¥131,635 |
| Per occupied room-night | ¥205.3 | ¥939.4 |
| Required ADR pass-through (national median ADR basis) | 2.76% | 6.91% |
| Asset value equivalent on an NOI basis (5.0% cap rate) | ¥169mn | ¥211mn |
The last row is what bears directly on investment decisions. If the increase on the way to ¥1,500 cannot be built into rates, NOI falls by ¥8.46mn a year at the 150-room business hotel and ¥10.53mn at the 80-room onsen ryokan. Capitalised at a 5.0% cap rate, that equates to ¥169mn and ¥211mn of asset value respectively. Conversely, a property that does build the increase into its rates preserves ¥100-200mn of value in the same asset.
The required adjustment is 2.76% for the business hotel and 6.91% for the ryokan. Given that these are cumulative figures spanning several years, the annual rate works out at roughly 0.5% and 1.2%. Set against actual growth over the past 12 months (+5.8% and +4.3%), both are comfortably within reach. The question is not whether the cost can be passed through, but whether an annual rate revision has been built into operations as a standing process.
For asset management, three points are worth writing into the dialogue with the operator. First, establish each property’s actual near-minimum-wage share: the 30-70% band in this article translates directly into the margin of error in the budget. Second, reflect the effective dates, spread across October to December, correctly in the monthly budget — multi-prefecture portfolios ramp up in stages. Third, place the rate revision ahead of the effective date. Moving rates first produces a smoother quarterly NOI than chasing the revision after the fact.
Conclusion
The FY2026 minimum wage revision lifts the national weighted average by ¥55, or 4.9%. Recommendations are confirmed in 46 prefectures, taking effect progressively from October through December. Applied to a 150-room limited-service business hotel and an 80-room onsen ryokan, the added labor cost is ¥9,600 and ¥22,300 per room per year, or ¥35 and ¥159 per occupied room-night. The required ADR pass-through is 0.50% and 1.22% at the median — comfortably inside ADR growth of +5.8% and +4.3% over the past 12 months.
What drives the regional variation is rates, not wages. The range of increases is 1.20x; the range of business hotel ADR is 2.37x. As a result, required pass-through spans 2.7x, from 0.24% in Tokyo to 0.65% in Kagoshima, and Rank C prefectures carry the double bind of larger increases on lower rates. Those are the prefectures where rate design has the highest priority.
And unlike other cost items, labor accumulates every year without fail. The ¥35 in a single year is small, but built up to the government’s ¥1,500 target it reaches ¥56,400 per room per year for the business hotel and ¥131,600 for the ryokan — equivalent to ¥169mn and ¥211mn of asset value at a 5.0% cap rate. Levelled out, that is 0.5% and 1.2% a year. For a property that can run an annual rate revision as a standing process, this line item takes care of itself. Which is also to say it is where the greatest room for design remains.
Related reading
- Hotel Water & Sewer Costs Vary 2.1x by Municipality: ¥7.85mn NOI Gap (cost-structure series, part 1)
- Only Hotels That Capture Demand Survive: 2026’s Occupancy Ceiling
- Face Recognition Check-In: Survival Strategy for Mid-Size Business Hotels (80 vs 150 Room GOP Simulation)
- Hotel Labor Cost Pass-Through vs Bankruptcy: ADR Tipping Point 2026
- Japan Minimum Wage 2026: Chiba & Aichi ¥1,195, Oct 1-15 Rollout
References and sources
■ Data sources
Minimum wage recommendations and effective dates are from the recommendation of the Ministry of Health, Labour and Welfare’s Central Minimum Wages Council (28 July 2026) and figures published by each Prefectural Labour Bureau (as of 2 September 2026; 46 prefectures reported). Room rates are estimated settled ADR by prefecture and segment (12-month average for September 2025 to August 2026, N=32-913 business hotels and N=17-501 ryokan per prefecture) and estimated occupancy is on an OTA-listed inventory basis (average for June to August 2026), both compiled by MetroEngines Research & Consulting. The room occupancy rates used to derive rooms sold per year for the model properties are from the Japan Tourism Agency’s Overnight Travel Statistics Survey, calendar 2025 annual figures (preliminary).
■ Calculation assumptions
Model A = 150-room limited-service business hotel (45,434 annual labor hours, 22.7 full-time equivalents, 41,227 room-nights sold per year). Model B = 80-room onsen ryokan with dinner and breakfast (56,526 hours, 28.3 FTEs, 11,213 room-nights). Labor input per occupied room-night is 1.10 hours for Model A and 5.04 hours for Model B. The near-minimum-wage share is 50% in the base case (with 30% and 70% shown alongside), and the statutory benefits coefficient is 1.15 (employer social insurance contributions and the knock-on effect on premium pay). Required ADR pass-through = the increase (¥ per hour) × labor hours per occupied room-night × the near-minimum-wage share × 1.15, divided by estimated settled ADR. Asset value equivalents use a 5.0% cap rate.
■ Limitations and caveats
The labor hours and staffing mix of the model properties are assumptions, and actual labor input varies widely by property. The variable that most affects the result — the share of labor hours worked near the minimum wage — is property-specific, and this article shows a sensitivity range of 30-70%. Estimated settled ADR is derived from OTA published rates; cross-checked against property-level actuals disclosed by listed hotel REITs (91 properties, most recent three months), the median error is approximately 7%, and the figures differ from each property’s actual transacted rates and accounting figures. Estimated occupancy is based on how OTA-listed inventory is absorbed and is defined differently from a property’s actual whole-house occupancy. Okinawa was still awaiting its recommendation as of 2 September 2026 and is excluded from the required pass-through calculations rather than estimated. This article addresses the rate pass-through of labor as a cost line item; the payback period on labor-saving capital expenditure, recruitment costs and optimisation of the labor share are outside its scope.
■ Market data
- MetroEngines Research & Consulting — estimated settled ADR (by prefecture and segment, September 2025 to August 2026) and estimated occupancy (OTA-listed inventory basis, June to August 2026)
■ Minimum wage and wage statistics
- Ministry of Health, Labour and Welfare, “National list of regional minimum wages” / Central Minimum Wages Council, “Guideline for revising regional minimum wages, FY2026” (recommendation of 28 July 2026)
- Recommendations published by each Prefectural Labour Bureau’s Regional Minimum Wages Council (as of 2 September 2026, 46 prefectures)
- FY2026 minimum wages by prefecture and recommendation status (Terada Tax and Social Insurance Consulting Office, updated 1 September 2026)
- Ministry of Health, Labour and Welfare, “Summary of the 2025 Basic Survey on Wage Structure” (scheduled cash earnings of ¥277,200 in accommodation and food services)
- Ministry of Health, Labour and Welfare, “Monthly Labour Survey” (FY2025, part-time worker ratio)
- Deliberations of Okinawa’s minimum wage subcommittee (Ryukyu Shimpo)
■ Government statistics
- Japan Tourism Agency, “Overnight Travel Statistics Survey (calendar 2025 annual figures, preliminary)” (room occupancy: 61.8% overall / 75.3% business hotels / 74.2% city hotels / 56.9% resort hotels / 38.4% ryokan)
- Japan Tourism Agency, “Overnight Travel Statistics Survey, calendar 2025 annual figures (preliminary)” press release (PDF)