

When the industry talks about hotel supply, it almost always looks at the opening list. But an opening list is a record of supply after it has already been decided. The indicator that is usable for investment decisions is fixed two to three years earlier — construction starts. This article takes the floor area of newly started accommodation-use buildings from Japan’s Ministry of Land, Infrastructure, Transport and Tourism (MLIT) “Statistical Survey on Building Construction Starts” for 2011 through 2024 by prefecture, converts it into room counts, and re-ranks all 47 prefectures by “supply depth” as a share of existing stock.
A word on how this differs from our earlier work. Our study of wooden hotel construction — where the cost per square metre came to 62.8% of reinforced concrete and the reachable height stopped at three storeys — uses the same construction-start statistics, but its axis is unit cost by structure type; this article reads volume by prefecture and over time, regardless of structure. Hotel Build Times: 2.80-Year Median, 1.96 Solo vs 4.00 Mixed-Use is cited here as the time-conversion coefficient — a connection, not a duplication. Hotel Supply Pressure Ranking 2026-2027 works on an opening basis for 2026-2027, whereas this article works on a construction-start basis and lands further out, in 2025-2028. The time axes are different.
Metric Definitions Used in This Article
- Floor area started: total floor area (m²) under use category “52 Accommodation” and work type “new construction” in MLIT’s “Statistical Survey on Building Construction Starts.” It counts buildings on which work has begun after building confirmation, and does not mean completion or opening.
- Accommodation use: a mid-level category of the construction-start statistics. It is the major category “M Accommodation and Food Service buildings” less the food-service portion. This article uses that mid-level category throughout. It includes ryokan, simple lodgings and corporate retreats, and excludes properties built as housing and later converted to lodging.
- Floor area per room: gross floor area ÷ number of rooms (m²/room). It divides the whole building — corridors, lobby, baths, kitchen, plant rooms and all other common areas included — by one room. This article places the median of 35.0 m²/room at the centre and uses ±20% (28.0-42.0 m²/room) as the sensitivity range.
- Estimated rooms: floor area started ÷ floor area per room. Treated as a range, not a point estimate.
- Supply depth (share of existing stock): estimated rooms ÷ that prefecture’s existing room count × 100 (%). The denominator is the total rooms of lodging facilities MetroEngines Research has confirmed to be operating.
- Construction period: the span from start to completion. Median 2.80 years; 1.96 years for hotel-only use and 4.00 years for mixed use (measured in our earlier study, N=56).
- Data source: MLIT “Statistical Survey on Building Construction Starts” (government statistics code 00600120, as published as of January 2026), compiled by MetroEngines Research & Consulting.
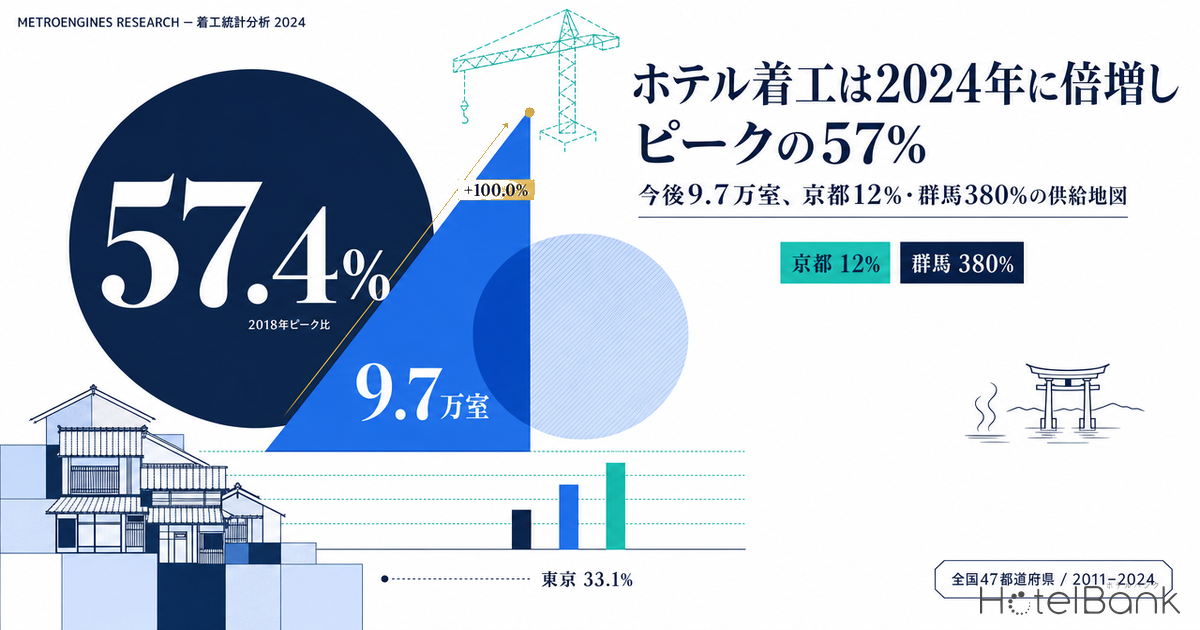
- — Floor area started for new accommodation-use buildings reached 1,597,784 m² in 2024, up 100.0% year on year. Even so, the level is only 57.4% of the 2018 peak of 2,783,484 m².
- — Starts in 2022-2024 convert to roughly 97,000 rooms (81,000-121,000). Against existing stock of 1.267 million rooms that is 7.7%, or just under 2% a year when spread evenly.
- — The centre of gravity has switched. Against the previous cycle, the cities have shrunk — Kyoto 12%, Kanagawa 19%, Osaka 23% — while onsen and regional markets have overtaken it: Gunma 380%, Nagasaki 341%, Gifu 229%.
- — In 2024 alone, Tokyo accounted for 33.1% of the national total (528,573 m²). At 9.42% of existing stock, that is 2.6 times the national average of 3.60%. On a 2.80-year build, it lands in the first half of 2027; on a 4.00-year mixed-use build, in 2028.
- — Cost per square metre is up 73.4% from 2018 (¥334,576 → ¥580,144/m²). Volume may be 57% of peak, but the capital required for the same floor area is 1.7 times as much.
Conclusion — starts doubled in 2024, yet sit at 57% of the 2018 peak
Floor area started for new accommodation-use buildings fell 71.3% from the 2018 peak of 2,783,484 m² to 798,772 m² in 2023. Then 2024 came in at 1,597,784 m² — exactly double the prior year. The increase is real, but the level is only 57.4% of the peak. Applying the 2.80-year median from start to completion, the stock started between 2022 and 2024 comes on line progressively from 2025 through 2028. Divided by 35.0 m² per room, that total is roughly 97,000 rooms (range 81,000-121,000), equal to 7.7% of the existing 1.267 million rooms. Spread evenly, that is just under 2% a year — a volume that sits on the absorbable side as long as demand grows faster than 2% a year. Whether added supply actually pushes rates down depends on market size; Does New Hotel Supply Cut ADR? tests that threshold across all 47 prefectures.
The national average, though, is the least important number in this article. Open it up by prefecture and the centre of gravity of construction starts has moved somewhere entirely different from the late 2010s. Kyoto’s 2022-2024 starts shrank to 12% of its 2017-2019 level; Kanagawa came in at 19%, Osaka 23%, Aichi 25% and Fukuoka 27% — the former inbound battlegrounds all fell to around a fifth. Running the other way, Gunma reached 380%, Nagasaki 341%, Gifu 229% and Kagoshima 186%, with onsen regions and regional hubs well above the previous cycle.
National trend — the 2018 peak, the 2023 trough, and the 2024 doubling
Start with the national time series. From 375,830 m² in 2011 to 2,783,484 m² in 2018, the previous cycle swelled 7.4-fold in seven years. The 2.26x jump in 2016 is a discontinuity, and it marks the moment the surge in inbound visitors fed through into construction decisions.
The shape of the downturn is telling too. Starts turned down 18.8% in 2019, then fell for five straight years — 1,658,189 m² in 2020, 1,222,406 m² in 2021, 1,002,592 m² in 2022 and 798,772 m² in 2023. The trough was not the pandemic year but 2023. Construction starts are not decided once demand returns; decisions taken when demand collapsed show up in the numbers two to three years later. The 2023 trough is a copy of the 2020-2021 investment decisions, and the 2024 doubling reads as projects revived around 2022 finally reaching building confirmation.
Unit cost moved in one direction throughout. Planned construction cost per square metre rose from ¥334,576 in 2018 to ¥580,144 in 2024, up 73.4% — from ¥1.11 million to ¥1.92 million per tsubo. While volume sits at 57% of the 2018 level, the capital needed for the same floor area is 1.7 times higher. Volume recovery and capital intensity are moving separately, so reading the recovery in floor area as “investment is back” is premature. On total planned construction cost, 2024’s ¥926,946 million already matches 2018’s ¥931,288 million.
Converting floor area into rooms — a 35.0 m²/room assumption with ±20% sensitivity
Floor area started is not directly usable for an investment decision; it has to be converted into rooms, and that conversion coefficient largely determines the accuracy of the estimate. Measuring 31 hotel-only projects totalling 6,025 rooms from MLIT building-plan data, we found a median floor area per room of 35.0 m²/room, with an interquartile range of 18.2-63.2 m²/room (from our study putting the construction cost of one hotel room at ¥20.67 million, back-calculated from those 31 plans). Separately, testing 294 facilities of 20 rooms or more that we have confirmed to be operating, opened since 2015 and with registered gross floor area, the room-weighted coefficient is 36.8 m²/room — 30.3 m²/room for business hotels, 74.6 m²/room for city hotels and 78.3 m²/room for resort hotels.
Conversion assumptions and sensitivity (please read)
- Central case: 35.0 m²/room (median of 31 building plans; consistent with 36.8 m²/room across the 294 facilities opened since 2015 that we measured)
- Sensitivity range: ±20% = 28.0-42.0 m²/room. The smaller the coefficient, the higher the estimated room count. The lower bound therefore uses 42.0 m²/room as the divisor and the upper bound uses 28.0 m²/room.
- The coefficient depends heavily on the mix of formats. In urban markets with a high share of business hotels the coefficient is smaller (so the same floor area yields more rooms); in areas weighted towards ryokan and resorts it is larger. Prefecture-level estimates must not be treated as standalone point estimates.
- “Accommodation use” in the construction-start statistics includes corporate retreats, training facilities and simple lodgings that never reach the market as sellable rooms. The estimated room counts therefore sit on the high side of market supply.
On those assumptions, dividing the national 2022-2024 total of 3,399,148 m² gives a central case of 97,119 rooms and a range of 80,932-121,398 rooms. Adding the time axis, at the 2.80-year median this cohort completes between the end of 2025 and the end of 2027; at 1.96 years for hotel-only use it lands in 2024-2026, and at 4.00 years for mixed use in 2026-2028. Isolating 2024 starts alone gives 1,597,784 m² = 45,651 rooms (38,042-57,064), and that is the core of the volume reaching the market from the second half of 2026 through 2028.
The prefecture pipeline — the top five hold 50.0%, Tokyo alone 19.3%
Line up 2022-2024 floor area started by prefecture and the concentration is striking. Tokyo 655,657 m² (19.3% of the national total), Hokkaido 338,951 m² (10.0%), Okinawa 294,789 m² (8.7%), Osaka 226,372 m² (6.7%) and Nagasaki 184,238 m² (5.4%) — the top five account for 50.0% of the country and the top ten for 64.5%. Given that those same top five hold 31.3% of national room stock, construction starts are far more skewed than the existing distribution.
Break it down by project count and the same floor area means very different things. Tokyo built its 655,657 m² from 114 projects — 5,751 m² each — and Osaka’s 226,372 m² came from just 29 projects, or 7,806 m² each. Okinawa, by contrast, spread 294,789 m² across 249 projects, only 1,184 m² each. Cities run on a small number of large schemes, while Okinawa, Hokkaido, Yamanashi and Kagoshima run on many small ones. The same word “supply” conceals completely different investment granularity and barriers to entry.
Supply depth against existing stock — Nagasaki 30.2%, Okinawa 19.8%, national average 7.7%
Large markets naturally dominate in absolute terms, so the next step is to normalise by existing room stock. Re-sorting by “supply depth” — estimated rooms divided by each prefecture’s existing rooms — produces a completely different ranking.
Nagasaki leads at 30.2% (25.1-37.7%), nearly four times the national average. That figure needs care, though. Of Nagasaki’s 184,238 m² over three years, 174,879 m² — 94.9% — is concentrated in nine projects started in 2022, leaving only 2,309 m² in 2023 and 7,050 m² in 2024. On the 2.80-year median, those 2022 starts land around the end of 2024, so that supply is already in the market or nearly through. Nagasaki’s forward pipeline is in fact thinner than the national average.
Okinawa is the opposite: 19.8% (16.5-24.7%) accumulated evenly across three years — 136,930 m² in 2022, 77,128 m² in 2023 and 80,731 m² in 2024. That is a continuous flow, not a one-off event. Hokkaido likewise reaches 11.7% while spreading 338,951 m² across 304 projects, and it re-accelerated in 2024 with 185,687 m². The two resort regions fall short of their previous-cycle levels (Okinawa 43%, Hokkaido 56%), but in terms of investment continuity they are the steadiest in the country.
Tokyo’s 11.7% is the product of large absolute volume offset by a deep existing stock of 160,298 rooms. At 1.5 times the national average of 7.7%, it sits on the absorbable side in pure volume terms. As shown below, however, Tokyo’s starts are heavily concentrated in 2024, so the distribution over time is anything but even.
The shift in centre of gravity — Kyoto 12%, Gunma 380%, and a reversal against the last cycle
This is where the sharpest implication sits. Comparing 2017-2019 floor area started (the peak three years of the previous cycle) with 2022-2024, recovery rates scatter across a range of more than tenfold between prefectures.
The bottom of the table is made up of exactly those areas where hotel construction concentrated in the late 2010s. Kyoto went from 779,507 m² to 94,902 m², or 12%; Kanagawa from 427,703 m² to 79,722 m², 19%; Osaka from 980,890 m² to 226,372 m², 23%; Aichi from 297,037 m² to 74,782 m², 25%; and Fukuoka from 370,196 m² to 98,202 m², 27%. Enough floor area was built in the previous cycle, and both land acquisition costs and construction costs have risen, so new starts no longer pencil out. For holders of existing assets, that means new competitive entry is structurally suppressed.
The top of the table has an entirely different cast. Gunma went from 19,836 m² to 75,280 m², or 380%; Nagasaki from 54,066 m² to 184,238 m², 341%; Gifu from 24,877 m² to 56,881 m², 229%; Kagoshima from 29,773 m² to 55,426 m², 186%; Tochigi from 49,778 m² to 80,437 m², 162%; and Nagano from 78,920 m² to 97,555 m², 124%. These are prefectures with onsen regions — Kusatsu and Ikaho, Hida, Nikko and Nasu, Ibusuki and Kirishima. Where the previous cycle was a construction boom in urban limited-service lodging, this cycle has its centre of gravity in onsen and regional resorts.
That reversal shows where investment opportunity now sits. In the cities, the relative value of acquiring and repositioning existing assets has risen above new development; in regional onsen areas, new construction has come back as a realistic option. At the same time, anyone investing in a regional onsen market needs a supply-demand read that allows for neighbouring competitors opening at a higher density than in the previous cycle.
Do high-volume prefectures build expensively? A +0.47 correlation and the skew in capital intensity
Next, the relationship between planned construction cost per square metre and volume by prefecture. Across the 34 prefectures with at least 20,000 m² of starts in 2022-2024, the correlation between floor area started and cost per m² is +0.466, and between existing room stock (log) and cost per m² it is +0.520. The more a prefecture builds, and the larger its market, the more capital goes into each square metre.
In absolute terms Osaka is highest at ¥752,138/m² (¥2.49 million per tsubo), followed by Kagawa at ¥725,881/m², Kanagawa at ¥680,521/m², Tokyo at ¥586,620/m² and Hokkaido at ¥565,454/m². At the low end sit Wakayama at ¥244,083/m² (¥810,000 per tsubo), Ehime at ¥274,801/m² and Mie at ¥293,969/m². Highest to lowest is a 3.1x spread.
Translated into investment language: Osaka, Kanagawa and Tokyo have few starts but large floor area per project and high cost per m². In other words, entry only works there at large scale and high specification. Conversely, the prefectures growing against the previous cycle — Gunma, Tochigi, Kagoshima, Nagano — sit in a band of ¥360,000-560,000/m², leaving room to enter with less capital committed. “Supply is increasing” in both cases, but the order of magnitude of capital required is different.
Kagawa stands out at ¥725,881/m², second only to Osaka. The volume is small — 34,212 m² across 27 projects in three years — but it is concentrated recently, with 25,752 m² across 13 projects in 2024 alone, and supply depth against its 10,828 existing rooms reaches 6.8% from that single year. This is the pattern of high-cost floor area concentrating in a small market, and it reads as an answer to a gap at the upper end of the rate range.
What lands between late 2026 and 2028 — Tokyo takes 33.1% of the country
A three-year cumulative total is an average of the past, not a statement about what comes next. Applying build times and narrowing to what has not yet landed, 2024 starts become the critical cohort. At the 2.80-year median that means the first half of 2027; at 4.00 years for mixed use, 2028.
Of the national 1,597,784 m² started in 2024, Tokyo accounts for 528,573 m², or 33.1%. Against Tokyo’s 59,663 m² in 2022 and 67,421 m² in 2023, that is close to an eightfold jump, and dividing by 57 projects gives 9,273 m² each — the equivalent of 265 rooms. Building confirmations for large schemes clearly clustered in this one year. Supply depth from 2024 starts against the existing 160,298 rooms is 9.42%, 2.6 times the national average of 3.60%.
It would be too quick, though, to simplify this into “supply is concentrating in Tokyo.” First, large mixed-use schemes lean towards the 4.00-year build, so completion stretches into 2028 rather than landing in a single year. Second, Tokyo holds 12.7% of national stock and is the market with the greatest absorption capacity on both occupancy and rate. The 9.42% figure is a volume that distributes over three years at roughly 3% supply growth a year. For the distribution of Tokyo’s supply pressure opened down to ward level, Tokyo 23 Wards Supply Pressure 2026 sets it out as a share of existing stock.
After Tokyo come Kagawa at 6.80%, Hokkaido 6.40%, Yamanashi 5.91%, Okinawa 5.42%, Shimane 4.85%, Okayama 4.58%, Saitama 4.57%, Kumamoto 4.51% and Osaka 4.34%. Nagasaki, which led on the three-year cumulative measure, drops to 1.15% here, and Okinawa, third cumulatively, slips to 5.42%. The prefectures at the top change between the three-year cumulative view and the 2024 single-year view. Which cohort you are looking at when you read a pipeline determines the conclusion.
Prefecture data table — floor area started, estimated rooms, supply depth
| Prefecture | 2022-24 floor area started | Projects | Estimated rooms (central) | Sensitivity range | Existing rooms | Supply depth | Cost per m² | vs previous cycle |
|---|---|---|---|---|---|---|---|---|
| Tokyo | 655,657 m² | 114 | 18,733 | 15,611-23,416 | 160,298 | 11.7% | ¥586,620 | 51% |
| Hokkaido | 338,951 m² | 304 | 9,684 | 8,070-12,105 | 82,854 | 11.7% | ¥565,454 | 56% |
| Okinawa | 294,789 m² | 249 | 8,423 | 7,019-10,528 | 42,577 | 19.8% | ¥505,808 | 43% |
| Osaka | 226,372 m² | 29 | 6,468 | 5,390-8,085 | 93,041 | 7.0% | ¥752,138 | 23% |
| Nagasaki | 184,238 m² | 31 | 5,264 | 4,387-6,580 | 17,445 | 30.2% | ¥435,548 | 341% |
| Chiba | 110,994 m² | 191 | 3,171 | 2,643-3,964 | 44,241 | 7.2% | ¥398,868 | 57% |
| Fukuoka | 98,202 m² | 56 | 2,806 | 2,338-3,507 | 49,132 | 5.7% | ¥374,926 | 27% |
| Nagano | 97,555 m² | 180 | 2,787 | 2,323-3,484 | 45,283 | 6.2% | ¥387,085 | 124% |
| Kyoto | 94,902 m² | 67 | 2,711 | 2,260-3,389 | 43,967 | 6.2% | ¥519,717 | 12% |
| Shizuoka | 91,357 m² | 102 | 2,610 | 2,175-3,263 | 47,250 | 5.5% | ¥436,313 | 65% |
| Tochigi | 80,437 m² | 155 | 2,298 | 1,915-2,873 | 20,406 | 11.3% | ¥494,066 | 162% |
| Hyogo | 79,953 m² | 166 | 2,284 | 1,904-2,855 | 35,607 | 6.4% | ¥430,643 | 55% |
| Kanagawa | 79,722 m² | 59 | 2,278 | 1,898-2,847 | 42,982 | 5.3% | ¥680,521 | 19% |
| Gunma | 75,280 m² | 76 | 2,151 | 1,792-2,689 | 20,514 | 10.5% | ¥560,790 | 380% |
| Aichi | 74,782 m² | 25 | 2,137 | 1,781-2,671 | 49,112 | 4.4% | ¥518,416 | 25% |
| Gifu | 56,881 m² | 56 | 1,625 | 1,354-2,031 | 17,408 | 9.3% | ¥454,686 | 229% |
| Kagoshima | 55,426 m² | 109 | 1,584 | 1,320-1,980 | 20,514 | 7.7% | ¥369,355 | 186% |
| Yamanashi | 52,338 m² | 184 | 1,495 | 1,246-1,869 | 16,911 | 8.8% | ¥421,448 | 63% |
| Hiroshima | 49,768 m² | 45 | 1,422 | 1,185-1,777 | 25,385 | 5.6% | ¥413,131 | 36% |
| Kumamoto | 45,963 m² | 73 | 1,313 | 1,094-1,642 | 18,377 | 7.1% | ¥332,094 | 71% |
What is missing for reading 2028-2029
Every estimate above stops at 2024 starts. For construction statistics by prefecture and mid-level use category, December 2024 is the latest available as published in January 2026. A prefecture-level pipeline reflecting 2025 and 2026 starts does not yet exist. The prefecture-level picture of supply landing in 2028-2029 therefore cannot be drawn from this data, because working back from the 2.80-year median build, a 2028 completion corresponds to a 2025 start and a 2029 completion to a 2026 start. If you want to check the most recent ramp-up from the opening side rather than the start side, Japan 2026: 1,242 Openings, 33,749 Rooms covers the breakdown by format.
Direction alone can be read from the all-use aggregate. According to the construction-start statistics for calendar 2025 published by MLIT on 30 January 2026, floor area started across all buildings was 95.85 million m², down 6.7% year on year — a fourth consecutive annual decline. Private non-residential came to 33.08 million m², down 5.7%. The accommodation-use breakdown is not given in that release, but with non-residential as a whole trending down, it suggests 2025 starts may not have held the 2024 level. That said, accommodation use in 2024 grew an exceptional 100.0% year on year, and there is no guarantee it moves in the same direction as the all-use average.
On the limits of these estimates: the estimated room counts here are a mechanical conversion of floor area started divided by a per-room coefficient, not a build-up of individual project room counts. Plan changes, cancellations and use changes can occur between start and completion. “Accommodation use” in the construction-start statistics also includes corporate retreats, training facilities and simple lodgings that never reach the market as sellable rooms, so the estimates sit on the high side of market supply. Prefecture-level figures should not be treated as point estimates; use them for ranges and relative ranking. Construction statistics by prefecture are current only through December 2024 and do not reflect starts from 2025 onward.
Implications for investment decisions
Cities — acquisition beats new build on relative value
Kyoto 12%, Kanagawa 19%, Osaka 23%, Aichi 25%, Fukuoka 27%: in the previous cycle’s main battlegrounds, starts have shrunk to around a fifth. Cost per m² sits in the highest national band — Osaka ¥752,138, Kanagawa ¥680,521 — and the conditions under which new development works are narrow. For existing assets this is a phase in which new entry is structurally suppressed, raising the relative value of acquisition, repositioning and rebranding.
Onsen and regional resorts — room to enter, and competitive density
Gunma 380%, Nagasaki 341%, Gifu 229%, Kagoshima 186%, Tochigi 162%: prefectures with onsen regions are well above the previous cycle. At ¥360,000-560,000/m², entry with less capital committed is possible — but other operators are making the same judgement at the same time. Checking competitive density at the catchment level matters more here than any debate about the national average.
Time axis — which cohort are you looking at?
The leading prefectures differ between the three-year cumulative view and the 2024 single-year view. Nagasaki is 30.2% cumulatively but 1.15% in 2024 alone, so its supply has largely already landed. Tokyo, conversely, is 9.42% in 2024 alone, 2.6 times the national average. When discussing a pipeline, apply the build time — 2.80 years median, 1.96 hotel-only, 4.00 mixed-use — to pin down the completion year before comparing.
Taken nationally, the roughly 97,000 rooms started in 2022-2024 amount to 7.7% of existing stock, just under 2% a year. Assuming continued growth in inbound visitors and a recovery in domestic demand, that volume sits on the absorbable side. But investment decisions are not made at the national average. The centre of gravity of construction starts has clearly moved, and the same phrase — “supply is back” — means a partial recovery to a fifth of the previous level in the cities and three to four times the previous cycle in onsen regions. Opening up the construction-start statistics by prefecture and by year is the only way to see that difference two to three years before the opening lists are complete.
Related reading
- Hotel Build Times: 2.80-Year Median, 1.96 Solo vs 4.00 Mixed-Use
- Hotel Supply Pressure Ranking 2026-2027: Ozu Kumamoto Tops at 30.8%
- Hotel Development Capacity 2026: Zoning, FAR & Land Price in 5 Markets
- Tokyo 23 Wards Supply Pressure 2026: Arakawa 16.0%, Minato Just 4.5%
- Does New Hotel Supply Cut ADR? Only Below 13,000 Rooms, 47 Prefectures
- Japan 2026: 1,242 Openings, 33,749 Rooms — 47% Villas, 42% Business
- Hotel Builder Ranking 2026: Daiwa House 99 Projects, 55% Undecided
References and Sources
■ Data sources
Mid-level use category “52 Accommodation” and work type “new construction” from MLIT’s “Statistical Survey on Building Construction Starts” (government statistics code 00600120, as published as of January 2026) were aggregated nationally and by prefecture for 2011-2024. Existing room counts are the 27,249 lodging facilities and 1,266,919 rooms MetroEngines Research & Consulting has confirmed to be operating (as of September 2026). Floor area per room uses measured values from 31 building plans covering 6,025 rooms, together with a check against 294 facilities opened since 2015 with 20 rooms or more and registered gross floor area.
■ Calculation assumptions
Estimated rooms = floor area started ÷ floor area per room. The coefficient is 35.0 m²/room at the centre with a sensitivity range of ±20% (28.0-42.0 m²/room); the lower bound divides by 42.0 m²/room and the upper bound by 28.0 m²/room. Supply depth = estimated rooms ÷ that prefecture’s existing rooms × 100 (%). Completion years are estimated by adding the median build time of 2.80 years (1.96 years hotel-only, 4.00 years mixed-use, N=56) to the start year. The previous-cycle ratio = 2022-2024 floor area started ÷ 2017-2019 floor area started, limited to prefectures with at least 15,000 m² in both periods (N=35). Correlation coefficients were calculated across the 34 prefectures with at least 20,000 m² of starts in 2022-2024.
■ Limitations and caveats
Estimated rooms are a mechanical conversion of floor area started divided by a per-room coefficient, not a build-up of individual project room counts. Plan changes, cancellations and use changes between start and completion are not reflected. “Accommodation use” in the construction-start statistics includes corporate retreats, training facilities and simple lodgings that never reach the market as sellable rooms, so the estimates sit on the high side of market supply. Planned construction cost is the figure declared at building-confirmation stage and differs from the actual contract amount. Construction statistics by prefecture and mid-level use category are current only through December 2024 and do not reflect starts from 2025 onward. Prefecture-level figures should be used for ranges and relative ranking rather than as point estimates.
■ Government statistics
- e-Stat: Statistical Survey on Building Construction Starts (government statistics code 00600120) — “By use and work type / projects, buildings, floor area, planned construction cost,” annual (table ID 0003114493); “By use and client / buildings, floor area, planned construction cost,” annual (table ID 0003114490); “By prefecture and use (major category) / buildings, floor area, planned construction cost,” annual (table ID 0003114510). Mid-level use category “52 Accommodation,” work type “new construction,” 2011-2024, as published as of January 2026.
- MLIT, “Report on the Statistical Survey on Building Construction Starts (calendar 2025)” (published 30 January 2026)
- Same press release PDF (calendar 2025: 95.85 million m² started, down 6.7% year on year)
- MLIT, “Report on the Statistical Survey on Building Construction Starts — time-series index”
■ Our own data
- MetroEngines Research & Consulting — existing room stock (27,249 lodging facilities and 1,266,919 rooms confirmed to be operating, as of September 2026); measured floor area per room (294 facilities opened since 2015, 20 rooms or more, with registered gross floor area)
■ Earlier HotelBank articles cited as premises
- Hotel Build Times: 2.80-Year Median, 1.96 Solo vs 4.00 Mixed-Use (median build 2.80 years / 1.96 hotel-only / 4.00 mixed-use, N=56)
- Hotel construction cost of ¥20.67 million per room, back-calculated from a median floor area per room of 35.0 m² across 31 building plans (N=31)