

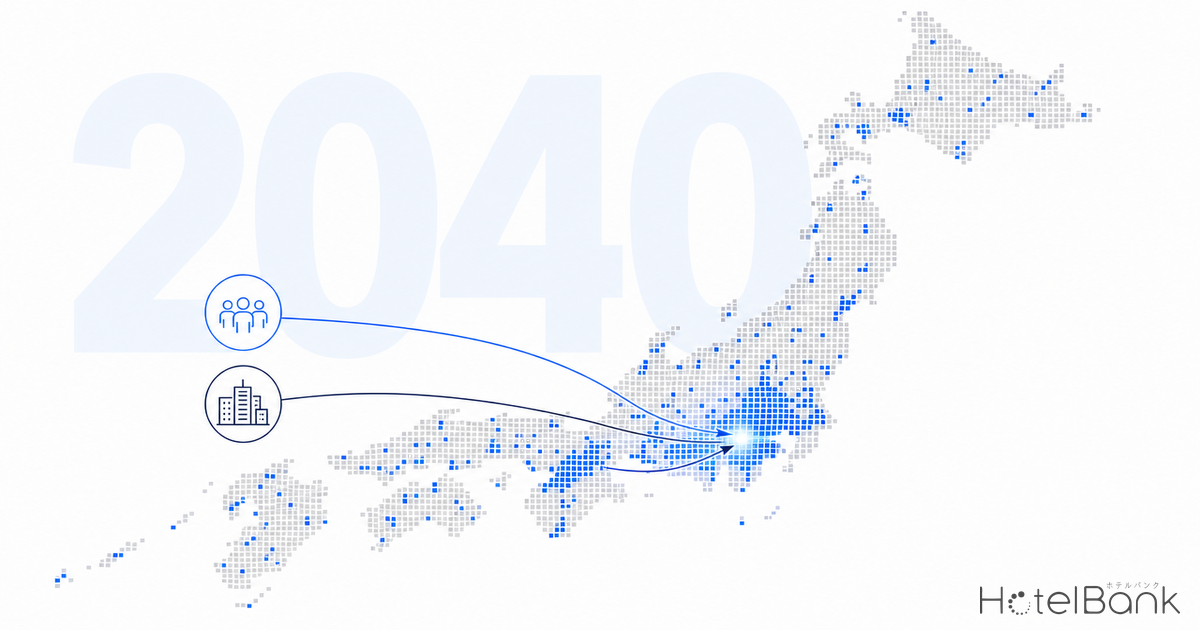
Long-term hotel demand is underpinned by both business demand (the working population) and the resident population that forms the base for leisure and stay demand. Looking toward 2040, when Japan’s population decline accelerates, we ran a mechanical screening of 24 major stations and development candidate sites nationwide to identify locations where both “resident population” and “employment concentration” grow together — the dual-growth mesh. Locations with diversified demand sources can sustain occupancy even when one source shrinks, which feeds directly into prioritizing the supply pipeline. In this article we cross-reference 250m-mesh future population projections with employment data from the Economic Census to quantify a ranking of prime development sites.
Metric Definitions Used in This Article
- Resident population growth rate: The 2025→2040 rate of change in the 250m-mesh future population projection. Mesh cells within a 1.5km radius of each site’s center coordinates are aggregated (Source: MLIT National Land Numerical Information). This is resident population (Census basis), not staying or passing population.
- Employment concentration: The number of workers within a 1km radius of each site’s center coordinates. Boundaries follow the 2020 Census small areas (Source: MIC / METI Economic Census-Activity Survey 2021). Employment data tends to be understated for regional cities.
- Dual-growth mesh: A location that satisfies both conditions — the 2040 resident population exceeds 2025 (resident growth), and the number of workers within a 1km radius is 40,000 or more (employment concentration).
- Existing hotel supply: The total number of guest rooms across facilities confirmed in operation by MetroEngines Research within a 1.5km radius.
- Data sources: MLIT National Land Numerical Information, MIC / METI Economic Census, MetroEngines Research & Consulting
- — Of 24 major sites nationwide, 17 (71%) qualified as a “dual-growth mesh” where both resident population and employment concentration grow toward 2040.
- — The top dual-growth score went to Hamamatsucho / Shibaura (81.3). With resident growth of +20.9%, 285,000 workers, and a 44.0% office ratio, its demand diversification is the deepest.
- — The top ranks concentrate in Tokyo’s bayfront (Hamamatsucho, Tamachi, Shinagawa, Toyosu, Kachidoki) and the two major Kansai hubs (Umeda, Umekita), consistent with real-world redevelopment pipelines.
- — Measured by existing rooms per 10,000 workers, Toyosu (183 rooms), Musashi-Kosugi (188 rooms), and Tamachi (289 rooms) have tight supply, leaving substantial room for limited-service entrants.
- — This metric is a first-pass filter for extracting demand diversification and supply gaps. It connects to an investment decision only after scrutinizing zoning, land prices, and building regulations.
Why “Dual Growth” Creates Long-Term Demand Resilience
Hotel demand broadly divides into business (corporate travel / MICE) and leisure / stay. The former is supported by the surrounding employment concentration, while the regional depth of the latter is supported by the resident population. As many major stations head toward shrinking resident populations by 2040, locations where both grow simultaneously can be described as having diversified demand sources. Even if one side of demand contracts due to the business cycle or tourism trends, the other supports occupancy — making such locations highly resilient for development and acquisition premised on long-term holding.
Of the 24 sites screened this time, 17 met the dual-growth conditions (2040 resident population exceeds 2025, plus 40,000 or more workers within a 1km radius). On the other hand, suburban new-town types where resident population grows but employment concentration is thin (Nagareyama-Otakanomori, Tsukuba), and mature city centers with employment concentration but resident populations turning to decline by 2040 (Hakata, Nagoya, Kyoto, Tennoji, Kumamoto), fall out of this ranking because their demand remains single-track. The difference between the two affects demand stability over a 20-year span after development. That said, even in declining mature city centers there are exceptions where major infrastructure such as the maglev pushes up employment demand; that structure is analyzed in detail in Nagoya’s Development Pipeline on the Eve of the Maglev, 2026-2033.
Screening Results — Top Dual-Growth Scores Cluster in the Bayfront and New Hubs
Ranking by a composite score of resident population growth rate, employment concentration, and office ratio, the top spot goes to Hamamatsucho / Shibaura (score 81.3). While the resident population grows +20.9% toward 2040, roughly 285,000 workers concentrate within a 1km radius, and the office ratio is high at 44.0%. The following Tamachi / Mita (66.1), Umeda (63.7), and Umekita / Osaka (60.3) also combine resident growth with massive employment concentration. The top scores cluster in Tokyo’s bayfront, where housing supply and business-hub restructuring overlap, and in Kansai’s two major hubs, Umeda and Umekita.
| Rank | Site | Resident pop. 2040 change | Workers (within 1km) | Office ratio | Score | Verdict |
|---|---|---|---|---|---|---|
| 1 | Hamamatsucho / Shibaura | +20.9% | 285,093 | 44.0% | 81.3 | Dual Growth |
| 2 | Tamachi / Mita | +17.2% | 227,995 | 35.9% | 66.1 | Dual Growth |
| 3 | Umeda | +10.1% | 334,187 | 26.5% | 63.7 | Dual Growth |
| 4 | Umekita / Osaka | +10.5% | 302,892 | 24.1% | 60.3 | Dual Growth |
| 5 | Kachidoki / Harumi | +22.3% | 59,239 | 37.5% | 55.9 | Dual Growth |
| 6 | Toyosu | +18.8% | 87,821 | 53.4% | 55.3 | Dual Growth |
| 7 | Shinagawa | +13.2% | 145,380 | 33.8% | 48.2 | Dual Growth |
| 8 | Shinjuku | +1.8% | 319,191 | 32.5% | 47.1 | Dual Growth |
| 9 | Shibuya | +4.6% | 239,796 | 39.4% | 44.0 | Dual Growth |
| 10 | Yokohama | +8.5% | 163,789 | 25.7% | 40.1 | Dual Growth |
| 11 | Namba | +7.5% | 134,031 | 15.2% | 32.9 | Dual Growth |
| 12 | Sapporo | +4.6% | 160,223 | 28.3% | 32.7 | Dual Growth |
| 13 | Osaka Tenma | +8.5% | 87,630 | 27.2% | 31.2 | Dual Growth |
| 14 | Fukuoka Tenjin | +3.8% | 153,899 | 27.8% | 30.3 | Dual Growth |
| 15 | Musashi-Kosugi | +9.4% | 44,193 | 36.0% | 29.2 | Dual Growth |
| 16 | Sendai | +3.3% | 138,252 | 24.6% | 26.9 | Dual Growth |
| 17 | Chiba Makuhari | +2.1% | 48,965 | 36.5% | 16.0 | Dual Growth |
Two-Axis Map — Location Structure by Resident Growth × Employment Concentration
Plotting the 2040 resident population change rate on the horizontal axis and the number of workers within a 1km radius on the vertical axis makes the structure of each location clearer. The upper-right quadrant (resident growth + large employment concentration) is where dual-growth locations sit, represented by Hamamatsucho/Shibaura, Tamachi/Mita, Umeda, Umekita/Osaka, and Shinagawa. In contrast, the lower-right (resident growth but thin employment concentration) holds suburban residential types like Nagareyama-Otakanomori and Tsukuba, while the left side (resident decline) is where mature city centers such as Hakata, Nagoya, Kyoto, Tennoji, and Kumamoto are distributed.
Confirming Demand Diversification — Population Trends at the Top 4 Sites
Looking at the resident population trends of the top dual-growth scorers — Hamamatsucho/Shibaura, Tamachi/Mita, Shinagawa, and Kachidoki/Harumi — a consistent upward trend is confirmed from 2025 to 2040. In particular, Kachidoki/Harumi and Hamamatsucho/Shibaura are projected to grow further not just toward 2040 but toward 2070 as well, indicating high demand durability over the very long term. These are sites where redevelopment of the former athletes’ village and bayfront housing supply take effect, characterized by employment concentration and resident growth progressing simultaneously within the same area.
The Gap with Existing Hotel Supply — Locations Where Rooms Are Thin Relative to Demand
Even in dual-growth locations, places that already have thick hotel supply make it hard for new entrants to differentiate. So, lining up the existing rooms per 10,000 workers (within a 1.5km radius) as a proxy for “supply density” surfaces locations where rooms are relatively thin relative to demand. Toyosu (183 rooms per 10,000 workers), Musashi-Kosugi (188 rooms), Tamachi/Mita (289 rooms), Shibuya (289 rooms), Yokohama (361 rooms), and Hamamatsucho/Shibaura (560 rooms) have tight existing rooms relative to massive employment demand, suggesting supply room in the limited-service and business segments. Meanwhile, Namba (3,461 rooms) and Osaka Tenma (1,770 rooms) grow in both resident and employment terms, but already have thick rooms and dense competition.
What matters here is that low supply density does not automatically mean a development GO. Depending on the location, demand may center on direct sales, groups, or corporate channels outside OTAs, making rooms appear thin on OTAs, or zoning and floor-area-ratio constraints may make development itself difficult. Thin supply density is a first-pass screen for extracting “locations where demand sources are diversified but rooms have not kept up,” and from there the practical procedure proceeds to scrutinizing individual zoning, land prices, and building regulations. For an analysis that actually decomposes a station-area pipeline into three layers — confirmed openings, under construction, and plans under review — Hotel Supply Pipeline Analysis Around Sendai Station is a useful reference.
Alignment with the Development Pipeline — Top Sites Are Actually Being Redeveloped
The top sites in this screening align with real-world large-scale redevelopment pipelines. In the Shinagawa area, JR East’s Takanawa Gateway City (Shinagawa Development Project Phase I) is opening in stages from 2025; JW Marriott Hotel Tokyo opened in October 2025, and complex Building II and a residential tower will join in spring 2026 to reach overall completion. Furthermore, the large-scale redevelopment of the Shinagawa Station West Exit district (scheduled for completion in FY2029 and FY2032) incorporates hotels, MICE, and housing, creating a structure that lifts both employment concentration and resident population.
In Kansai, in the Umekita / Umeda area, Grand Green Osaka (Umekita Phase 2) held its preliminary town opening in September 2024 and is being developed toward overall completion in FY2027. Top-tier brands such as Waldorf Astoria Osaka (252 rooms), Hotel Hankyu Gran Respire Osaka (482 rooms), and Canopy by Hilton Osaka Umeda (308 rooms) are concentrating, and the diversification of demand sources — integrating business, residential, and parkland — is being implemented. The fact that the locations ranked at the top of the screening are corroborated by both independent public statistics (population, employment) and actual development plans demonstrates the validity of this method.
Land price trends across Tokyo as a whole are also a tailwind. In the 2025 land price announcement, commercial land in central districts showed double-digit increases, and redevelopment areas including Shinagawa Ward also saw high growth (Source: MLIT 2025 [Reiwa 7] Land Price Announcement). While rising land prices push up acquisition costs, they also restrain new supply and ease the competitive environment for existing assets; locations with diversified long-term demand are thought to have the potential to absorb this increase through rents and room rates. For a method of working backward from land prices and ADR to read the feasibility threshold for hotel development on a site, see Hotel or Condo — Reverse-Calculating Site-Competition Feasibility and the ADR-Viable Land-Price Map.
How to Read the Screening Results — Three Location Types
① City-Center / New-Hub Type (Top Priority)
Hamamatsucho, Tamachi, Shinagawa, Umeda, Umekita. Resident growth + massive employment concentration + actual redevelopment pipeline. Demand is doubly thick — a prime site for top-tier brands and large-scale development. Acquisition costs are high but long-term resilience is the strongest of the types.
② Bayfront / Growth-Residential Type (Large Supply Room)
Toyosu, Kachidoki/Harumi, Musashi-Kosugi. Resident growth rates are extremely high (+18 to 22%), and the office share of employment is also high. Existing rooms are thin, suggesting supply room for limited-service. Long-term regional depth from housing supply is a strength.
③ Single-Track / Scrutiny-Required Type (Conditional)
Namba, Fukuoka Tenjin, Sapporo, Sendai. They qualify as dual-growth but supply density is on the higher side. Scrutinize differentiation concepts and upside in occupancy individually. Declining mature city centers (Hakata, Kyoto, Nagoya, etc.) require demand evaluation on a different axis.
Conclusion — Make “Demand Diversification” the Axis of Development Priority
Mechanically screening 24 sites nationwide narrowed dual-growth locations — where both resident population and employment concentration grow toward 2040 — down to 17. The top ranks are Hamamatsucho/Shibaura, Tamachi/Mita, Umeda, Umekita/Osaka, Kachidoki/Harumi, Toyosu, and Shinagawa, concentrated in Tokyo’s bayfront and Kansai’s two major hubs. These are corroborated by both independent public statistics and real-world redevelopment pipelines, making them a diagnostic axis usable for prioritizing development and acquisition premised on long-term holding.
That said, this screening is no more than a first-pass filter for extracting demand diversification and existing supply gaps. An actual investment decision requires scrutiny of individual factors such as zoning, floor-area ratio, land prices, construction costs, and disaster risk, along with a detailed feasibility study. Rather than uniformly excluding locations where demand remains single-track, it is preferable to read “why it does not meet dual growth (resident decline, or thin employment?)” and connect that to demand evaluation and concept design suited to each location.
Note on the data: Resident population is an estimate based on MLIT’s 250m-mesh future population projection (R6 NIPSSR estimate) and is resident population (Census basis). It does not include staying or passing population. Employment data is based on the Economic Census (2021) and tends to be understated for regional cities. Namba’s resident growth rate is +7.5% on a 1.5km-radius aggregation (ward-level aggregation may yield a different value). Because the supply density metric is based on the room count of facilities confirmed in operation on OTAs, facilities centered on direct sales may appear thinner than reality.
Related Reading
- Hotel Supply Pipeline Analysis Around Sendai Station
- Nagoya’s Development Pipeline on the Eve of the Maglev, 2026-2033
- Hotel or Condo — Reverse-Calculating Site-Competition Feasibility and the ADR-Viable Land-Price Map
- The Supply Vacuum from Frozen Plans — Cancelled and Postponed Hotel Developments and Their Investor Implications
- The Hotel Investment Potential of Japan’s Five “Second-Tier” Regional Government-Ordinance Cities
References & Sources
■ Data Sources
Resident population is aggregated within a 1.5km radius from the center coordinates of each site from MLIT National Land Numerical Information “250m-mesh future population projection” (R6 NIPSSR estimate). Employment concentration is the number of workers within a 1km radius from MIC & METI “Economic Census-Activity Survey (2021)” (boundaries = 2020 Census small areas, e-Stat statistical GIS). Existing hotel supply is the total room count of facilities confirmed in operation by MetroEngines Research & Consulting within a 1.5km radius. The redevelopment pipeline is based on each operator’s public materials and public statistics.
■ Calculation Assumptions
The dual-growth score is a relative index synthesized by normalizing three metrics: resident population growth rate, employment concentration (workers within 1km), and office ratio. The dual-growth mesh criterion is “2040 resident population exceeds 2025” and “40,000 or more workers within a 1km radius.” Supply density uses existing rooms per 10,000 workers as a proxy, with 600 rooms set as the rough threshold for the supply-room line. The target is 24 major stations and development candidate sites nationwide (N=24).
■ Limitations & Caveats
Resident population is a Census-based estimate and does not include staying or passing population. Employment data tends to be understated for regional cities. Because supply density is based on facilities confirmed in operation on OTAs, facilities centered on direct sales, groups, or corporate channels appear thinner than reality. Aggregated values vary with the radius setting (resident 1.5km / employment 1km) (e.g., Namba’s resident growth rate is +7.5% within a 1.5km radius, a different value at the ward level). The score is a first-pass screening showing relative rank and does not substitute for individual scrutiny of zoning, floor-area ratio, land prices, construction costs, and disaster risk.
■ Market Data
- MetroEngines Research & Consulting — room count of facilities confirmed in operation within a 1.5km radius (existing hotel supply)
■ Government Statistics & Public Data
- MLIT National Land Numerical Information “250m-mesh future population projection” (R6 NIPSSR estimate)
- MIC & METI “Economic Census-Activity Survey (2021)” (boundaries = 2020 Census small areas, e-Stat statistical GIS)
- MLIT “2025 (Reiwa 7) Land Price Announcement”
■ News & Redevelopment Materials