

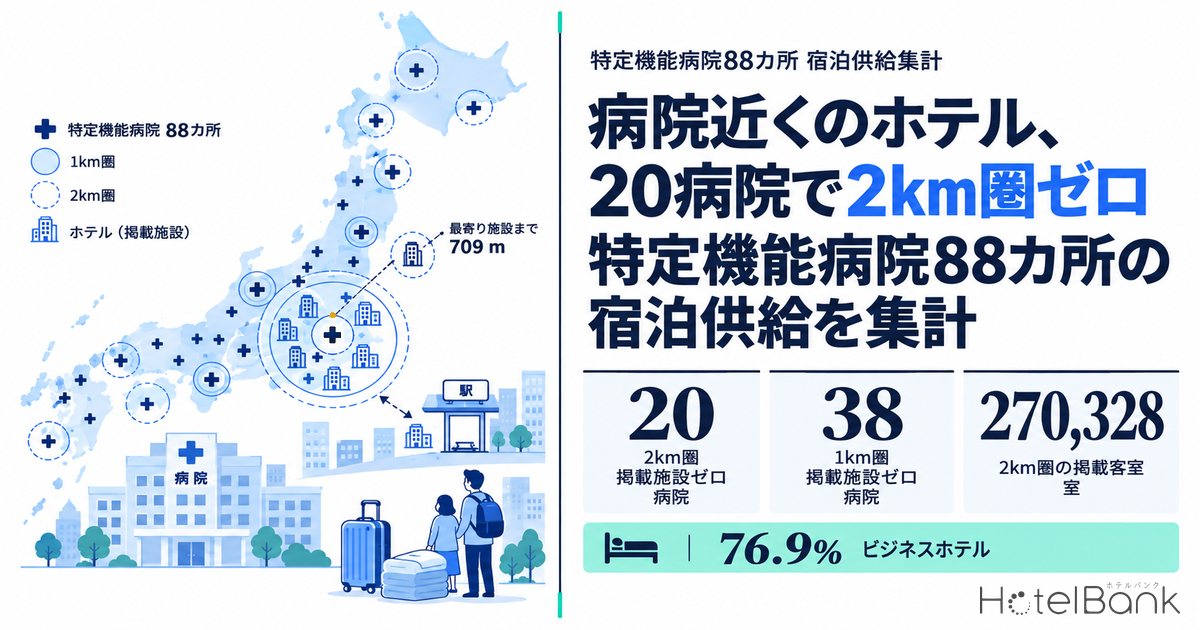
Hotel location is usually assessed along five axes: distance from the station, office concentration, tourist attractions, event venues, and retail clusters. This article adds a sixth axis, proximity to medical institutions. Taking all 88 Advanced Treatment Hospitals (特定機能病院) approved by the Ministry of Health, Labour and Welfare (MHLW) as the population, we count every unit of lodging supply within a 1km and 2km radius of each. Medical-related stays, such as accompanying a patient, traveling from afar for outpatient care, or staying the night before surgery, follow a different day-of-week pattern and length of stay than tourism demand. We want to establish, in numbers, where rooms exist for that demand today and where they do not.
Metric Definitions Used in This Article
- ADR (Average Daily Rate): Estimated contracted rate (tax-exclusive equivalent), calculated by applying segment-specific adjustment factors to the lowest published plan rate on OTAs and similar channels (2 guests per room, per-room price, tax-inclusive). Checked against property-level results disclosed by listed hotel REITs (91 properties, most recent 3 months), the median error is about 7%. These are estimates and differ from each property’s actual contracted prices and accounting figures. Area-level ADR is the median of the properties covered (the level of a typical property in the area).
- OCC (Occupancy Rate): Share of rooms sold out of total rooms in the area (estimate based on OTA sales inventory). In this article it is labeled “occupancy (OTA-listed inventory basis, estimate)”. It is an estimate based on how OTA inventory is being sold and differs from a property’s actual overall occupancy.
- Listed properties / listed rooms: Hotels and ryokan (business / city / resort / ryokan / deluxe / capsule) tracked by MetroEngines Research whose sales on OTAs were confirmed between January and August 2026. Guesthouses, pensions and minshuku are excluded. Properties not listed on OTAs are outside the scope of the count.
- Data sources: MetroEngines Research & Consulting / Ministry of Health, Labour and Welfare / MLIT Real Estate Information Library
- — 20 hospitals 20 of the 88 Advanced Treatment Hospitals have zero listed hotels within a 2km radius. Narrow it to 1km and the figure rises to 38, more than 40% of the total.
- — Median of 4-5 hotels The median 2km zone across the 88 hospitals holds 4-5 hotels and about 360 rooms. The mean of 33 hotels is simply pulled up by central-city university hospitals; the typical picture is thin.
- — 102.4% ADR within 2km of a hospital is 102.4% of the median for its city or ward (N=36 hospitals). Proximity to a medical institution does not currently command a rate premium.
- — Sunday 82.4% Nationwide, business hotel occupancy bottoms out on Sunday and Monday. Medical-related stays are weekday-centered, multi-night and rarely cancelled, so they fit naturally into this trough.
- — 3.1% to 4.7% The yield on a newly built 60-room hotel is 4.0-4.7% in the base case. If assumed ADR falls to the prevailing level in the host city, it drops to 2.9-3.1%, making renovation of existing properties the realistic option.
20 of the 88 Advanced Treatment Hospitals have not a single listed hotel within 2km
As of April 24, 2026
(overlapping zones deduplicated)
38 hospitals within 1km
Maximum 3,962m
(of 2,904 properties, gross)
According to the MHLW’s “Approval Status of Advanced Treatment Hospitals,” 88 facilities were approved as of April 24, 2026. Of these, 79 are Type A Advanced Treatment Hospitals, centered on main university hospitals; 4 are Type B, covering national centers for advanced and specialized medical care; and 5 are “other” Advanced Treatment Hospitals such as specialized cancer hospitals. We geocoded the addresses of all 88 and counted the lodging properties within circles of 1km, 2km, 3km and 5km radius centered on each hospital.
The results were sharply polarized. 20 hospitals have 50 or more listed hotels within 2km, while another 20 have none at all. Narrow the radius to 1km and 38 hospitals, over 40% of the total, have zero listed properties. The median across the 88 hospitals is just 4-5 hotels and about 360 rooms within 2km, far below the mean of 33 hotels. Central-city university hospitals pull the mean up; around a typical Advanced Treatment Hospital, there is no meaningful cluster of rooms.
The median distance to the nearest listed hotel is 709m, so the typical hospital has at least one hotel within a walk of just under 10 minutes. However, 23 hospitals are more than 1.5km away from the nearest one, and 6 are more than 3km away. For stays that involve carrying luggage and reaching the hospital by a set time, such as accompanying a patient or staying the night before, this difference in distance translates directly into a difference in convenience.
Nationwide map of listed supply: blue marks hospital zones with deep supply, red marks zero listed hotels within 2km
Circle size shows listed rooms within 2km and color shows depth of supply. University hospitals and cancer hospitals in the cores of the three major metropolitan areas all have deep supply, whereas zero-supply circles line up at national university hospitals that relocated campuses or sit in the suburbs, and at private medical university hospitals built on hillsides.
Nature of demand: weekday-centered, multi-night, low cancellation. The occupancy trough falls on Sunday and Monday
Medical-related lodging demand differs in character from tourism demand. Outpatient care, surgery and inpatient testing are scheduled on weekdays, so pre-stays and companion stays also skew toward weekdays. Stays follow hospitalization periods and treatment schedules, so they tend to be multi-night, and because itineraries are driven by necessity rather than plans, cancellations are rare. And since the purpose of the visit is not sightseeing, the demand is less affected by seasonality and weather. This article does not estimate the size of this demand, but its character can be summarized this way. Whether such demand can support a viable business depends on the model, and the conditions differ between hotels located near urban clinics and resort-style convalescence stays.
Next, let us check on which days of the week occupancy at existing business hotels thins out. Aggregating day-of-week occupancy (OTA-listed inventory basis, estimate; check-ins from May 7 to August 31, 2026) for business hotels nationwide, Saturday is highest at 91.9%, with troughs on Sunday at 82.4% and Monday at 85.3%. The gap between Saturday and Sunday is 9.5 points, and between Saturday and Monday 6.6 points.
| Prefecture | Mon | Tue | Wed | Thu | Fri | Sat | Sun | Sat – Sun (pt) |
|---|---|---|---|---|---|---|---|---|
| Tokyo | 90.4 | 93.4 | 94.4 | 94.6 | 93.5 | 94.9 | 90.0 | 4.9 |
| Osaka | 79.2 | 84.3 | 86.5 | 86.9 | 85.4 | 89.6 | 78.2 | 11.4 |
| Aichi | 82.9 | 87.2 | 88.7 | 89.0 | 87.2 | 89.3 | 79.5 | 9.8 |
| Fukuoka | 89.3 | 93.1 | 93.7 | 93.4 | 92.5 | 94.4 | 87.5 | 6.9 |
| Hokkaido | 88.9 | 92.8 | 94.0 | 93.7 | 90.9 | 92.9 | 85.7 | 7.2 |
| Miyagi | 86.4 | 91.3 | 92.5 | 93.1 | 92.3 | 95.1 | 85.5 | 9.6 |
| Hiroshima | 84.4 | 91.1 | 92.1 | 92.2 | 88.9 | 91.2 | 79.9 | 11.3 |
| Okayama | 85.9 | 90.9 | 92.5 | 92.3 | 87.8 | 90.8 | 80.5 | 10.3 |
The Sunday-Monday trough is the window when leisure demand has left and business demand has not yet started. Medical-related stays are, by nature, likely to occur in exactly this window. Note that the figures shown here are prefecture- and category-level, not occupancy within the hospital zones themselves. We are not directly observing occupancy in individual hospital-adjacent areas; we are reading the room for this demand to enter from prefecture- and segment-level data. How to close this trough is a question in its own right, and one that day-of-week occupancy data can help answer.
Top 15 hospital zones by supply: more than 20,000 rooms within 2km of central-city university hospitals
| hospitals | City / ward | 1km properties | 1km rooms | 2km properties | 2km rooms | 2km ADR | Business hotel share |
|---|---|---|---|---|---|---|---|
| Jikei University Hospital | Minato, Tokyo | 61 | 10,767 | 192 | 33,443 | ¥18,507 | 69% |
| National Cancer Center Hospital | Chuo, Tokyo | 81 | 13,997 | 181 | 29,545 | ¥19,446 | 73% |
| St. Luke’s International Hospital | Chuo, Tokyo | 56 | 8,283 | 172 | 28,409 | ¥19,616 | 76% |
| Osaka International Cancer Institute | Chuo, Osaka | 26 | 3,973 | 172 | 27,769 | ¥10,007 | 81% |
| Institute of Science Tokyo Hospital | Bunkyo, Tokyo | 55 | 7,286 | 205 | 25,885 | ¥13,887 | 83% |
| Sapporo Medical University Hospital | Chuo, Sapporo | 10 | 1,715 | 142 | 23,963 | ¥14,457 | 81% |
| Juntendo University Hospital | Bunkyo, Tokyo | 38 | 5,363 | 176 | 22,922 | ¥14,268 | 82% |
| Tokyo Medical University Hospital | Shinjuku, Tokyo | 59 | 13,570 | 139 | 21,709 | ¥14,653 | 82% |
| University of Tokyo Hospital | Bunkyo, Tokyo | 12 | 1,107 | 155 | 17,262 | ¥13,531 | 85% |
| National Center for Global Health and Medicine | Shinjuku, Tokyo | 7 | 569 | 127 | 14,015 | ¥14,443 | 83% |
| Keio University Hospital | Shinjuku, Tokyo | 6 | 982 | 101 | 13,711 | ¥16,115 | 68% |
| Osaka Metropolitan University Hospital | Abeno, Osaka | 62 | 6,939 | 117 | 13,045 | ¥8,001 | 87% |
| Hokkaido University Hospital | Kita, Sapporo | 15 | 2,445 | 59 | 11,518 | ¥14,111 | 68% |
| Kyoto University Hospital | Sakyo, Kyoto | 7 | 540 | 128 | 9,901 | ¥16,066 | 55% |
| Hiroshima University Hospital | Minami, Hiroshima | 0 | 0 | 64 | 8,810 | ¥9,826 | 84% |
The top of the ranking is occupied by hospitals in central Tokyo, Osaka and Sapporo. By listed rooms within 2km, Jikei University Hospital leads with 33,443 rooms, followed by National Cancer Center Hospital with 29,545 and St. Luke’s International Hospital with 28,409. All of them already sit amid large business and tourism demand, and medical demand is absorbed as just one of many sources. In this tier, product design targeted at medical-related stays is unlikely to show up in pricing.
Put the other way, proximity to a medical institution matters as a location factor in hospital zones that lack other demand generators. We look at those next.
20 hospitals with no listed hotel within 2km: where is the room for new supply?
| hospitals | Address | Nearest property | Within 3km | Within 5km |
|---|---|---|---|---|
| Fukushima Medical University Hospital | 1 Hikarigaoka, Fukushima City, Fukushima | 3,962 m | 0 properties / 0 rooms | 1 property / 16 rooms |
| Fukuoka University Hospital | 7-45-1 Nanakuma, Jonan-ku, Fukuoka | 3,718 m | 0 properties / 0 rooms | 6 properties / 365 rooms |
| Gifu University Hospital | 1-1 Yanagido, Gifu City, Gifu | 3,661 m | 0 properties / 0 rooms | 8 properties / 628 rooms |
| Jichi Medical University Hospital | 3311-1 Yakushiji, Shimotsuke, Tochigi | 3,508 m | 0 properties / 0 rooms | 1 property / 31 rooms |
| Asahikawa Medical University Hospital | 1-1-1 Midorigaoka-higashi 2-jo, Asahikawa, Hokkaido | 3,404 m | 0 properties / 0 rooms | 31 properties / 4,166 rooms |
| University of Fukui Hospital | 23 Matsuoka-Shimoaizuki, Eiheiji, Fukui | 3,138 m | 0 properties / 0 rooms | 3 properties / 274 rooms |
| Osaka University Hospital | 2-15 Yamadaoka, Suita, Osaka | 2,940 m | 2 properties / 308 rooms | 9 properties / 909 rooms |
| Aichi Cancer Center | 1-1 Kanokoden, Chikusa-ku, Nagoya, Aichi | 2,919 m | 1 property / 15 rooms | 20 properties / 1,366 rooms |
| Kagawa University Hospital | 1750-1 Ikenobe, Miki, Kagawa | 2,856 m | 1 property / 158 rooms | 3 properties / 293 rooms |
| Aichi Medical University Hospital | 1-1 Yazako-Karimata, Nagakute, Aichi | 2,739 m | 2 properties / 273 rooms | 9 properties / 438 rooms |
| University of Toyama Hospital | 2630 Sugitani, Toyama City, Toyama | 2,625 m | 1 property / 11 rooms | 1 property / 11 rooms |
| Hamamatsu University School of Medicine Hospital | 1-20-1 Handayama, Chuo-ku, Hamamatsu, Shizuoka | 2,590 m | 1 property / 62 rooms | 2 properties / 191 rooms |
| Oita University Hospital | 1-1 Idaigaoka, Hasama, Yufu, Oita | 2,542 m | 1 property / 20 rooms | 2 properties / 70 rooms |
| University of Miyazaki Hospital | 5200 Kihara, Kiyotake, Miyazaki City, Miyazaki | 2,504 m | 1 property / 21 rooms | 2 properties / 21 rooms |
| Kyorin University Hospital | 6-20-2 Shinkawa, Mitaka, Tokyo | 2,440 m | 2 properties / 301 rooms | 17 properties / 1,270 rooms |
| St. Marianna University Hospital | 2-16-1 Sugao, Miyamae-ku, Kawasaki, Kanagawa | 2,371 m | 3 properties / 94 rooms | 6 properties / 285 rooms |
| Akita University Hospital | 44-2 Hiroomote-Hasunuma, Akita City, Akita | 2,113 m | 16 properties / 2,744 rooms | 26 properties / 3,839 rooms |
| Shiga University of Medical Science Hospital | Seta-Tsukinowa-cho, Otsu, Shiga | 2,086 m | 3 properties / 262 rooms | 17 properties / 1,037 rooms |
| Kochi Medical School Hospital | 185-1 Kohasu, Oko-cho, Nankoku, Kochi | 2,053 m | 1 property / 23 rooms | 6 properties / 280 rooms |
| Fujita Health University Hospital | 1-98 Dengakugakubo, Kutsukake-cho, Toyoake, Aichi | 2,031 m | 2 properties / 73 rooms | 5 properties / 235 rooms |
These 20 hospitals share common location traits. One group is national university hospitals built together with their university campuses in the suburbs: Gifu University Hospital (Yanagido, Gifu City), University of Fukui Hospital (Eiheiji, Yoshida District), University of Toyama Hospital (Sugitani, Toyama City), University of Miyazaki Hospital (Kiyotake, Miyazaki City) and Kagawa University Hospital (Miki, Kita District), among others. The other group is private medical university hospitals on hillsides or in residential areas, including St. Marianna University Hospital (Sugao, Miyamae-ku, Kawasaki), Aichi Medical University Hospital (Nagakute), Fujita Health University Hospital (Toyoake) and Kyorin University Hospital (Shinkawa, Mitaka).
What is striking is how often supply is not absent but distant. Asahikawa Medical University Hospital has zero listed properties within 3km, yet 31 properties with 4,166 rooms within 5km, because supply is concentrated in front of Asahikawa Station. Akita University Hospital likewise has none within 2km but a solid 16 properties and 2,744 rooms within 3km. In other words, these cities have enough lodging supply overall, but it is clustered around the station, leaving a gap of 2-3km to the point of demand at the hospital. Within that distance lies room for existing properties to bridge the gap with shuttles and multi-night plans, and upside for developers in small properties placed closer to the demand point.
On the other hand, some hospitals, such as Fukushima Medical University Hospital with 1 property and 16 rooms even within 5km, or Jichi Medical University Hospital with 1 property and 31 rooms within 5km, fall in a different band. Here it is possible both that lodging supply does not form a viable market and that demand is dispersed to hospital-run accommodation or inns in neighboring municipalities; public OTA information alone cannot tell which. In fact, Hokkaido University Hospital, Asahikawa Medical University Hospital, Sapporo Medical University Hospital, Kyushu University Hospital and others have announced that they or affiliated organizations operate lodging for patients’ families (family houses), and such facilities are not included in this count.
Price levels in hospital zones are nearly identical to their cities: median 102.4%
Next, prices. For each hospital, we compared the median estimated contracted ADR of listed properties within 2km against the estimated contracted ADR of the city or ward where the hospital is located. The sample is the 36 hospitals with at least 5 properties in the zone and at least 10 properties on the city/ward side.
| hospitals | Comparison city / ward | 2km ADR | City/ward ADR | Ratio to city/ward | N in zone |
|---|---|---|---|---|---|
| Cancer Institute Hospital of JFCR (Ariake) | Koto, Tokyo | ¥18,514 | ¥12,884 | 143.7% | 9 |
| Nagasaki University Hospital | Nagasaki City | ¥12,088 | ¥9,171 | 131.8% | 23 |
| Kyoto University Hospital | Sakyo, Kyoto | ¥16,066 | ¥12,464 | 128.9% | 113 |
| National Cancer Center Hospital East | Kashiwa | ¥10,546 | ¥8,296 | 127.1% | 5 |
| Kanazawa University Hospital | Kanazawa | ¥11,670 | ¥9,322 | 125.2% | 13 |
| Shinshu University Hospital | Matsumoto | ¥15,110 | ¥12,538 | 120.5% | 35 |
| Jikei University Hospital | Minato, Tokyo | ¥18,507 | ¥15,849 | 116.8% | 170 |
| Hokkaido University Hospital | Kita, Sapporo | ¥14,111 | ¥12,902 | 109.4% | 57 |
| Juntendo University Hospital | Bunkyo, Tokyo | ¥14,268 | ¥13,184 | 108.2% | 161 |
| St. Luke’s International Hospital | Chuo, Tokyo | ¥19,616 | ¥18,478 | 106.2% | 155 |
| Tokyo Medical University Hospital | Shinjuku, Tokyo | ¥14,653 | ¥15,440 | 94.9% | 103 |
| Chiba University Hospital | Chuo, Chiba | ¥8,932 | ¥9,544 | 93.6% | 19 |
| Mie University Hospital | Tsu | ¥7,210 | ¥7,702 | 93.6% | 8 |
| National Center for Global Health and Medicine | Shinjuku, Tokyo | ¥14,443 | ¥15,440 | 93.5% | 92 |
| Kyushu University Hospital | Higashi, Fukuoka | ¥12,780 | ¥13,751 | 92.9% | 67 |
| Osaka International Cancer Institute | Chuo, Osaka | ¥10,007 | ¥10,771 | 92.9% | 152 |
| Tohoku University Hospital | Aoba, Sendai | ¥8,990 | ¥9,712 | 92.6% | 43 |
| Gunma University Hospital | Maebashi | ¥6,248 | ¥7,225 | 86.5% | 6 |
| Tottori University Hospital | Yonago | ¥5,870 | ¥7,127 | 82.4% | 22 |
| Shimane University Hospital | Izumo | ¥7,972 | ¥13,511 | 59.0% | 12 |
Across the 36 hospitals, the median ratio to the host city or ward is 102.4%, and 13 hospitals come in below the city/ward level. In other words, a location near a hospital does not currently show up as a clear price premium. Most of the variation is explained by the hospital’s location itself (near tourist areas or in front of a station), and at least at the area-aggregate level we could not confirm that the presence of a medical institution lifts rates.
There is a caveat to this reading. A 2km circle does not follow administrative boundaries, so for hospitals near ward borders in designated cities, the comparison city/ward is misaligned. Kyoto University Hospital’s 128.9% is measured against Sakyo Ward, but its 2km zone includes tourist-area properties in Higashiyama and Nakagyo Wards. The 143.7% for the Cancer Institute Hospital of JFCR (Ariake) also reflects waterfront hotels inside its 2km zone. Conversely, once such location factors are stripped out, it is reasonable to view the pure medical-proximity premium as effectively zero today.
Therein lies the revenue opportunity. Medical-related stays are multi-night and low-cancellation by nature, and they fall into the weekday and Sunday occupancy trough. Product design that explicitly targets this demand (multi-night rates, quiet rooms, laundry facilities) pays off not through price but through higher base occupancy and lower selling costs. The absence of a rate premium also means that headroom remains untouched.
Site assessment: development potential by zoning, floor area ratio and land price
Can properties actually be built in hospital zones with room for supply? From the MLIT Real Estate Information Library, we retrieved zoning, floor area ratio, published land price and nearest station for three representative sites. The results of measuring development capacity in major markets with the same framework are summarized in Hotel Development Capacity 2026: Zoning, FAR & Land Price in 5 Markets; reading the hospital zones in this article against that benchmark makes their position easier to grasp.
The difference in conditions across the three sites is extreme. The nearest published land price to Juntendo University Hospital (Hongo, Bunkyo) is ¥3.73M per square meter, up 19.6% YoY. Kyorin University Hospital (Shinkawa, Mitaka) is ¥461,000, up 4.5%, and Gifu University Hospital (Yanagido, Gifu City) is ¥56,300, flat YoY. The spread in land prices reaches about 66x. Meanwhile, all three sites are zoned residential, and floor area ratios are modest for lodging use: 300% even on the Bunkyo site, 200-300% in Mitaka and 200% in Gifu.
Kyorin University Hospital’s transport access deserves attention. The closest railway station within 3km is Tsutsujigaoka Station (Keio Line) at about 2,345m, followed by Sengawa Station at about 2,452m. Walking from a station is simply not feasible, and there is no listed hotel within 2km. On the conventional station-proximity axis the site scores low, but on the medical-proximity axis it is a position with no substitute.
Two-stage construction cost estimate
Consider a 60-room long-stay property (22 square meters per room, with a kitchenette and laundry). Assuming guest rooms account for 65% of the building, gross floor area is about 2,031 square meters (about 614 tsubo). We first estimate construction cost using 2025 actuals, then factor in inflation during the construction period.
| Item | A. Mitaka (Kyorin University Hospital zone) | B. Gifu (Gifu University Hospital zone) |
|---|---|---|
| Gross floor area | 2,031㎡ (614 tsubo) | 2,031㎡ (614 tsubo) |
| FAR (zoning) | 300% (Category 1 Residential) | 200% (Category 2 Residential) |
| Required site area | approx. 677㎡ | approx. 1,016㎡ |
| Published land price (nearest point) | ¥461,000/㎡ | ¥56,300/㎡ |
| Land acquisition cost (rough) | approx. ¥310M | approx. ¥60M |
| Construction cost (2025 actuals, ¥2.3M/tsubo) | approx. ¥1.41B | approx. ¥1.41B |
| Total investment (2025 actuals) | approx. ¥1.72B | approx. ¥1.47B |
| Construction cost (2029 opening, inflation-adjusted) | approx. ¥1.63B | approx. ¥1.63B |
| Total investment (inflation-adjusted) | approx. ¥1.94B | approx. ¥1.69B |
| Assumed ADR (long-stay specification assumption) | ¥12,000 | ¥13,000 |
| Assumed occupancy | 85% | 80% |
| Annual revenue | approx. ¥223M | approx. ¥228M |
| GOP (35% margin) | approx. ¥78M | approx. ¥80M |
| Yield (2025 actuals / inflation-adjusted) | 4.5% / 4.0% | 5.4% / 4.7% |
What this estimate shows is that construction cost is the bottleneck for entry via new builds. 2025 construction costs are at record levels, with an all-structure average of ¥1.952M/tsubo and ¥2.405M/tsubo for steel frame, well above the ¥1.413M/tsubo of 2022 (steel frame, nationwide). At a 60-room scale, construction accounts for 80-90% of total investment, and even in Gifu, where land is cheap, the yield only reaches the 5% range. Seen from the other side, persistently high construction costs also restrain new supply, an upside factor that eases the competitive environment for existing properties.
Sensitivity analysis: how far rate and occupancy assumptions move the yield
The yields above (Mitaka 4.0% / Gifu 4.7%, both on inflation-adjusted total investment) rest on two assumptions: assumed ADR and assumed occupancy. We examine how viability shifts when these two move, using three scenarios and a two-axis grid. For the assumed ADR in the downside case, we used the median estimated contracted ADR actually observed in each host city (Mitaka ¥9,950, 1 property counted / Gifu City ¥8,614, 32 properties counted, both January-August 2026). The range of occupancy reflects the day-of-week swing of business hotels in each prefecture (Tokyo 4.9 points, Gifu 12.2 points).
| Scenario | A. Mitaka (Kyorin University Hospital zone) | B. Gifu (Gifu University Hospital zone) | ||||
|---|---|---|---|---|---|---|
| Assumptions | Annual revenue | Yield | Assumptions | Annual revenue | Yield | |
| Downside ADR falls to observed level in host city | ¥9,950 / occupancy (assumed) 80% | approx. ¥174M | 3.1% | ¥8,614 / occupancy (assumed) 74% | approx. ¥140M | 2.9% |
| Base Assumptions used in this article (long-stay specification) | ¥12,000 / occupancy (assumed) 85% | approx. ¥223M | 4.0% | ¥13,000 / occupancy (assumed) 80% | approx. ¥228M | 4.7% |
| Upside Both rate and occupancy outperform | ¥13,200 / occupancy (assumed) 90% | approx. ¥260M | 4.7% | ¥14,300 / occupancy (assumed) 86% | approx. ¥269M | 5.6% |
The range is not small. Mitaka swings from 3.1% to 4.7%, and Gifu from 2.9% to 5.6%. Rate is the bigger lever: if assumed ADR falls to the prevailing level in the host city, the yield at both sites approaches or drops below 3%. Put differently, the fact that this estimate lands in the 4% range depends on the premise that a long-stay product can command rates above the local market. The multi-night, low-cancellation nature of the demand works on the occupancy side, but adding 5 points of occupancy improves yield by only 0.2-0.3 points. The drop when the rate assumption breaks is larger.
| Assumed ADR | Occupancy (assumed) 75% | Occupancy (assumed) 80% | Occupancy (assumed) 85% | Occupancy (assumed) 90% | Occupancy (assumed) 95% |
|---|---|---|---|---|---|
| ¥10,000 | 3.0% | 3.2% | 3.4% | 3.6% | 3.8% |
| ¥11,000 | 3.3% | 3.5% | 3.7% | 3.9% | 4.1% |
| ¥12,000 | 3.6% | 3.8% | 4.0% ★ | 4.3% | 4.5% |
| ¥13,000 | 3.9% | 4.1% | 4.4% | 4.6% | 4.9% |
| ¥14,000 | 4.1% | 4.4% | 4.7% | 5.0% | 5.3% |
| Assumed ADR | Occupancy (assumed) 70% | Occupancy (assumed) 75% | Occupancy (assumed) 80% | Occupancy (assumed) 85% | Occupancy (assumed) 90% |
|---|---|---|---|---|---|
| ¥9,000 | 2.9% | 3.1% | 3.3% | 3.5% | 3.7% |
| ¥10,000 | 3.2% | 3.4% | 3.6% | 3.9% | 4.1% |
| ¥11,500 | 3.7% | 3.9% | 4.2% | 4.4% | 4.7% |
| ¥13,000 | 4.1% | 4.4% | 4.7% ★ | 5.0% | 5.3% |
| ¥14,500 | 4.6% | 4.9% | 5.3% | 5.6% | 5.9% |
The more realistic route is conversion and renovation of existing properties. In hospital zones where medical demand can be expected, an existing business hotel or ryokan located closer to the hospital than to the station could be acquired and renovated to a long-stay specification, taking the same position for one-third or less of the investment of a new build. As a precedent, Mitsui Garden Hotel Kashiwa-no-ha Park Side (三井ガーデンホテル柏の葉パークサイド, 145 rooms) opened in July 2022 on the grounds of National Cancer Center Hospital East (Kashiwa, Chiba) and operates about 122m from the hospital. Partnerships between medical institutions and lodging operators are already a real option.
Product headroom: laundry facilities come up at 42.1% of properties
Finally, we use guest reviews to examine what kind of product properties near hospitals offer today. We compared how often topics appear in reviews for business and city hotels within 2km of Advanced Treatment Hospitals (properties with 150-1,200 reviews, N=1052 properties) against hotels in the same category nationwide (same conditions, N=808 properties).
Laundry facilities come up in reviews at 42.1% of properties within 2km of a hospital, versus 28.6% nationwide. Properties near hospitals are already slightly ahead in catering to long stays. Quietness is also mentioned at 97.6%, above the national 90.2%. On the other hand, breakfast buffets come up at 54.5%, below the national 68.4%, and only 15.2% of properties get mentions of an in-room refrigerator or kettle.
Flip that around, and about 60% of properties near hospitals do not get laundry facilities mentioned at all. For stays that assume multiple nights, laundry, simple cooking facilities, a quiet room and luggage storage after check-out can drive choice more than price. This is territory existing business hotels can capture without major room rebuilds, and the renovation opportunity here can be realized with relatively small investments, such as adding shared laundry or changing housekeeping operations for multi-night stays.
Supply The distance gap remains
20 of the 88 hospitals have no listed property within 2km, and 38 have none within 1km. A common pattern, as in Asahikawa and Akita, is that city-wide supply is deep but skewed toward the station, leaving 2-3km between it and the hospital.
Price No premium has formed
ADR within 2km of a hospital is 102.4% of the median for its city or ward (N=36 hospitals). There is no sign of medical proximity being priced in, so the headroom remains untouched.
Product Capturable through renovation
For new builds, construction costs in the ¥2.3M/tsubo range are the bottleneck. Adding laundry and shifting to multi-night operations at existing business hotels is the more realistic option in terms of return on investment.
Methodology and scope
The population is the 88 facilities listed in the MHLW’s “Approval Status of Advanced Treatment Hospitals (as of April 24, 2026).” Each facility’s address was geocoded using the Geospatial Information Authority of Japan’s location reference data, and lodging properties within circles of 1km, 2km, 3km and 5km radius centered on those coordinates were extracted from the MetroEngines Research property master. The count is limited to hotels and ryokan (business / city / resort / ryokan / deluxe / capsule) and excludes guesthouses, pensions, minshuku and simple lodging facilities.
Only properties whose sales on OTAs were confirmed between January and August 2026 were counted as listed properties. The master contains 4,369 properties (gross) within 2km, of which sales were confirmed for 2,904 (66.5%). Closed properties and properties not using OTAs fall outside the count. The room counts in this article are therefore a lower bound for rooms sold via OTAs, and actual lodging capacity exceeds them. Hospital-run lodging for patients’ families is also excluded.
ADR was calculated by taking the median of each property’s monthly estimated contracted ADR for January-August 2026, then taking the median again across the zone. The city/ward comparison value is the median estimated contracted ADR at the city/ward level for the same period. Occupancy is an OTA-listed inventory-based estimate at the prefecture × segment level and is not calculated for individual hospital zones.
Related Articles
References and Sources
■ Data sources
The population is the 88 facilities in the MHLW’s “Approval Status of Advanced Treatment Hospitals (as of April 24, 2026).” Each facility’s address was geocoded using the Geospatial Information Authority of Japan’s address geocoding, and lodging properties within 1km, 2km, 3km and 5km of those coordinates were extracted from the MetroEngines Research property master. Listed properties and rooms are limited to properties with sales confirmed on OTAs between January and August 2026 (of 4,369 properties, gross, within 2km, sales were confirmed for 2,904, or 66.5%). ADR is the median of each property’s monthly estimated contracted ADR, taken again as a median across the zone. Occupancy is an OTA-listed inventory-based estimate at the prefecture × segment level (check-ins May 7 to August 31, 2026); the national figure is a room-weighted average and the prefecture table is a simple daily average. Review metrics come from natural language analysis of guest reviews (last 24 months, compared among properties with 150-1,200 reviews; hospital 2km zones N=1052 properties / nationwide N=808 properties).
■ Estimate assumptions
The viability estimate uses common conditions of 60 rooms, 22 square meters per room and a 65% guest room ratio (gross floor area about 2,031 square meters, or about 614 tsubo). Construction cost is ¥2.3M/tsubo based on 2025 actuals; for the 2029 opening case, it is compounded to mid-2028 at assumed inflation rates (+5.3% in 2026, +5.0% in 2027, +4.5% assumed from 2028). Land cost is required site area × the 2026 published land price at the nearest point. The 35% GOP margin is a conservative value for a new opening, based on the 38.9% actual (fiscal period ended December 2024) for 91 operated properties disclosed by a listed REIT; yield = GOP ÷ total investment. The base case in the sensitivity analysis uses the assumptions in the main text; downside ADR is the median estimated contracted ADR of the host city (Mitaka ¥9,950, 1 property counted / Gifu City ¥8,614, 32 properties counted, January-August 2026); the occupancy range reflects the day-of-week swing of business hotels in each prefecture (Tokyo 4.9 points, Gifu 12.2 points).
■ Limitations
(1) Listed properties and rooms are a lower bound counting only properties with sales confirmed on OTAs. Properties not listed on OTAs, closed properties, and lodging for patients’ families run by hospitals or affiliated organizations are excluded. (2) Occupancy is an estimate at the prefecture × segment level and is not calculated for hospital zones. Statements about demand in this article are inferences from prefecture- and segment-level data. (3) A 2km circle does not follow administrative boundaries, so for hospitals near ward borders in designated cities, the city/ward used for ADR comparison is misaligned. Kyoto University Hospital’s 128.9% and the Cancer Institute Hospital of JFCR (Ariake)’s 143.7% include this effect. (4) The assumed ADR in the viability estimate is an assumption for a long-stay specification and exceeds the observed levels in the host cities (Mitaka ¥9,950 / Gifu City ¥8,614). If rates fall to those levels, the yield is 2.9-3.1%. (5) The size of medical-related lodging demand is not estimated; this article is limited to describing the distribution and price levels of supply.
■ Market data
- MetroEngines Research & Consulting — OTA listed price data (estimated contracted ADR), occupancy (OTA-listed inventory basis, estimate), property master (radius aggregation)
- HotelBank Editorial Team research — NLP analysis of guest reviews (last 24 months)
■ Government statistics and public data
- MHLW, “About Advanced Treatment Hospitals” (Advanced Treatment Hospital system)
- MHLW, “Approval Status of Advanced Treatment Hospitals (as of April 24, 2026)” list (PDF, Japanese)
- MLIT Real Estate Information Library — published land prices, zoning, passengers by station
- MLIT, “Statistics on Building Construction Starts”
- Geospatial Information Authority of Japan, GSI Maps data and API list (address geocoding)
■ Industry data and REIT disclosures
- Invincible Investment Corporation — portfolio / GOP results of operated hotels
- archi-book, “2025 Construction Cost per Tsubo Data”
- JLL, “Japan Hotel Investment Market 2025”
■ Case studies and related information