

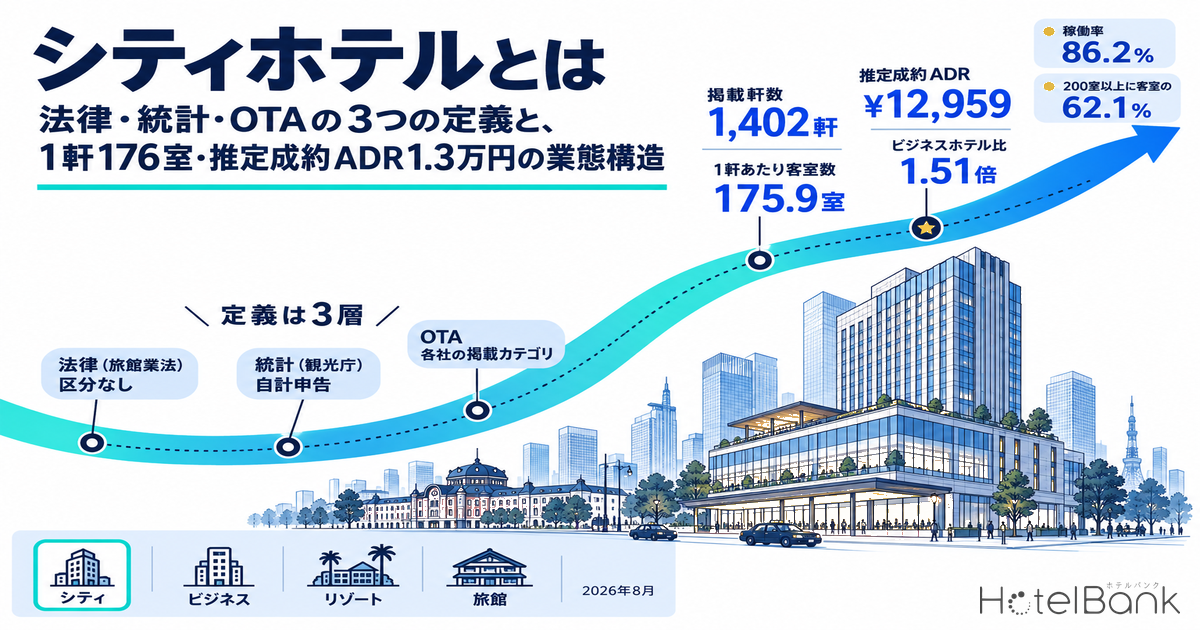
In Japan, a “city hotel” (シティホテル) is an industry convention for a full-service hotel located in an urban area that offers restaurants, banquet halls, bars and similar facilities in addition to guest rooms. However, the Hotel Business Act (旅館業法) contains no “city hotel” category; legally, both ryokan and hotels fall under a single license type, “Ryokan/Hotel Business.” In public statistics, the Japan Tourism Agency’s (JTA) Overnight Travel Statistics Survey (宿泊旅行統計調査) defines city hotels as one of its facility types, while OTAs and other booking sites classify properties using their own listing categories. In other words, the definition of a “city hotel” differs across three layers: law, statistics and OTAs. This article separates those three layers and then, using properties listed on major OTAs as the population, compares the number of listed properties, room scale, estimated settled ADR, occupancy and guest-review profile of city hotels, business hotels, resort hotels and ryokan, nationwide and across six major prefectures.
Metric Definitions Used in This Article
- ADR (Average Daily Rate): An estimated settled room rate (tax-excluded equivalent), calculated by applying property-type-specific adjustment factors to the lowest-plan price level each property publishes on OTAs (per room, two guests per room, tax included). Checked against property-level results disclosed by listed hotel REITs, the median error is about 7%. These are estimates and differ from each property’s actual settled prices and accounting figures. Area-level ADR is the median of the target properties (the level of a typical property in the area). This article refers to it as “estimated settled ADR.”
- Listed price: The average of all plans on OTAs (per room, two guests per room, tax included). This is a separate metric from estimated settled ADR and is used only where explicitly labeled “listed price (all-plan average, tax included).”
- OCC (Occupancy): The share of rooms sold out of total rooms in the area (an estimate based on OTA sales inventory). It is an estimate based on how OTA-sold inventory is absorbed and differs from a property’s actual overall occupancy. Because its definition and population differ from the room occupancy rate in the JTA Overnight Travel Statistics Survey, the levels of the two are not compared directly.
- Population: Approximately 27,000 domestic properties tracked by MetroEngines Research that are listed on major OTAs and confirmed to be operating. In this article, “listed properties” means properties with confirmed price listings for August 2026 stays, and “analyzed properties” means domestic properties for which an August 2026 estimated settled ADR could be calculated under our property-type classification (properties that could be matched to room counts and guest reviews). Because the classification basis differs from that of listed properties, the number of analyzed ryokan exceeds the number of listed ryokan. Ryokan, minshuku and simple lodging facilities not listed on OTAs are excluded.
- Data sources: MetroEngines Research (OTA price and inventory data), HotelBank Editorial Team research (guest reviews), JTA Overnight Travel Statistics Survey, e-Gov Law Search “Hotel Business Act”
- — Three layers of definition: The Hotel Business Act has no “city hotel” category; JTA statistics rely on facilities’ self-reporting (stratified by room count from the January 2026 survey onward); and OTAs decide via each site’s listing categories.
- — 175.9 rooms per property: At 1,402 listed properties, city hotels are the smallest of the four property types by count, but their average room count is about 1.6x that of business hotels (109.1 rooms), and 62.1% of their rooms sit in properties with 200+ rooms (August 2026).
- — Estimated settled ADR ¥12,959: 1.51x business hotels’ ¥8,586. The gap is narrower than the 1.7x seen in listed prices (all-plan average, tax included) (national, property median).
- — 86.2% occupancy: August 2026 occupancy (OTA-listed-inventory basis, estimated) clusters at 85.3–86.2% across all four types, a spread of less than 1pt.
- — Prefecture gaps exceed property-type gaps: City-hotel estimated settled ADR ranges about 3.0x across 41 prefectures, from Tochigi’s ¥7,057 to Tokyo’s ¥21,265 — wider than the 1.51x ratio between property types.
The Definition of “City Hotel” Splits into Three Layers — Law, Statistics and OTAs
The first point to establish is which system the term “city hotel” is grounded in. In short: the law provides no basis, statistics provide a definition, and OTAs each have their own classification. Because the three were not designed to align with one another, it is not unusual for the same property to be treated as a “business hotel” in the statistics and as a “city hotel” on an OTA.
| Layer | Basis | Treatment of “city hotel” | How the category is determined |
|---|---|---|---|
| Law | Hotel Business Act, Article 2 | No such category. Only three types: “Ryokan/Hotel Business,” “Simple Lodging Business” and “Boarding House Business” | Business license from the prefectural governor, etc. (structural and equipment standards) |
| Statistics | JTA Overnight Travel Statistics Survey | Hotels “located in urban areas other than resort hotels and business hotels” | Self-reporting (facilities answer themselves). From the January 2026 survey, the stratification basis changed from number of employees to number of rooms |
| OTAs | Each booking site’s listing categories | Each site assigns categories such as “city hotel.” We consolidate major OTAs’ categories at the property level | A combination of the property’s own declaration and each site’s classification criteria |
Source: Compiled by the HotelBank Editorial Team from e-Gov Law Search “Hotel Business Act,” JTA “Overview of the Overnight Travel Statistics Survey,” and MetroEngines Research
Layer 1: The Hotel Business Act has neither a “city hotel” nor even a “hotel” category. Article 2 of the Hotel Business Act defines the “hotel business” as “Ryokan/Hotel Business, Simple Lodging Business and Boarding House Business,” and defines “Ryokan/Hotel Business” as “a business that provides facilities and lodges people in exchange for accommodation fees, other than Simple Lodging Business and Boarding House Business.” The amendment that took effect on June 15, 2018 merged the previously separate “Hotel Business” (Western-style, 10+ rooms) and “Ryokan Business” (Japanese-style, 5+ rooms) and abolished the minimum room-count requirements. None of the terms city hotel, business hotel or resort hotel appears in the statute. “City hotel” is therefore not a license type; for licensing purposes, a ryokan and a luxury hotel both hold the same “Ryokan/Hotel Business” license.
Layer 2: JTA statistics split “hotels” into three types, and facilities choose for themselves. The JTA Overnight Travel Statistics Survey uses six facility types — ryokan, resort hotels, business hotels, city hotels, simple lodging facilities, and company/organization lodging — and defines hotels as follows: “resort hotels = built in leisure or recreational areas, mainly for tourists,” “business hotels = mainly for traveling business people,” and “city hotels = located in urban areas other than resort hotels and business hotels.” The survey uses self-reporting, so the type under which a facility responds is left to the facility’s judgment. Because city hotels are by definition a “residual” category, the system does not preclude an urban limited-service hotel from reporting as a city hotel, nor a full-service hotel from reporting as a business hotel.
In addition, from the January 2026 survey, the survey changed the stratification basis for target facilities from “number of employees” to “number of rooms.” Previously, facilities with 10+ employees were surveyed exhaustively, those with 5–9 at a one-third sampling rate, and those with 0–4 at a one-ninth rate. Under the new basis, establishments with 20+ rooms are surveyed exhaustively, and those with 1–19 rooms are sampled (with sampling rates set by prefecture). There are six strata — 1–9, 10–19, 20–39, 40–99, 100–199 and 200+ rooms — and the statistical tables present five bands, combining 1–19 rooms. The JTA cites as its reason that, amid various social changes, the correlation between number of employees and total guest nights has weakened, and it notes that year-over-year comparisons “may include the effects of the revision.” We examine what this change means in JTA Lodging Survey Switches Stratification from Staff to Room Count: A Data Read.
Layer 3: OTA listing categories are determined by property declarations and each site’s classification criteria. Booking sites assign properties to categories such as “city hotel,” “business hotel,” “resort hotel” and “ryokan,” but the criteria vary by site and are tied to neither the law nor the statistics. The figures shown below are based on a classification in which MetroEngines Research consolidates major OTAs’ listing categories at the property level. When readers check where their own property sits, it is worth confirming once whether the category declared in the statistics matches the category listed on OTAs; doing so allows the rate and occupancy benchmarks below to be applied correctly. This article leaves the guest-oriented question of how to choose a hotel aside and focuses on the structure of property types.
Scale — City Hotels Average 176 Rooms, with 62% of Rooms in 200+ Room Properties
Next, we compare the scale of the four property types on an OTA-category basis. The number of properties with confirmed price listings for August 2026 stays (listed properties) was 7,969 business hotels, 6,599 ryokan, 1,858 resort hotels and 1,402 city hotels. City hotels are the fewest of the four by count, but the picture changes when measured by rooms. Among analyzed properties (those for which an August 2026 estimated settled ADR could be calculated and room counts matched), city hotels total 1,151 properties and 202,445 rooms, an average of 175.9 rooms per property (median 132). Compared with business hotels at 109.1 rooms (median 89), resort hotels at 76.6 (median 39) and ryokan at 23.6 (median 14), city hotels are the largest property type per property.
| Property type | Listed properties (Aug 2026) | Analyzed properties | Total rooms | Avg. rooms per property | Median rooms | Est. settled ADR (median) | Listed price (all-plan avg., tax incl.) |
|---|---|---|---|---|---|---|---|
| City hotels | 1,402 | 1,151 | 202,445 | 175.9 | 132 | ¥12,959 | ¥26,975 |
| Business hotels | 7,969 | 7,761 | 845,778 | 109.1 | 89 | ¥8,586 | ¥15,875 |
| Resort hotels | 1,858 | 1,724 | 131,851 | 76.6 | 39 | ¥19,969 | ¥51,196 |
| Ryokan | 6,599 | 7,175 | 168,729 | 23.6 | 14 | ¥15,988 | ¥35,109 |
Source: Compiled by the HotelBank Editorial Team from MetroEngines Research (national, August 2026 stays. Listed properties and listed price are on a price-listing basis; analyzed properties and the columns after it are based on properties for which estimated settled ADR could be calculated, with average and median rooms per property calculated from those with confirmed room counts (7,750 for business hotels). Estimated settled ADR is the property median, tax-excluded equivalent; listed price is for two guests per room, tax included)
Applying this scale gap to the room-count bands the JTA adopted for its tables from the January 2026 survey (1–19, 20–39, 40–99, 100–199 and 200+ rooms) reveals what the statistical redesign means for each property type. For city hotels, 31.1% of properties and 62.1% of rooms belong to properties with 200+ rooms; widening to 100+ rooms, the share reaches 63.2% of properties and 88.2% of rooms. For business hotels, the 100–199 room band is the largest at 31.0% of properties, and together with 200+ rooms it covers 76.7% of rooms. Ryokan, by contrast, are concentrated in the small bands — 1–19 rooms at 64.0% and 20–39 rooms at 20.8% — with only 0.3% at 200+ rooms.
Source: Compiled by the HotelBank Editorial Team from MetroEngines Research (analyzed properties, N = city 1,151, business 7,761, resort 1,724, ryokan 7,175; August 2026)
Because properties with 20+ rooms are surveyed exhaustively under the new stratification, among our analyzed properties 97.2% of city hotels, 90.3% of business hotels and 70.8% of resort hotels fall into the exhaustive stratum. For ryokan the figure is only 36.0%; the remaining 64.0% (1–19 rooms) are subject to sampling. In other words, in statistics from 2026 onward, almost all city hotels and business hotels will be covered by the monthly questionnaire, and the effect of the sample-design change on aggregate figures will be concentrated among small ryokan and simple lodging facilities. This “nearly exhaustive” premise is worth keeping in mind when reading city-hotel occupancy by prefecture.
Rates — City Hotels’ Estimated Settled ADR Is ¥13,000, 1.51x Business Hotels
Rates are compared using “estimated settled ADR,” not “listed price.” The all-plan average listed price is ¥27,000 for city hotels and ¥15,900 for business hotels, a 1.7x gap, but unsold high-priced plans and meal-inclusive plans push the average up, so settled levels are lower. On estimated settled ADR checked against REIT-disclosed results (property median, tax-excluded equivalent), city hotels nationwide are at ¥13,000 and business hotels at ¥8,600, and the ratio narrows to 1.51x. Note that resort hotels (¥20,000) and ryokan (¥16,000) are property types where meal-inclusive stays are standard, so their product mix itself differs from city hotels, which center on room-only and breakfast-included stays. How to read the gap between listed prices and settled ADR is covered in What Is Hotel ADR? Settled Rates 34-57% of Listed Prices, 2026.
Source: Compiled by the HotelBank Editorial Team from MetroEngines Research (national, August 2026 finalized month. Estimated settled ADR is the property median, tax-excluded equivalent; N = city 1,151, business 7,761, resort 1,724, ryokan 7,175)
Breaking this down across six major prefectures confirms that location matters more than property type. City hotels in Tokyo have an estimated settled ADR of ¥21,300 (N=109), 1.6x the national median, and average 305.4 rooms per property (N=118), 1.7x the national average. Osaka’s city hotels, at ¥13,100 (N=97), are the lowest of the six prefectures, yet at an average of 255.5 rooms (N=98) Osaka has the most large properties after Tokyo. In Kyoto, city hotels at ¥19,700 (N=59) are matched by ryokan at ¥19,700 (N=202). Of the 41 prefectures where both types have at least 10 properties in the calculation, four — Aomori, Nagano, Shiga and Kyoto — have ryokan and city-hotel estimated settled ADRs within ±5% of each other, but Kyoto is the only one where both exceed ¥19,000. In Okinawa, resort hotels (¥22,300, N=282) dominate, and city hotels have a small base of N=15.
| Prefecture | City Est. settled ADR (N) | City Avg. rooms (N) | Business Est. settled ADR (N) | Business Avg. rooms (N) | Resort Est. settled ADR (N) | Ryokan Est. settled ADR (N) |
|---|---|---|---|---|---|---|
| Tokyo | ¥21,265 (109) | 305.4 (118) | ¥11,554 (915) | 134.4 (989) | ¥18,885 (21) | ¥11,878 (56) |
| Osaka | ¥13,078 (97) | 255.5 (98) | ¥8,772 (503) | 146.4 (556) | ¥19,697 (7) | ¥11,326 (36) |
| Kyoto | ¥19,662 (59) | 175.3 (64) | ¥9,993 (325) | 96.5 (364) | ¥18,260 (14) | ¥19,682 (202) |
| Fukuoka | ¥18,479 (41) | 183.8 (42) | ¥10,837 (341) | 127.4 (356) | ¥22,355 (14) | ¥12,152 (74) |
| Hokkaido | ¥17,801 (75) | 212.0 (76) | ¥11,328 (438) | 105.9 (448) | ¥19,240 (147) | ¥10,862 (293) |
| Okinawa | ¥20,654 (15) | 212.5 (15) | ¥9,734 (196) | 85.5 (207) | ¥22,291 (282) | ¥10,984 (17) |
| National (property median) | ¥12,959 (1,151) | 175.9 (1,151) | ¥8,586 (7,761) | 109.1 (7,750) | ¥19,969 (1,724) | ¥15,988 (7,175) |
Source: Compiled by the HotelBank Editorial Team from MetroEngines Research (August 2026 finalized month. Prefectural estimated settled ADR is the area median, tax-excluded equivalent, with N in parentheses being the number of properties in the calculation; N for average rooms is the number of analyzed properties matched to room counts. The national row uses property medians)
Rates and Absorption — Occupancy Differs by Less Than 1pt Across Types; the Gaps Arise by Prefecture
Do higher-priced property types absorb inventory more slowly? Aggregating occupancy (OTA-listed-inventory basis, estimated) for August 2026, the most recent finalized month, by property type with room weighting gives city hotels 86.2% (416 properties / 77,497 rooms, across the 20 prefectures where occupancy could be calculated), resort hotels 86.1% (902 properties / 71,083 rooms, 27 prefectures), business hotels 85.7% (3,650 properties / 443,196 rooms, 47 prefectures) and ryokan 85.3% (3,798 properties / 105,504 rooms, 46 prefectures). Against an all-type figure of 85.6% (12,447 properties / 770,573 rooms, all on a major-booking-site listing basis), the spread between types stays under 1pt. August is a peak month for every property type, and also a month in which differences in rate levels are less likely to show up as differences in absorption speed.
Looking by prefecture rather than by property type, the differences become clear. Hokkaido is the highest of the six prefectures, with city hotels at 91.4% (35 properties / 8,550 rooms) and business hotels at 90.9% (215 properties / 25,537 rooms), followed by Fukuoka with business hotels at 90.6% (173 properties / 22,306 rooms) and city hotels at 88.9% (22 properties / 3,158 rooms). In Tokyo, city hotels run at 87.2% (53 properties / 17,248 rooms) against business hotels’ 88.8% (529 properties / 77,776 rooms), meaning city hotels with an estimated settled ADR 1.8x higher achieve nearly the same absorption rate as business hotels. In Osaka, city hotels at 83.6% (35 properties / 8,016 rooms) exceed business hotels at 80.1% (282 properties / 47,378 rooms), and in Kyoto city hotels at 82.7% (34 properties / 4,948 rooms) slightly exceed both business hotels at 81.6% (185 properties / 18,949 rooms) and ryokan at 82.5% (101 properties / 1,941 rooms). The picture that emerges: city hotels in Hokkaido and Fukuoka sit at “high rates but faster absorption,” while those in Tokyo, Osaka and Kyoto sit at “high rates with comparable absorption.”
Source: Compiled by the HotelBank Editorial Team from MetroEngines Research (August 2026. Horizontal axis: estimated settled ADR (area median, tax-excluded equivalent); vertical axis: occupancy (OTA-listed-inventory basis, estimated); bubble size: rooms covered. City hotels and ryokan in Okinawa, and resort hotels in Osaka and Kyoto, are excluded because too few properties are under inventory observation to calculate occupancy)
Public statistics show the same pattern. In the JTA Overnight Travel Statistics Survey’s finalized 2025 annual figures, room occupancy was 61.6% overall, against 75.3% for business hotels, 74.1% for city hotels, 56.9% for resort hotels, 38.2% for ryokan and 29.6% for simple lodging facilities — the two urban types side by side at the top. By prefecture, city hotels and business hotels respectively ran at 77.2% and 81.5% in Tokyo, 79.4% and 82.9% in Osaka, 77.5% and 77.4% in Kyoto, 72.4% and 77.8% in Fukuoka, 74.5% and 76.1% in Hokkaido, and 68.2% and 77.2% in Okinawa. Our estimated occupancy on an OTA-listed-inventory basis is measured under a different definition — the absorption of OTA sales inventory in the single month of August 2026 — so the levels are not compared directly, but the structure “city and business hotels run side by side, and differences between prefectures exceed differences between property types” is common to both. Note that the JTA revises its preliminary figures when finalizing them, and the size of the revision varies by property type.
Guest Reviews — Average Scores of 4.23 for Ryokan and 4.00 for City Hotels; City Hotels Have the Most Reviews per Property
Finally, we add a profile of guest reviews by property type. Averaging the cumulative reviews (overall rating out of 5) of analyzed properties compiled by the HotelBank Editorial Team at the property level gives ryokan 4.23 (N=6,570 properties), resort hotels 4.11 (N=1,536), city hotels 4.00 (N=1,109) and business hotels 3.83 (N=7,340). Meanwhile, the median cumulative number of reviews per property is highest for city hotels at 4,078, followed by business hotels at 1,767, resort hotels at 1,034 and ryokan at 593. Larger city hotels have a deeper base of reviews, which tends to make their ratings more stable.
Source: HotelBank Editorial Team research (property-level average of cumulative overall ratings out of 5 for analyzed properties. N = ryokan 6,570, resort 1,536, city 1,109, business 7,340 properties)
By prefecture, the property-average score for city hotels is 4.27 in Okinawa (N=13), 4.26 in Kyoto (N=60), 4.23 in Tokyo (N=112), 4.07 in Osaka (N=92), 4.04 in Fukuoka (N=40) and 3.93 in Hokkaido (N=75), while the median cumulative reviews per property is deepest in the largest cities: 9,285 in Tokyo, 6,538 in Hokkaido and 6,161 in Osaka. Ryokan in Kyoto score 4.43 (N=207), the highest among the six prefectures, consistent with the finding that Kyoto’s ryokan match its city hotels on rate as well. For a closer look at evaluation axes by property type, category-level scores such as rooms, breakfast and location are worth examining alongside the overall rating.
Property-Type Structure by Prefecture and Aggregation Criteria — Prefecture Gaps in Rates Exceed Property-Type Gaps
We now extend the national figures and six-prefecture comparison to all 47 prefectures. Lining up each prefecture’s estimated settled ADR (area median) by property type, city hotels in the 41 prefectures with at least 10 properties in the calculation have a median of ¥10,730 and range about 3.0x, from a low of ¥7,057 in Tochigi to a high of ¥21,265 in Tokyo. The gap between prefectures within the same property type is larger than the 1.51x city-to-business ratio seen in national property medians. Taking the city-to-business ratio for each prefecture, city hotels exceed business hotels in all 41 prefectures, but the margin ranges from 1.02x in Tochigi to 2.12x in Okinawa, with a median of 1.36x. Ryokan estimated settled ADR exceeds that of city hotels in 29 of the 41 prefectures; in the majority of prefectures, ryokan, where meal-inclusive stays are standard, out-price city hotels, which center on room-only and breakfast-included stays.
| Property type | Est. settled ADR prefectures covered | 1st quartile | Median | 3rd quartile | Min–Max | Occupancy prefectures covered | Occupancy 1st–3rd quartile (median) |
|---|---|---|---|---|---|---|---|
| City hotels | 41 | ¥8,747 | ¥10,730 | ¥13,706 | Tochigi ¥7,057 – Tokyo ¥21,265 | 9 | 82.6–88.1% (86.4%) |
| Business hotels | 47 | ¥7,081 | ¥7,900 | ¥8,847 | Ehime ¥6,196 – Tokyo ¥11,554 | 46 | 82.7–89.2% (85.8%) |
| Resort hotels | 35 | ¥15,967 | ¥18,885 | ¥22,524 | Ibaraki ¥8,998 – Hiroshima ¥28,964 | 15 | 80.1–89.8% (87.2%) |
| Ryokan | 47 | ¥11,873 | ¥14,521 | ¥17,414 | Miyazaki ¥7,196 – Kanagawa ¥22,646 | 45 | 82.7–87.6% (85.0%) |
Source: Compiled by the HotelBank Editorial Team from MetroEngines Research (August 2026. Estimated settled ADR is the distribution, by property type, of each prefecture’s area median (tax-excluded equivalent), limited to prefectures with at least 10 properties in the calculation. Occupancy is on an OTA-listed-inventory basis (estimated), limited to prefectures with at least 20 properties covered. Quartiles are of prefecture-level values and use a different unit of aggregation from the national property medians in Table 2)
Occupancy (August 2026, OTA-listed-inventory basis, estimated) shows the same pattern. The prefecture-level interquartile range (1st to 3rd quartile) is 5.5pt for city hotels, 6.5pt for business hotels, 9.7pt for resort hotels and 4.9pt for ryokan, far exceeding the national gap between property types (under 1pt). Even when selecting benchmarks by property-type label, aligning the unit of comparison at the prefecture level (or a finer area) gives a truer picture.
The “analyzed properties” in this article are limited to those for which estimated settled ADR could be calculated and both room counts and guest reviews could be matched. Removing this condition and widening the population by number of price-observation days, city hotels’ average rooms per property stays within 175.9–187.7, and their estimated settled ADR ratio to business hotels within 1.51–1.55x (Table 5). City hotels’ position — “the largest per property, with rates around 1.5x business hotels” — does not depend on how the population is drawn.
| Aggregation criteria | City properties | City avg. rooms per property | City est. settled ADR (median) | Business est. settled ADR (median) | City ÷ Business |
|---|---|---|---|---|---|
| This article (estimated settled ADR calculable; matched to room counts and reviews) | 1,151 | 175.9 | ¥12,959 | ¥8,586 | 1.51x |
| Properties with estimates based on past sales results (no review matching) | 1,125 | 176.9 | ¥12,832 | ¥8,472 | 1.51x |
| Properties with 20+ days of price observations in August 2026 | 1,386 | 187.7 | ¥13,593 | ¥8,772 | 1.55x |
| Properties with 1+ day of price observations (broadest criteria) | 1,449 | 186.7 | ¥13,608 | ¥8,753 | 1.55x |
Source: Compiled by the HotelBank Editorial Team from MetroEngines Research (national, August 2026. Estimated settled ADR is the property median, tax-excluded equivalent. Average rooms calculated from properties with confirmed room counts. The three criteria other than this article’s do not require review matching)
Summary — Three Premises to Align When Using the Term “City Hotel”
First, because it is not a legal category, “city hotel” cannot serve as a basis for arguments in the context of business licenses, ordinances or taxation. Under the Hotel Business Act, ryokan and hotels alike are “Ryokan/Hotel Business.” Second, the statistical category is self-reported by facilities, and from the January 2026 survey it moved to room-count-based stratification. Under the new design, in which properties with 20+ rooms are surveyed exhaustively, nearly all city hotels (97.2% of analyzed properties have 20+ rooms) and business hotels are covered, and reading year-over-year comparisons requires factoring in the “effects of the revision” that the JTA itself notes. Third, city hotels on an OTA-category basis are a large, mid-priced, high-absorption property type — 175.9 rooms per property, estimated settled ADR of ¥13,000 and 86.2% occupancy (August 2026, OTA-listed-inventory basis, estimated) — and their profile varies widely by prefecture, as Tokyo (¥21,300, 305.4 rooms) and Osaka (¥13,100, 255.5 rooms) show. Confirming your property’s category in both the statistics and on OTAs, and then checking it against prefecture-level benchmarks, is the starting point for putting property-type labels to practical use.
Frequently Asked Questions
Q. Is there a legal definition of a city hotel in Japan?
No. Article 2 of the Hotel Business Act sets out three business types — “Ryokan/Hotel Business,” “Simple Lodging Business” and “Boarding House Business” — and since the June 2018 amendment, the law does not even distinguish between hotels and ryokan. “City hotel” is a conventional term used in JTA statistics and booking-site classifications.
Q. How does the Japan Tourism Agency’s statistics define a city hotel?
The Overnight Travel Statistics Survey defines city hotels as hotels “located in urban areas other than resort hotels and business hotels.” The type a facility responds under is self-reported. From the January 2026 survey, the survey changed its stratification basis from number of employees to number of rooms and surveys all facilities with 20 or more rooms.
Q. How large is the rate gap between city hotels and business hotels?
In August 2026, national estimated settled ADR (property median, tax-excluded equivalent) was about ¥13,000 for city hotels and about ¥8,600 for business hotels, a ratio of 1.51x. On listed prices (all-plan average, tax included), the gap widens to 1.7x — about ¥27,000 for city hotels and ¥15,900 for business hotels — but it narrows at settled levels.
Q. Do city hotels have low occupancy?
Not necessarily. August 2026 occupancy (OTA-listed-inventory basis, estimated) was 86.2% for city hotels, 85.7% for business hotels, 86.1% for resort hotels and 85.3% for ryokan, a spread of under 1pt. In the JTA’s finalized 2025 figures, city hotels (74.1%) and business hotels (75.3%) were also close, and the differences arise between prefectures rather than between property types.
Q. How much do city-hotel rates vary by prefecture?
On August 2026 estimated settled ADR (area median, tax-excluded equivalent), across the 41 prefectures with at least 10 properties in the calculation, rates range about 3.0x, from a low of ¥7,057 in Tochigi to a high of ¥21,265 in Tokyo. That is larger than the 1.51x city-to-business ratio in national property medians: rates vary far more by location than by property type.
Methodology and Sources
The figures in this article use as their population approximately 27,000 domestic properties tracked by MetroEngines Research that are listed on major OTAs and confirmed to be operating, aggregated by property type (city hotels, business hotels, resort hotels, ryokan) consolidated at the property level from major OTAs’ listing categories. “Listed properties” and “listed price (all-plan average, tax included)” are aggregates of properties with confirmed price listings for August 2026 stays. “Analyzed properties” are those for which an estimated settled ADR for the same month (lowest-plan level × property-type adjustment factor, an ensemble of two OTAs, median error of about 7% against REIT-disclosed results, tax-excluded equivalent) could be calculated and that could be matched to room counts and cumulative reviews in our property data; national estimated settled ADR uses property medians and prefectural estimated settled ADR uses area medians. Room-count bands (1–19, 20–39, 40–99, 100–199 and 200+ rooms) follow the bands used in the JTA Overnight Travel Statistics Survey tables from the January 2026 survey. Occupancy (OTA-listed-inventory basis, estimated) is the monthly average of daily estimates for August 2026 calculated by prefecture × property type, and national figures are room-weighted averages of the prefectures for which occupancy could be calculated. It is an estimate based on the absorption of inventory sold on OTAs and differs from a property’s actual overall occupancy. Reviews are property-level aggregates of cumulative review counts and overall ratings (out of 5) posted by guests on major booking sites; the source sites are not specified (HotelBank Editorial Team research). JTA Overnight Travel Statistics Survey room occupancy figures are cited from the finalized 2025 annual values (Table 8).
Related Articles
- JTA Lodging Survey Switches Stratification from Staff to Room Count: A Data Read
- What Is Hotel ADR? Settled Rates 34-57% of Listed Prices, 2026
- What Is RevPAR? ADR x Occupancy, and Why GOP Splits 1.81x in 2026
- City Hotels: 45.9% of Guest Nights Are Foreign — Ryokan +3.7%
References and Sources
■ Data sources
Price and inventory data for properties listed on major OTAs tracked by MetroEngines Research (August 2026 stays; four property types — city, business, resort, ryokan; 47 prefectures); guest reviews (cumulative counts and overall ratings) from HotelBank Editorial Team research; JTA Overnight Travel Statistics Survey 2025 annual values (finalized), Table 8, along with the JTA’s “Survey Overview” and its Q&A on the stratification revision; e-Gov Law Search “Hotel Business Act.”
■ Estimation assumptions
Estimated settled ADR is a tax-excluded-equivalent estimate applying property-type adjustment factors to the lowest-plan level (median error of about 7% against REIT-disclosed results); national figures use property medians and prefectural figures use area medians. Occupancy (OTA-listed-inventory basis, estimated) is the monthly average of daily estimates for August 2026 calculated by prefecture × property type; national values are room-weighted averages of the prefectures for which it could be calculated (city 20, resort 27, ryokan 46, business 47). Room-count bands follow the JTA table bands from the January 2026 survey. Table 4 is limited to prefectures with at least 10 properties in the estimated settled ADR calculation and at least 20 properties covered for occupancy.
■ Limitations and caveats
The population consists of properties listed on major OTAs and excludes properties not listed on OTAs. Property types are a classification consolidated at the property level from OTA listing categories and may not match the self-reported categories in JTA statistics. Estimated settled ADR and occupancy are estimates and differ from properties’ actual settled prices and actual occupancy. Because the definition and population differ from the JTA’s room occupancy rate, the levels are not compared directly. August is a peak month for all property types; this does not show that the occupancy gap between types is under 1pt year-round. The number of analyzed city hotels ranges from 1,125 to 1,449 depending on aggregation criteria (Table 5).
- e-Gov Law Search “Hotel Business Act (旅館業法)” (Act No. 138 of 1948), Articles 2 and 3
- Japan Tourism Agency “Overnight Travel Statistics Survey” (statistics page)
- Japan Tourism Agency “Overview of the Overnight Travel Statistics Survey” (survey scope, facility-type definitions, stratification from the January 2026 survey)
- Japan Tourism Agency “Overnight Travel Statistics Survey: Q&A on the Revision of Stratification Criteria”
- Japan Tourism Agency “Overnight Travel Statistics Survey (December 2025 Second Preliminary, January 2026 First Preliminary) and 2025 Annual Values (Preliminary)”
- Japan Tourism Agency “Overnight Travel Statistics Survey 2025 Annual Values (Finalized)” tables (Table 8: Room occupancy by facility type)
- Kanko Keizai Shimbun “Amended Hotel Business Act takes effect June 15” (2018, Japanese)
- MetroEngines Research — price and inventory data for properties listed on major OTAs (August 2026 finalized month, aggregated by property type)
- HotelBank Editorial Team research — cumulative review counts and overall ratings (property level)