

When the hospitality industry talks about hiring, the discussion tends to drift toward “how much should we raise wages?” and “how should we build the shift rota?” Yet the first line that hits the P&L comes before wages: the cost of getting one person into the seat. Combining data published by Japan’s Ministry of Health, Labour and Welfare (MHLW), the cost per hire through recruitment agencies can be observed in a range of roughly ¥610,000 to ¥1.02 million depending on the occupation. In this article we look at job-openings-to-applicants ratios by occupation and the cost per hire by recruitment channel, build up annual hiring costs for two models — a 100-room business hotel and an 80-room ryokan — and then back-calculate, prefecture by prefecture, the ADR uplift needed to absorb those costs.
Metric Definitions Used in This Article
- ADR (Average Daily Rate): An estimated settled rate (tax-exclusive equivalent), calculated by applying segment-specific adjustment factors to the lowest-plan price level each property publishes on OTAs and similar channels (2 guests per room, per-room price, tax-inclusive). Checked against property-level results disclosed by listed hotel REITs (91 properties, most recent 3 months), the median error is about 7%. These are estimates and differ from each property’s actual settled prices and accounting figures. Area-level ADR is the median of the covered properties (the level of a typical property in the area).
- OCC (Occupancy Rate): Rooms sold as a share of total rooms in the area (an estimate based on OTA sales inventory). The occupancy rates used in this article’s calculations are assumed values, stated in “■ Calculation Assumptions” below.
- Job-openings-to-applicants ratio: Active job openings ÷ active job seekers. This article uses actual (not seasonally adjusted) figures for regular employment including part-time.
- Data sources: MHLW “Employment Referrals for General Workers (Public Employment Security Statistics)” / MHLW “Survey on Employment Trends” / MHLW “Employment Placement Business Reports”; MetroEngines Research
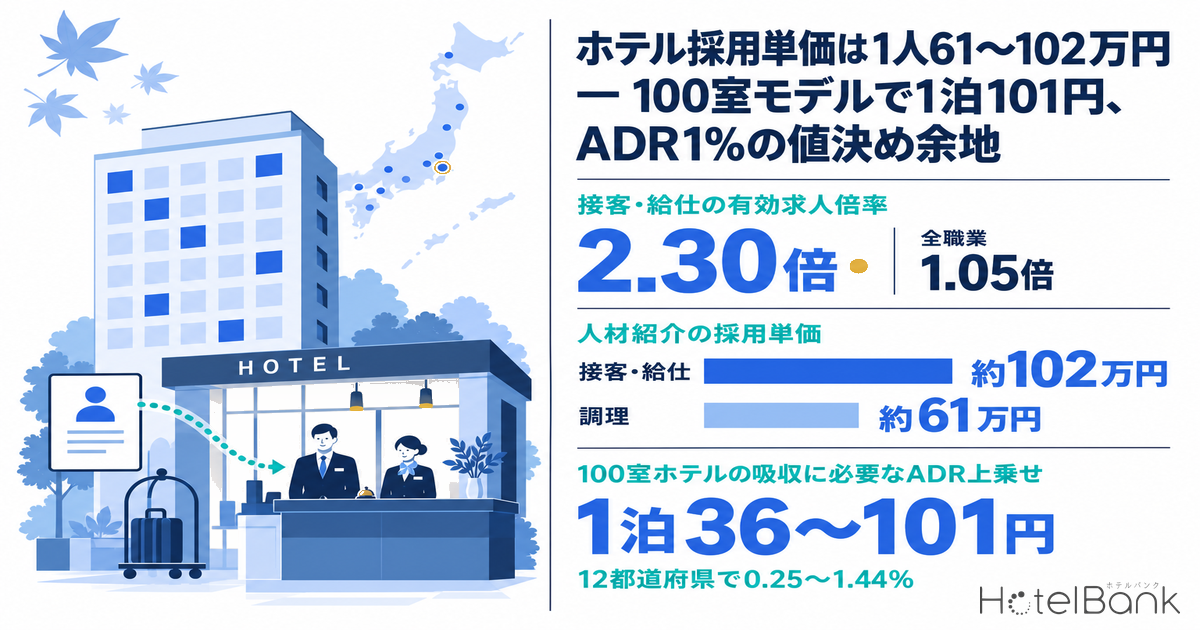
- — The job-openings ratio for customer service and serving staff is 2.30 (July 2026, vs. 1.05 for all occupations). The gap to all occupations has narrowed from 1.77pt in 2024 to 1.25pt
- — An agency placement costs about ¥1.02 million per hire (customer service and serving) and about ¥610,000 for cooks. Job-site costs for hotel-type roles average only ¥143,000 per hire, with a median of ¥80,000
- — Assuming a 25.1% turnover rate, we estimate annual hiring costs of ¥1.046M–¥2.960M for a 100-room business hotel and ¥1.407M–¥3.840M for an 80-room ryokan
- — Absorbing Model A’s cost requires an ADR uplift of ¥36–¥101 per room night, or 0.25–1.44% across 12 prefectures. What moves the per-night cost most is not occupancy but the recruitment channel mix
Customer Service at 2.30 vs. 1.05 for All Occupations — Where Hotels Stand in the Hiring Market
First, let’s pin down in numbers where the lodging industry stands in the hiring market. Taking the job-openings-to-applicants ratio for regular employment including part-time over the latest 24 months (August 2024 – July 2026) from the occupational long-term time series of MHLW’s “Employment Referrals for General Workers (Public Employment Security Statistics)”, the levels as of July 2026 are as follows.
The all-occupations total is 1.05. By contrast, customer service and serving occupations — which include core hotel staff such as front desk and restaurant service — stand at 2.30, food and beverage cooking occupations, which staff the kitchen, at 2.18, and service occupations overall, which include care work, cleaning and personal hygiene services, at 2.60. For reference, within the same service group, care service occupations — the tightest segment — were at 3.82, while cleaning occupations, classified under transport and cleaning, were at 1.10.
Source: Compiled by HotelBank Editorial Team from MHLW “Employment Referrals for General Workers (Public Employment Security Statistics)” long-term time series (labor market indicators by occupation, regular employment including part-time)
What matters is not the level itself but the direction. Customer service and serving occupations peaked at 2.95 in November 2024, then fell 0.65 points to 2.30 by July 2026. Food and beverage cooking occupations likewise dropped 0.78 points, from 2.96 in December 2024 to 2.18. Looking at the gap to the all-occupations average, customer service and serving peaked at 1.77 points in September and November 2024 and narrowed to 1.25 points in July 2026. Cooking also shrank from 1.74 points (December 2024) to 1.13 points.
Source: Compiled by HotelBank Editorial Team from MHLW “Employment Referrals for General Workers (Public Employment Security Statistics)” long-term time series
In other words, the competitive environment for hotel hiring is still about 2.1–2.2 times as tight as the all-occupations average, but the gap has narrowed by about 0.5 points compared with two years ago. This opens up room to set prices that properly build in the cost per hire. There is no need to keep assuming the per-hire cost paid at the peak of competition; conversely, while conditions are easing, hotels can take stock of “how much it actually costs us to hire one person” as a unit cost.
Cost per Hire by Channel Ranges from ¥80,000 to ¥1.02 Million — Actual Figures from Published Sources
So how much does it actually cost a hotel to hire one person? To avoid quoting fee rates based on guesswork, we list only actual amounts that can be taken from published sources.
The most reliable figures come from the aggregated results of MHLW’s “Employment Placement Business Reports”. For FY2024 (preliminary), the fee per regular-employment placement by fee-charging agencies was about ¥1.03 million (+10.9% year on year). Total fee revenue was about ¥983.5 billion (+17.6%), of which fees for regular-employment placements were about ¥913.6 billion, and the number of regular-employment placements by fee-charging agencies was 888,993 (+5.3%).
The same report records fee revenue and regular-employment placements by occupational category, so the per-placement cost can be calculated by occupation. Customer service and serving occupations: total fees of ¥17,406.58 million ÷ 17,113 placements = about ¥1.02 million. Food and beverage cooking occupations: ¥5,447.26 million ÷ 8,880 placements = about ¥610,000. For reference, facility care occupations come to about ¥620,000, cleaning and washing workers about ¥670,000, and residential facility and building management occupations about ¥1.23 million. The structure this data reveals is that customer service and serving sits roughly at the all-occupations average, while cooking is about 40% lower.
Source: Compiled by HotelBank Editorial Team from MHLW “Aggregated Results of the FY2024 Employment Placement Business Reports (Preliminary)” / Mynavi Corporation “Mid-Career Recruitment Survey 2026 (2025 results)”
On the job-advertising side, Mynavi’s “Mid-Career Recruitment Survey 2026 (2025 results)” publishes the “job-site advertising cost per hire” by occupation. The all-occupations average is ¥367,000 (median ¥200,000), but “beauty, bridal, hotel and transport” occupations average ¥143,000 with a median of ¥80,000 (n=52) — far below the overall figure. “Sales, food and amusement” also averages ¥188,000 with a median of ¥100,000 (n=69). In other words, lodging and food-service roles are being filled for around ¥100,000 per hire when recruited through job sites.
| Recruitment channel | Cost per hire | Conditions / population | Source (year) |
|---|---|---|---|
| Recruitment agency (all-occupations average) | approx. ¥1.03M | Fee per regular-employment placement, published figure | MHLW Employment Placement Business Reports (FY2024 preliminary) |
| Recruitment agency (customer service and serving) | approx. ¥1.02M | Total fees ¥17,406.58M ÷ 17,113 placements | Calculated by HotelBank Editorial Team from the above |
| Recruitment agency (food and beverage cooking) | approx. ¥610K | Total fees ¥5,447.26M ÷ 8,880 placements | Calculated by HotelBank Editorial Team from the above |
| Recruitment agency (rate-based) | approx. 30–40% of theoretical annual salary | Notified-fee system. Mynavi cites “about 30% of annual salary”; ManpowerGroup cites “about 35–40%” | Mynavi (March 2026) / ManpowerGroup |
| Recruitment agency (capped-fee system) | 11.0% of 6 months’ wages | 10.3% for tax-exempt businesses. Rarely used in practice | ManpowerGroup |
| Job sites (all occupations) | Average ¥367K / median ¥200K | Job-site advertising cost per hire | Mynavi Mid-Career Recruitment Survey 2026 |
| Job sites (beauty, bridal, hotel and transport occupations) | Average ¥143K / median ¥80K | n=52 (companies that incurred job-site costs for these occupations) | Same as above |
| Job sites (sales, food and amusement occupations) | Average ¥188K / median ¥100K | n=69 | Same as above |
| Referral bonus (full-time employees) | ¥50K–¥200K | Most common range. Split between referrer and hire is roughly 2:1 | Refcome |
| Referral bonus (non-regular employees) | ¥5,000–¥10,000 | Most common range | Same as above |
| Hello Work (public employment office) | Free | Free job placement provided by the national government | MHLW “Hello Work Services” |
Source: Compiled by HotelBank Editorial Team from published materials of MHLW / Mynavi Corporation / Refcome
Annual spending per company can also be confirmed from the same survey. Annual recruitment spending in 2025 averaged ¥6.099 million per company (down ¥407,000 from the previous year, n=1,280), below the average budget of ¥6.96 million. Average actual spending by channel was ¥3.755 million on recruitment agencies, ¥1.251 million on job advertising (of which job sites alone ¥1.118 million), ¥1.739 million on direct recruiting, ¥1.227 million on job search engines, ¥1.235 million on joint information sessions and other events, and ¥827,000 on employer branding. The average number of hires per year was 12.3 (against a target of 16.7, n=1,327). Because spending and headcount come from separate questions, this is not a strict division, but a simple back-calculation gives about ¥496,000 per hire. The fact that recruitment agencies account for just over 60% of annual spending is what anchors the center of gravity of the cost per hire.
¥1.04M–¥2.96M a Year for a 100-Room Business Hotel, ¥1.41M–¥3.84M for an 80-Room Ryokan
Next, we put this cost per hire onto a hotel’s P&L. The starting point for the number of hires is the turnover rate. According to MHLW’s “2024 Survey on Employment Trends”, the turnover (separation) rate for accommodation and food services was 25.1% (hiring rate 28.4%), 10.9 points above the all-industries turnover rate of 14.2% (hiring rate 14.8%). By employment type, it was 18.1% for general (full-time) workers and 29.9% for part-time workers. Using these two rates, the annual number of separations — i.e. replacement hires — can be derived from the number of regular employees.
| Item | Model A: 100-room business hotel | Model B: 80-room ryokan |
|---|---|---|
| Regular employees (full-time / part-time) | 30 (14 / 16) | 40 (18 / 22) |
| Annual separations / replacement hires | 7.32 people (2.53 / 4.78) | 9.84 people (3.26 / 6.58) |
| Annual hiring cost: job-site-led case | ¥1.046M | ¥1.407M |
| Annual hiring cost: agency-mix case | ¥2.960M | ¥3.840M |
| Annual cost per room (job-site-led / agency-mix) | ¥10,465 / ¥29,598 | ¥17,582 / ¥47,995 |
| Per room night sold (job-site-led / agency-mix) | ¥35.8 / ¥101.4 | ¥68.8 / ¥187.8 |
Source: Estimated by HotelBank Editorial Team from MHLW “2024 Survey on Employment Trends” and “Aggregated Results of the FY2024 Employment Placement Business Reports (Preliminary)”, and Mynavi Corporation “Mid-Career Recruitment Survey 2026”
The 100-room business hotel generates 7.32 replacement hires a year: ¥1.046 million a year if filled mainly through job sites, or ¥2.960 million a year if full-time positions rely on recruitment agencies. With the same number of hires, the difference in channel mix alone widens annual cost by about 2.8 times. The 80-room ryokan, being more labor-intensive, needs 9.84 hires, for ¥1.407 million to ¥3.840 million a year. Per room, that is ¥10,465–¥29,598 a year for Model A and ¥17,582–¥47,995 a year for Model B. Per room night sold, Model A comes to ¥35.8–¥101.4 and Model B to ¥68.8–¥187.8.
■ Calculation Assumptions
We disclose every figure, source and reference year used in the calculations above.
| Assumption | Value used | Basis / reference year |
|---|---|---|
| Turnover rate (full-time workers) | 18.1% | MHLW “Survey on Employment Trends”, accommodation and food services (2024) |
| Turnover rate (part-time workers) | 29.9% | Same as above (2024) |
| Agency cost per hire (full-time positions) | ¥1.017M per placement | MHLW “Employment Placement Business Reports”, FY2024 preliminary: total fees for customer service and serving occupations ÷ regular-employment placements |
| Job-site cost per hire (job-site-led case) | ¥143K per hire | Mynavi “Mid-Career Recruitment Survey 2026”, average for beauty, bridal, hotel and transport occupations (2025 results, n=52) |
| Job-site cost per hire (part-time positions in the agency-mix case) | ¥80K per hire | Same source, median for the same occupations (2025 results) |
| Number of regular employees | Model A 30 / Model B 40 | Assumed value. Set as a typical staffing level for a 100-room limited-service hotel and an 80-room ryokan serving two meals. Not based on external statistics |
| Full-time to part-time ratio | Model A 14:16 / Model B 18:22 | Assumed value |
| Occupancy rate | Model A 80% / Model B 70% | Assumed value. Used as the denominator for the per-night conversion (rooms × 365 days × occupancy) |
| Channel mix (job-site-led case) | All positions filled via job sites | Assumption. Set as the lower-bound case |
| Channel mix (agency-mix case) | Full-time positions via recruitment agencies, part-time positions via job sites | Assumption. Set as the upper-bound case |
| ADR (denominator for the uplift) | Estimated settled ADR of business hotels by prefecture | MetroEngines Research, 12-month average for September 2025 – August 2026 (all months on a closed-month basis) |
| Costs not included | Recruiter salaries, interview and training time, equipment and uniforms for new hires, agency fee refunds | Only external spending is covered |
Source: Compiled by HotelBank Editorial Team
As stated, three inputs — headcount, the full-time/part-time ratio and occupancy — are assumed values and should be replaced with each property’s actual figures. However, the backbone of the estimate is “turnover rate × headcount × cost per hire”, so even if headcount moves by ±20%, annual cost simply moves in proportion; the ranking and order of magnitude do not change.
The ADR Uplift Needed to Absorb It Is 0.25–1.44% — Back-Calculated for 12 Prefectures
Finally, we back-calculate what percentage would need to be added to ADR to absorb this hiring cost through room rates. As the denominator we use MetroEngines Research’s estimated settled ADR for business hotels by prefecture (12-month average for September 2025 – August 2026). Every month in this period is on a closed-month basis; we do not make comparisons that straddle closed months and forward-looking snapshots.
Source: Compiled by HotelBank Editorial Team from MetroEngines Research data
| Prefecture | Estimated settled ADR | Properties covered | Required uplift (Model A, job-site-led) | Required uplift (Model A, agency-mix) |
|---|---|---|---|---|
| Tokyo | ¥14,178 | 924 | 0.25% | 0.71% |
| Kyoto | ¥13,892 | 329 | 0.26% | 0.73% |
| Fukuoka | ¥10,900 | 341 | 0.33% | 0.93% |
| Osaka | ¥10,016 | 503 | 0.36% | 1.01% |
| Kanagawa | ¥9,221 | 213 | 0.39% | 1.10% |
| Hokkaido | ¥8,881 | 441 | 0.40% | 1.14% |
| Okinawa | ¥8,865 | 196 | 0.40% | 1.14% |
| Ishikawa | ¥7,827 | 111 | 0.46% | 1.30% |
| Aichi | ¥7,820 | 329 | 0.46% | 1.30% |
| Hiroshima | ¥7,700 | 189 | 0.47% | 1.32% |
| Miyagi | ¥7,568 | 142 | 0.47% | 1.34% |
| Shizuoka | ¥7,048 | 222 | 0.51% | 1.44% |
Source: Compiled by HotelBank Editorial Team from MetroEngines Research data (estimated settled ADR is the 12-month average for September 2025 – August 2026; properties covered is the maximum over the same period)
The conclusion is simple. The hiring cost of a 100-room business hotel (Model A) can be absorbed with 0.25–0.51% of ADR if hiring is done mainly through job sites, and with 0.71–1.44% even when recruitment agencies are also used. In Model A’s agency-mix case, the uplift required is about ¥101 per room night regardless of prefecture — just 0.71% in Tokyo with an ADR of ¥14,178, and still only 1.44% in Shizuoka with an ADR of ¥7,048. This is an order of magnitude smaller than costs such as minimum wage revisions, which hit at around ¥10,000 per room per year, and falls within the range of fine-tuning prices.
The key point is that this “within 1%” level moves by about three times depending on channel mix. With the same number of hires, it is 0.25% in Tokyo when job-site-led, but 0.71% with an agency mix. Whether or not the cost is passed on to ADR, the first thing to pin down is “how much does it cost our property to hire one person?” Once that unit cost is known, the required uplift can be calculated immediately.
Sensitivity Analysis: How Agency Dependence × Occupancy Moves the Per-Night Cost
Two variables drive the size of the uplift: the recruitment channel mix, and occupancy, which is the denominator in the per-night conversion. For Model A (100-room business hotel, 7.32 replacement hires a year), combining intermediate cases — in which the cost-per-hire assumptions are interpolated linearly from the job-site-led case (0%) to the agency-mix case (100%) — with assumed occupancy of 70–90% gives the following hiring cost per room night sold.
| Occupancy \ shift toward agency-mix case | Job-site-led (0%) | 25% | 50% | 75% | Agency-mix (100%) |
|---|---|---|---|---|---|
| Occupancy 70% (assumed) | ¥41.0 | ¥59.7 | ¥78.4 | ¥97.1 | ¥115.8 |
| Occupancy 80% (assumed) | ¥35.8 | ¥52.2 | ¥68.6 | ¥85.0 | ¥101.4 |
| Occupancy 90% (assumed) | ¥31.9 | ¥46.4 | ¥61.0 | ¥75.5 | ¥90.1 |
Source: Estimated by HotelBank Editorial Team from the figures in “■ Calculation Assumptions” (MHLW “2024 Survey on Employment Trends” and “Aggregated Results of the FY2024 Employment Placement Business Reports (Preliminary)”, Mynavi Corporation “Mid-Career Recruitment Survey 2026”). Occupancy rates are assumed values
Even the heaviest combination (agency-mix, 70% occupancy) comes to ¥116 per room night — 1.64% of Shizuoka’s ADR of ¥7,048, or 0.82% of Tokyo’s ADR of ¥14,178. The lightest combination (job-site-led, 90% occupancy) is 0.45% in Shizuoka. In other words, changing the channel mix has a far larger impact on per-night cost than moving the occupancy assumption up or down by 10 points. The first variable to pin down as a pricing assumption is dependence on recruitment agencies.
Retaining One Employee = One Agency Placement Worth ¥1.02 Million — Room to Design Around Hiring
Making the cost per hire visible also reveals the flip side of hiring: the monetary value of retention. In Model A’s agency-mix case, replacing one full-time worker costs ¥1.017 million. In other words, improving full-time retention by one person a year is worth the same as hiring seven people through job sites. Retaining one part-timer is worth ¥80,000, but since Model A replaces 4.78 part-timers a year, this also adds up.
Three areas of design room follow from this.
First, room to shift the center of gravity of channels. Across all industries, just over 60% of annual spending goes to recruitment agencies (¥3.755 million out of ¥6.099 million per company on average), yet the job-site cost per hire for lodging and hotel occupations is a median of ¥80,000 — only 40% of the all-occupations median of ¥200,000. Hotels are an occupation group where hiring through job advertising is relatively efficient, and this gap can be put to use.
Second, room to back-calculate a referral budget from the cost per hire. The most common referral bonus for full-time employees is ¥50,000–¥200,000, one-fifth to one-twentieth of a single agency placement (about ¥1.02 million). Viewed as the amount available to hire the same one person, there is considerable latitude in designing the bonus amount.
Third, room to take advantage of today’s easing job-openings ratio. The ratio for customer service and serving occupations has fallen from 2.95 in November 2024 to 2.30 in July 2026, and the gap to the all-occupations average has narrowed from 1.77 points to 1.25 points. There is no need to keep assuming the per-hire cost from the peak of hiring competition; taking stock now translates directly into room to lower that cost.
HotelBank has covered wage levels and shift design in earlier analyses, including the minimum wage path toward ¥1,500 nationwide and ADR pass-through by prefecture, Japan Ends the ¥1.06M Wage Threshold Oct 2026: Hotel Shift Design, and the redesign of the two-meal ryokan model amid tight kitchen and serving staff. This article limits its focus to the step that comes before all of those: “the cost of hiring itself”. Read together, they allow labor costs to be designed across three layers — wages, shifts and cost per hire.
Summary
The cost per hire in the lodging industry can be pinned down in actual amounts from published sources. Recruitment agencies cost about ¥1.02 million for customer service and serving occupations and about ¥610,000 for food and beverage cooking occupations (calculated from MHLW “Aggregated Results of the FY2024 Employment Placement Business Reports (Preliminary)”). Job sites cost an average of ¥143,000 per hire, with a median of ¥80,000, for beauty, bridal, hotel and transport occupations.
Combined with a turnover rate of 25.1% (accommodation and food services, 2024 Survey on Employment Trends), this gives ¥1.046M–¥2.960M a year for a 100-room business hotel and ¥1.407M–¥3.840M a year for an 80-room ryokan. Per room night sold, that is ¥36–¥101 for Model A and ¥69–¥188 for Model B; for Model A, the cost can be absorbed with an uplift of 0.25–1.44% on business-hotel estimated settled ADR across 12 prefectures.
The cost per hire is a “hard to see but calculable” cost of around 1% of ADR. Before deciding whether to pass that 1% on, first establish your property’s own cost per hire, then measure the room for better retention and a different channel mix. With the job-openings ratio easing, now is the best time to take that stock.
Related Articles
- Japan Ends the ¥1.06M Wage Threshold Oct 2026: Hotel Shift Design
- Japan’s Customer Harassment Mandate Oct 1: The 14.0% Retention Upside
- Japan Hotels: 1,968 Skilled Foreign Workers, 1.55 per 1,000 Rooms
- Japan Minimum Wage 2026: Chiba & Aichi ¥1,195, Oct 1-15 Rollout
References and Sources
■ Government Statistics and Public Data
- MHLW “Employment Referrals for General Workers (Public Employment Security Statistics)”, July 2026 edition, Long-Term Time Series Table 21 “Labor Market Indicators by Occupation” (e-Stat, published August 28, 2026) (Japanese)
- MHLW “Aggregated Results of Employment Placement Business Reports” (Japanese) / Aggregated Results of the FY2024 Employment Placement Business Reports (Preliminary) (Japanese, PDF)
- MHLW “Overview of the 2024 Survey on Employment Trends” (Table 4-2: Hiring, Separation and Net Hiring Rates by Industry and Employment Type) (Japanese)
- MHLW “Hello Work Services” (free job placement provided by the national government) (Japanese)
■ Private Surveys and Company Publications
- Mynavi Corporation “Mid-Career Recruitment Survey 2026 (2025 results)” (Mynavi Career Research Lab, March 2026) (Japanese) / Full survey report (Japanese, PDF) — survey period December 17–22, 2025, n=1,500
- ManpowerGroup “Recruitment Agencies: What Are Typical Fees? How They Work, Theoretical Annual Salary and Refunds Explained” (Japanese)
- Refcome “Typical Referral Hiring Rewards (Incentives): How to Set Them and Non-Cash Examples” (Japanese)
■ Market Data
- MetroEngines Research — Estimated settled ADR of business hotels by prefecture (September 2025 – August 2026; properties covered are listed in the table in the main text)