

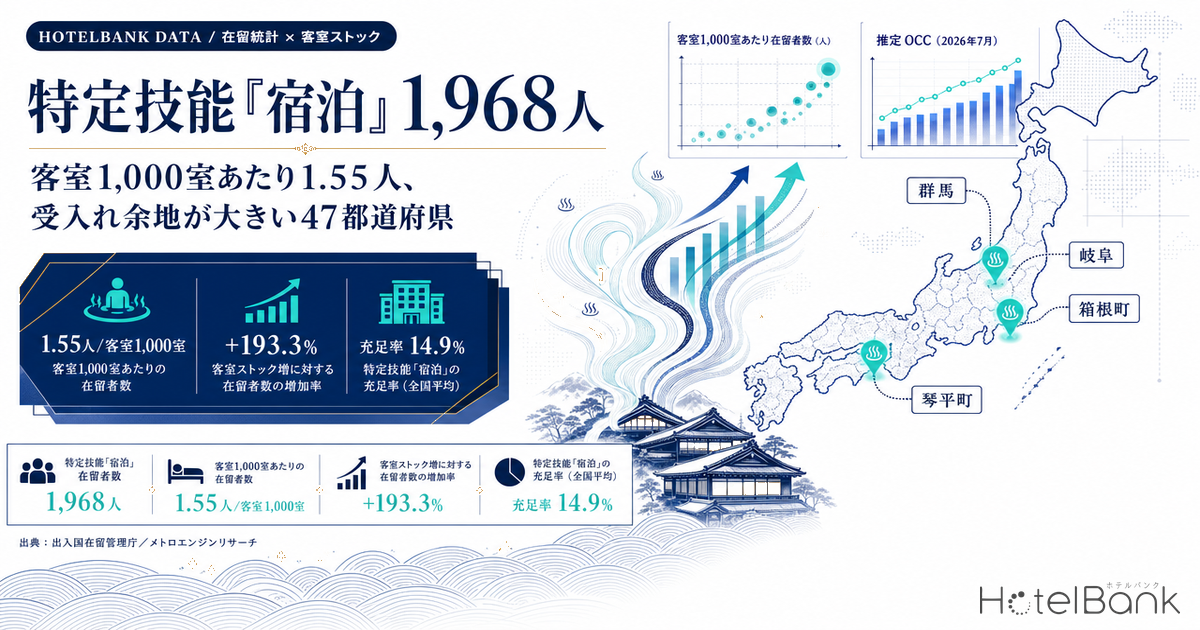
The debate over staffing in Japan’s accommodation industry has so far rested largely on sentiment readings from business surveys. This article works from a different class of primary data: the residency statistics the Immigration Services Agency publishes on a quarterly and semi-annual basis. We isolate the accommodation sector, divide each prefecture’s worker count by its room stock, and convert the figures into a single common yardstick — how many Specified Skilled Workers are employed per 1,000 guest rooms. Once the units are aligned, the regions that have taken in the most workers separate cleanly from those with the most room left to grow.
Metric Definitions Used in This Article
- Accommodation-sector worker count: The number of holders of the Specified Skilled Worker (i) status whose designated industry field is accommodation, per the Immigration Services Agency’s “Number of Foreign Nationals Residing under Specified Skilled Worker Status.” Provisional figures, counted in principle at the location of the accepting employer.
- Room stock: The total number of guest rooms at the 27,248 properties (1,266,952 rooms) confirmed to be operating, among the domestic lodging facilities tracked by MetroEngines Research. Ryokan, minshuku, and simple lodging houses not listed on OTAs are excluded.
- Workers per 1,000 rooms: A prefecture’s accommodation-sector worker count ÷ (that prefecture’s room stock ÷ 1,000). A normalized metric that strips out differences in the size of the underlying population.
- OCC (occupancy rate): Rooms sold as a share of total rooms in the area (an estimate based on OTA-listed inventory; consistency checks against monthly REIT disclosures put accuracy within roughly a few percentage points). Because it is derived from the sell-through of inventory offered on OTAs, it differs from a property’s true overall occupancy.
- Data sources: Immigration Services Agency, “Number of Foreign Nationals Residing under Specified Skilled Worker Status” and “Projected Intake and Resident Numbers for Specified Skilled Worker (i)” / MetroEngines Research
- — 1,968 workers — Specified Skilled Worker (i) holders in the accommodation sector as of end-December 2025. That is roughly 2.9x the 671 a year earlier, yet still only 0.51% of all SSW (i) holders.
- — 1.55 workers per 1,000 rooms is the national figure. Gunma (5.51) and Gifu (4.37) lead, while Tokyo (0.45) and Fukuoka (0.51) sit far below the national level.
- — Seven municipalities are ahead — Kotohira (32.30), Yugawara (21.65), Gero (19.11) and four other onsen towns already exceed 11.68 per 1,000 rooms, the national density that would apply if the full 14,800-worker quota were reached.
- — Correlation of -0.22 — Estimated OCC (as of July 2026) and worker density show a weak negative relationship: the harder a prefecture’s inventory sells through, the thinner its staffing per room.
- — 14.9% of the quota filled (provisional, end-March 2026). Allocating by room stock, the largest headroom sits in Tokyo (+1,800), Osaka (+1,026) and Hokkaido (+783).
The Accommodation Sector Stands at 1,968 Workers — Up 2.9x in a Year, Still Only 0.51% of the Total
According to “Number of Foreign Nationals Residing under Specified Skilled Worker Status (end-December 2025),” released by the Immigration Services Agency on March 27, 2026, there were 382,341 Specified Skilled Worker (i) holders across all fields. Of those, 1,968 were in the accommodation sector — an increase of 1,297 from the 671 recorded a year earlier (end-December 2024), or roughly 2.9x in a single year (+193.3%). Growth across all fields over the same period was +34.8%, so accommodation is expanding at more than five times the pace of the programme as a whole.
Even so, its footprint within the total remains small. Accommodation accounts for just 0.51% of all SSW (i) holders. It trails the largest fields — nursing care (67,871) and food and beverage manufacturing (93,393) — by an order of magnitude, and is less than a twentieth the size of food service (43,869). Put differently, the use of the Specified Skilled Worker programme in accommodation is still at the stage of widening its footprint within the system.
Source: Compiled by the HotelBank Editorial Team from Table 5 of each edition of the Immigration Services Agency’s “Number of Foreign Nationals Residing under Specified Skilled Worker Status”
Tracking the half-year series makes the inflection point clear. From 293 at end-June 2023 to 671 at end-December 2024, the count built up by roughly 100-180 per half-year; it then jumped to 1,265 at end-June 2025 and added a further 700-plus in the following half. Most recently, provisional figures released on July 10, 2026 put the accommodation-sector count at 2,207 as of end-March 2026.
1.55 Workers per 1,000 Rooms — Normalizing Brings the Regional Gap into View
Lining up raw headcounts by prefecture tells us little, because room stock differs by orders of magnitude. So we normalize: divide each prefecture’s accommodation-sector worker count by its own room stock. Nationally, 1,968 workers ÷ 1,266,952 rooms works out to 1.55 workers per 1,000 rooms — roughly one worker for every 650 guest rooms.
Re-sorted on this yardstick, the leaders are not the big cities. Gunma (5.51) tops the list, followed by Gifu (4.37) and Wakayama (3.41). While some prefectures take in workers at more than three times the national density, Tokyo sits at 0.45 and Fukuoka at 0.51, both far below the national figure.
Source: Immigration Services Agency, “Number of Foreign Nationals Residing under Specified Skilled Worker Status (end-December 2025)” / MetroEngines Research; compiled by the HotelBank Editorial Team
| Prefecture | Room stock | Accommodation workers | Year earlier | Change | Per 1,000 rooms | Est. OCC (Jul 2026) |
|---|---|---|---|---|---|---|
| Gunma | 20,514 | 113 | 15 | +98 | 5.51 | 81.8% |
| Gifu | 17,408 | 76 | 42 | +34 | 4.37 | 84.3% |
| Wakayama | 11,732 | 40 | 10 | +30 | 3.41 | 85.6% |
| Kanagawa | 42,982 | 141 | 61 | +80 | 3.28 | 85.6% |
| Kagawa | 10,870 | 34 | 3 | +31 | 3.13 | 84.6% |
| Hyogo | 35,607 | 104 | 22 | +82 | 2.92 | 88.7% |
| Oita | 17,768 | 51 | 15 | +36 | 2.87 | 82.5% |
| Fukui | 9,096 | 26 | 6 | +20 | 2.86 | 88.5% |
| Yamanashi | 16,911 | 48 | 7 | +41 | 2.84 | 85.3% |
| Tochigi | 20,406 | 56 | 17 | +39 | 2.74 | 84.2% |
| Ibaraki | 16,041 | 41 | 17 | +24 | 2.56 | 85.9% |
| Yamagata | 13,906 | 35 | 22 | +13 | 2.52 | 87.3% |
| Kumamoto | 18,377 | 44 | 13 | +31 | 2.39 | 84.2% |
| Okinawa | 42,577 | 100 | 33 | +67 | 2.35 | 91.0% |
| Kagoshima | 20,514 | 46 | 15 | +31 | 2.24 | 82.0% |
Source: Immigration Services Agency, “Number of Foreign Nationals Residing under Specified Skilled Worker Status (end-December 2025)” / MetroEngines Research; compiled by the HotelBank Editorial Team
The prefectures at the top share a common profile. In Gunma, Gifu, Wakayama, Oita, Yamanashi and Tochigi alike, the core of the room stock consists of onsen ryokan operating on the one-night, two-meal model. That format is labour-intensive in exactly the person-to-person functions — kitchen work, food service and room attendance — that cannot be automated away. It appears that this is precisely where Specified Skilled Workers in the accommodation sector first took hold.
It is worth also listing the prefectures whose normalized figure falls below the national level. Rather than reading these as places that have been slow to take workers in, they are better understood as places where there is substantial room for the programme to widen its footprint relative to the room stock.
| Prefecture | Room stock | Accommodation workers | Year earlier | Change | Per 1,000 rooms | Est. OCC (Jul 2026) |
|---|---|---|---|---|---|---|
| Aomori | 14,426 | 2 | 1 | +1 | 0.14 | 93.7% |
| Akita | 10,839 | 2 | 2 | +0 | 0.18 | 90.4% |
| Ehime | 13,223 | 3 | 2 | +1 | 0.23 | 84.6% |
| Tokyo | 160,289 | 72 | 45 | +27 | 0.45 | 93.1% |
| Fukushima | 24,673 | 12 | 5 | +7 | 0.49 | 86.1% |
| Fukuoka | 49,133 | 25 | 16 | +9 | 0.51 | 91.1% |
| Osaka | 93,041 | 61 | 43 | +18 | 0.66 | 86.5% |
| Aichi | 49,122 | 33 | 5 | +28 | 0.67 | 85.8% |
| Okayama | 14,951 | 10 | 4 | +6 | 0.67 | 86.1% |
| Miyazaki | 11,703 | 8 | 2 | +6 | 0.68 | 84.2% |
Source: Immigration Services Agency, “Number of Foreign Nationals Residing under Specified Skilled Worker Status (end-December 2025)” / MetroEngines Research; compiled by the HotelBank Editorial Team
How to read these figures: Worker counts are, in principle, recorded at the location of the accepting employer. In prefectures where only a handful of workers are registered, a single employer’s hiring decision can move the normalized metric substantially, so single-year rank differences should not be read directly as regional characteristics. The numerator comes from residency statistics while the denominator is the room stock confirmed to be operating on OTAs and similar channels, so the two populations are not perfectly aligned. The metric is intended for relative comparison between prefectures. Note also that the national figure of 1,968 includes 8 workers whose location is not determined, so the 47 prefectures sum to 1,960.
Some Onsen Towns Have Already Passed the Density Implied by a Fully Filled Quota
Drilling down to the municipal level makes the concentration sharper still. The municipality with the most accommodation-sector workers is Hakone, Kanagawa, with 86 — ahead of the 53 in Tokyo’s special wards. Next come Nikko, Tochigi (46), Sapporo, Hokkaido (43), Osaka City (43), Toyooka, Hyogo (40) and Gero, Gifu (39). Several of Japan’s best-known onsen destinations rank alongside designated cities and metropolitan wards.
Converting these to a per-1,000-rooms basis shifts the ranking further still.
| Municipality | Accommodation workers | Room stock | Per 1,000 rooms |
|---|---|---|---|
| Kotohira, Kagawa | 23 | 712 | 32.30 |
| Yugawara, Kanagawa | 22 | 1,016 | 21.65 |
| Gero, Gifu | 39 | 2,041 | 19.11 |
| Yufu, Oita | 27 | 1,910 | 14.14 |
| Toyooka, Hyogo | 40 | 2,866 | 13.96 |
| Hakone, Kanagawa | 86 | 6,296 | 13.66 |
| Minakami, Gunma | 27 | 2,183 | 12.37 |
| Noboribetsu, Hokkaido | 19 | 1,873 | 10.14 |
| Nikko, Tochigi | 46 | 5,450 | 8.44 |
| Karuizawa, Nagano | 21 | 3,104 | 6.77 |
| Atami, Shizuoka | 28 | 4,839 | 5.79 |
| Takayama, Gifu | 29 | 5,233 | 5.54 |
| Onna, Okinawa | 25 | 4,830 | 5.18 |
Source: Immigration Services Agency, “Number of Foreign Nationals Residing under Specified Skilled Worker Status (end-December 2025)” / MetroEngines Research; compiled by the HotelBank Editorial Team
The benchmark for comparison here is the density that would result if the 14,800-worker intake projection discussed below were spread across the national room stock: 11.68 workers per 1,000 rooms. Seven municipalities — Kotohira (32.30), Yugawara (21.65), Gero (19.11), Yufu (14.14), Toyooka (13.96), Hakone (13.66) and Minakami (12.37) — already exceed, on their own, the density the programme would reach at full quota. Gunma leads at the prefectural level for the same reason: onsen towns across the prefecture are taking in workers in parallel — Minakami with 27, Kusatsu 19, Nakanojo 18, Tsumagoi 17 and Numata 13.
What these leading areas show is that Specified Skilled Workers in accommodation did not spread outward from large urban hotels. They spread across the map from onsen destinations that carry person-to-person service functions year-round. In exactly the regional markets long regarded as the hardest places to recruit, a track record of the programme actually working has been accumulating.
The Faster a Prefecture’s Inventory Sells Through, the More Staffing Headroom Is Left
Next we overlay this normalized metric on a demand-side one. The scatter plot below places estimated OCC for July 2026 (monthly average, all property categories) on the vertical axis and workers per 1,000 rooms on the horizontal axis, with bubble size representing room stock.
Source: Immigration Services Agency, “Number of Foreign Nationals Residing under Specified Skilled Worker Status (end-December 2025)” / MetroEngines Research; compiled by the HotelBank Editorial Team
Across the 47 prefectures the correlation coefficient is -0.22. It is not a strong relationship, but the sign is consistently negative: the further a prefecture’s inventory sells through, the thinner its Specified Skilled Worker staffing per room still is. Among the six prefectures with estimated OCC above 90% (July 2026, all property categories, N=47 prefectures), four sit well below the national 1.55 — Aomori at 0.14, Akita 0.18, Tokyo 0.45 and Fukuoka 0.51. Only Hokkaido (2.23) and Okinawa (2.35) come in above the national figure. The mechanism by which thin staffing directly caps the number of rooms a property can put on sale has been quantified separately in our analysis of regional ryokan unable to operate at full inventory because of labour shortages.
This ordering is consistent with a structure in which supply-side constraints bite hardest where demand is strongest. The operational ceiling on sellable rooms examined in Only Hotels That Capture Demand Survive: 2026’s Occupancy Ceiling likewise bites hardest on high-demand dates. Read the other way, prefectures that combine high estimated OCC with thin staffing density are best understood as markets where further sell-through is available to be captured once the staffing gap is filled.
Allocating the Remaining Quota up to 14,800 Workers by Room Stock
Under a Cabinet decision of January 23, 2026, the projected intake for Specified Skilled Worker (i) through end-March 2029 was set at 805,700 across all 19 designated fields, of which 14,800 is allotted to accommodation. A separate quota of 5,200 was set for accommodation under the Employment for Skill Development programme, bringing the combined projected intake for the lodging industry to 20,000.
Provisional figures published by the Immigration Services Agency on July 10, 2026 show 2,207 accommodation-sector workers as of end-March 2026, putting the quota fill rate at 14.9% on an annual increase of 1,365. Against a 50.2% fill rate across all 19 fields combined, accommodation has more than 80% of its quota still unused. By field, it stands in contrast to the front-runners — food service at 95.4%, food and beverage manufacturing at 72.2%, construction at 67.2% — and ranks among the fields leaving the widest share of the quota open.
Source: Compiled by the HotelBank Editorial Team from the Immigration Services Agency’s “Projected Intake and Resident Numbers for Specified Skilled Worker (i) (as of end-March 2026, provisional)”
To gauge where that remaining quota might go, we estimate headroom by prefecture. We apply the mechanical assumption that the 14,800-worker projection is distributed in proportion to room stock, and take the gap between each prefecture’s allocated value and its current count as “allocation-based headroom.” No government body has set prefecture-level allocation quotas; this is purely an estimate based on the share of room stock.
| Prefecture | Room stock | Current (end-Dec 2025) | Allocated value | Allocation-based headroom | Est. OCC (Jul 2026) |
|---|---|---|---|---|---|
| Tokyo | 160,289 | 72 | 1,872 | +1,800 | 93.1% |
| Osaka | 93,041 | 61 | 1,087 | +1,026 | 86.5% |
| Hokkaido | 82,855 | 185 | 968 | +783 | 92.3% |
| Fukuoka | 49,133 | 25 | 574 | +549 | 91.1% |
| Aichi | 49,122 | 33 | 574 | +541 | 85.8% |
| Chiba | 44,241 | 41 | 517 | +476 | 86.5% |
| Kyoto | 43,967 | 42 | 514 | +472 | 83.8% |
| Shizuoka | 47,250 | 81 | 552 | +471 | 84.9% |
| Nagano | 45,283 | 91 | 529 | +438 | 89.4% |
| Okinawa | 42,577 | 100 | 497 | +397 | 91.0% |
| Kanagawa | 42,982 | 141 | 502 | +361 | 85.6% |
| Hyogo | 35,607 | 104 | 416 | +312 | 88.7% |
Source: Immigration Services Agency, “Number of Foreign Nationals Residing under Specified Skilled Worker Status (end-December 2025)” / MetroEngines Research; compiled by the HotelBank Editorial Team
Source: Immigration Services Agency, “Number of Foreign Nationals Residing under Specified Skilled Worker Status (end-December 2025)” / MetroEngines Research; compiled by the HotelBank Editorial Team
On this allocation basis the largest headroom is in Tokyo (+1,800), followed by Osaka (+1,026) and Hokkaido (+783). The top three alone account for more than a quarter of the national remainder. In volume terms, the headroom concentrates in urban markets that combine large room stock with currently thin density.
That said, reading the allocated value as a “required headcount” would be a mistake. Urban business hotels need fewer staff per room than ryokan do, so the same room count implies different staffing requirements depending on the format mix. What is operationally meaningful is rather this: in prefectures such as Tokyo, Fukuoka and Aichi, which pair high estimated OCC with large allocation headroom, the opportunity cost of staffing becoming the binding constraint is also relatively large. As shown in our analysis of inventory allocation ratios across 12,941 hotels, many properties list only a portion of their total rooms on OTAs in the first place. Widening the staffing headroom therefore works in the direction of increasing the inventory that can be put on sale at all.
What Sets Accommodation Apart: 92% Came via the Exam Route
Looking at how accommodation-sector workers obtained their status brings out a sharp difference from the programme overall. As of end-December 2025, the 1,968 workers in accommodation break down into 1,811 via the exam route (92.0%) and 157 via the technical intern training route (8.0%). Across all 382,341 workers in all fields, by contrast, 174,625 (45.7%) came via the exam route and 207,399 (54.2%) via technical intern training — a majority transitioning out of the intern programme.
Source: Compiled by the HotelBank Editorial Team from Tables 7 and 8 of the Immigration Services Agency’s “Number of Foreign Nationals Residing under Specified Skilled Worker Status (end-December 2025)”
Accommodation has little accumulated history as a designated occupation under technical intern training, so the wide pipeline of “transition from intern training” that other fields have relied on barely exists here. That it nonetheless grew roughly 2.9x in a year is because the exam route — via the accommodation industry skills assessment test — worked on its own. This makes the 5,200-worker accommodation quota under the Employment for Skill Development programme, which starts in April 2027, all the more significant: a “development-to-SSW” pathway that is currently almost unused will be newly established. A separate question, the extension of Specified Skilled Worker (ii) — where the cap on length of stay is the point at issue — to the accommodation sector remains under discussion.
The demographic profile is distinctive too. Of the 1,968 workers in accommodation, 1,207 (61.3%) are women, well above the 46.3% female share across all fields. By age, 1,575 — 80.0% — are between 18 and 29. By nationality and region the order is Myanmar (653), Indonesia (450), Vietnam (229), Nepal (228) and the Philippines (101), with the top five accounting for 84.4% of the total. Compared with fields such as nursing care, the dependence on any single sending country is more dispersed, which adds depth in terms of the recruiting channels available.
Conclusion — Align the Yardstick and the Headroom Moves
Viewed from the residency statistics, three things can be said about the accommodation sector.
First, the absolute numbers are still small but the pace is fast. At 1,968, the level is only 0.51% of all SSW (i) holders, yet the +193.3% year-on-year growth rate is more than five times that of the programme as a whole. Provisional figures for end-March 2026 put the count at 2,207.
Second, measured by density, the leading areas are onsen destinations. Ranked per 1,000 rooms, Gunma (5.51) and Gifu (4.37) sit at the top, and at municipal level Kotohira (32.30), Yugawara (21.65) and Gero (19.11) already exceed the 11.68 national density that a fully filled 14,800-worker quota would imply. There is a demonstrated record of the programme spreading outward from formats built around the labour-intensive one-night, two-meal model.
Third, the headroom in volume terms remains in the high-demand urban markets. The correlation between estimated OCC and the normalized metric is -0.22: the further a prefecture’s inventory sells through, the thinner its staffing per room. Allocating by room stock, the largest headroom is in Tokyo (+1,800), Osaka (+1,026) and Hokkaido (+783). The 14.9% fill rate for accommodation means that more than 80% of the programme quota remains as workers who could yet enter the supply side.
Business surveys have separately pointed to an improving supply-demand picture, but the residency statistics show something independent of that: where, and by how much, the supply side has room to widen. With the April 2027 launch of the Employment for Skill Development programme adding a new entry point of 5,200 workers for accommodation, it is well worth checking where your own property sits, by prefecture and by format.
Related Articles
- Only Hotels That Capture Demand Survive: 2026’s Occupancy Ceiling
- Japan Ends the ¥1.06M Wage Threshold Oct 2026: Hotel Shift Design
- Median 39.2% of Rooms Online — Allocation Across 12,941 Hotels
References and Sources
Primary statistics (Immigration Services Agency)
- Immigration Services Agency, “Publication of the Number of Foreign Nationals Residing under Specified Skilled Worker Status” (end-December 2025 edition published March 27, 2026)
- Table 5: SSW (i) residents by prefecture and municipality, by designated industry field (end-December 2025, Excel)
- Table 7: By nationality and region, split by exam route and technical intern training route (end-December 2025, Excel)
- Table 8: By prefecture and municipality, split by exam route and technical intern training route (end-December 2025, Excel)
- Table 9: By designated industry field, by age and sex (end-December 2025, Excel)
- Projected Intake and Resident Numbers for Specified Skilled Worker (i) (as of end-March 2026, provisional) (posted July 10, 2026)
- Operational status of the Specified Skilled Worker system (end-December 2025)
Policy and operational guidelines
- Japan Tourism Agency, “Acceptance of Foreign Workers in the Accommodation Sector (Specified Skilled Worker status)” (operational guidelines for the accommodation sector adopted by Cabinet decision on January 23, 2026)
- Kanko Keizai Shimbun, “Government adopts operational guidelines for Specified Skilled Worker and Employment for Skill Development in the lodging industry” (February 3, 2026)
Data sources
Worker counts are from Tables 5, 7, 8 and 9 of the Immigration Services Agency’s “Number of Foreign Nationals Residing under Specified Skilled Worker Status” (as of end-December 2025, published March 27, 2026), and from “Projected Intake and Resident Numbers for Specified Skilled Worker (i)” (as of end-March 2026, provisional, posted July 10, 2026). Room stock and estimated OCC are aggregated by MetroEngines Research (27,248 properties and 1,266,952 rooms confirmed to be operating; estimated OCC for July 2026 across all 47 prefectures).
Estimation assumptions
Workers per 1,000 rooms is calculated as “the prefecture’s accommodation-sector worker count ÷ (the prefecture’s room stock ÷ 1,000).” The national density of 11.68 at full quota is derived as “14,800 ÷ (1,266,952 rooms ÷ 1,000).” Allocation-based headroom is an estimate resting on the mechanical assumption that the 14,800-worker projection is distributed in proportion to room stock; no government body has set prefecture-level allocation quotas.
Limitations and caveats
The numerator comes from residency statistics (counted in principle at the location of the accepting employer) while the denominator is the room stock confirmed to be operating on OTAs and similar channels, so the two population definitions are not perfectly aligned. In prefectures where only a handful of workers are registered, a single employer’s hiring decision can move the normalized metric substantially, so single-year rank differences should not be read directly as regional characteristics. The national figure of 1,968 includes 8 workers whose location is not determined, so the 47 prefectures sum to 1,960. Estimated OCC is derived from OTA-listed inventory and differs from a property’s true overall occupancy.
Market data
- MetroEngines Research — room stock (27,248 properties and 1,266,952 rooms confirmed to be operating) and estimated OCC (July 2026, all 47 prefectures)