

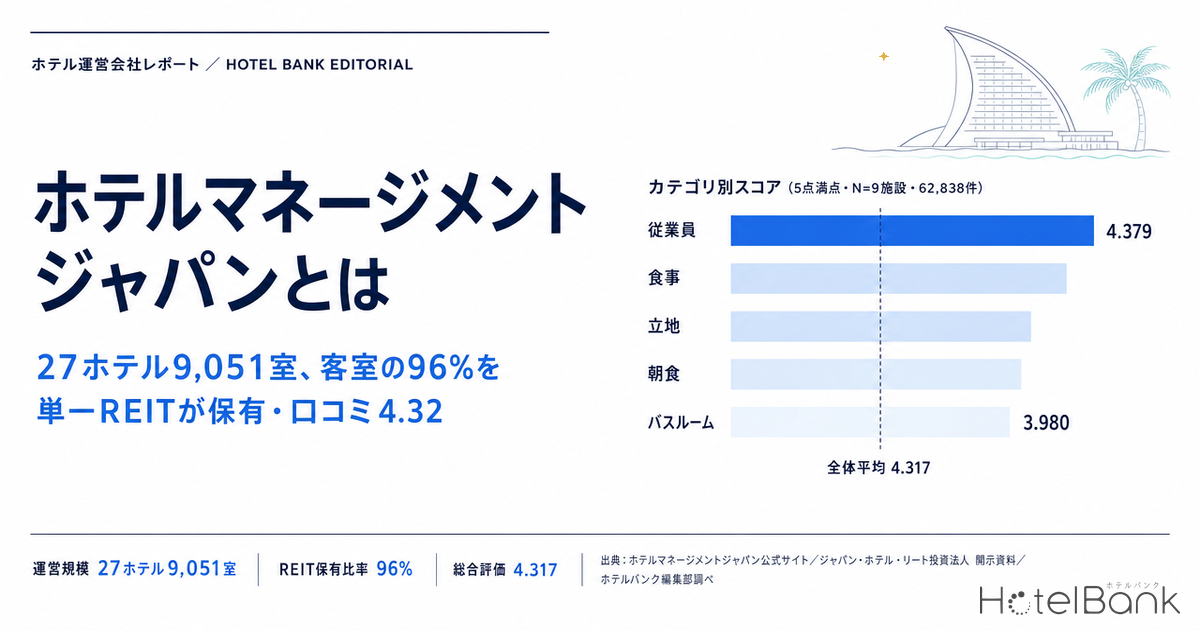
Hotel Management Japan (HMJ) is a third-party hotel operator that runs 27 hotels and 9,051 rooms in Japan under the chain brand Oriental Hotels & Resorts. Seen from an owner’s perspective, the outline of this company is hard to grasp from its brand site alone. Many of the properties it operates carry international brand flags rather than its own, so on booking sites they appear scattered across what look like separate chains. This article cross-references the company’s official disclosures, our own listed-REIT ownership master and 62,838 guest reviews to set out three things in numbers: Hotel Management Japan’s capital structure, its portfolio composition and its operating quality.
Metric Definitions Used in This Article
- Overall rating score / category scores: guest-submitted ratings on a 5-point scale, averaged at property level and then averaged across the properties in the sample. The aggregation window is the most recent 24 months.
- Mention rate: the share of all reviews that touch on a given theme, identified by running natural language processing over the review text. It indicates what is being talked about, not the rating score itself.
- Sample coverage (important): properties linked to the “Hotel Management Japan” chain in our hotel master for which a sufficient volume of reviews could be confirmed over the most recent 24 months. This is our aggregation population and does not match the number of hotels the company officially discloses as being under its management (27 hotels). Because the chain links in our master also include properties whose management agreements cannot be confirmed on the official site, this article does not name the sampled properties individually and treats them only as a sample size (N).
- Occupancy / ADR / RevPAR: the figures cited in this article are actual monthly operating results disclosed by Japan Hotel REIT Investment Corporation, and are calculated on a different basis from our own settled-rate estimates. ADR is room revenue divided by rooms sold; RevPAR is ADR multiplied by room occupancy.
- Data sources: HotelBank Editorial Team research (guest reviews), Hotel Management Japan Co., Ltd. official site, and Japan Hotel REIT Investment Corporation disclosures.
- — Operates 27 hotels and 9,051 rooms in Japan. A two-tier structure running its own brands alongside international brands means an owner can outsource operations while keeping an existing brand agreement in place.
- — Of the 27 hotels operated, 24 hotels — roughly 96% on a room basis — are owned by a single listed REIT (Japan Hotel REIT Investment Corporation).
- — That concentration is not the result of business development but a consequence of the capital structure: the operator and the REIT’s asset manager are sister companies within the same group.
- — Across 62,838 reviews (N=9 properties) the overall rating score is 4.317. The highest category is staff at 4.379, above the median of 4.105 and the third quartile of 4.269 for 50 major chains.
- — The weakest category is bathrooms at 3.980. Because the assets are held by the REIT, however, renovation capital cannot be committed by the operator alone.
What Hotel Management Japan is — a 2005-founded operator under a Singapore fund
Hotel Management Japan Co., Ltd. was established in August 2005 with capital of ¥50 million, and is headed by President and Representative Director Junichi Araki. Its head office is in Shinagawa Intercity Tower C in Konan, Minato-ku, Tokyo. The business description on its official site is “hotel management and operation”: this is not a development-led player holding large volumes of real estate on its own balance sheet, but an operator running assets owned by others under management contracts.
On the ownership side, the Singapore-based real estate investment firm SC Capital Partners holds the shares through a holding company. In brand lineage, the company inherited the “Oriental Hotel” name, which traces back to a Western-style hotel that opened in Kobe in 1870, and in 2021 it launched Oriental Hotels & Resorts as the chain brand tying its properties together. The result is a dual structure: 20 years of history as an operating company, behind a brand with more than 150 years of accumulated equity.
| Item | Detail |
|---|---|
| Company name | Hotel Management Japan Co., Ltd. (HMJ) |
| Established | August 2005 |
| Capital | ¥50 million |
| Representative | Junichi Araki, President and Representative Director |
| Head office | Shinagawa Intercity Tower C 8F, 2-15-3 Konan, Minato-ku, Tokyo |
| Business | Hotel management and operation |
| Chain brand | Oriental Hotels & Resorts (since 2021) |
| Operating scale | 27 hotels and 9,051 rooms in Japan (figure published on the official site) |
Source: compiled by the HotelBank Editorial Team from Hotel Management Japan Co., Ltd. official site, “Company Information”
Inside the 27 hotels — a two-tier structure running own brands and international brands side by side
Sorted by region, Hotel Management Japan’s portfolio breaks down into 9 properties in Kanto, 7 in Kansai, 7 in Chugoku and Kyushu, and 4 in Okinawa. The weighting sits in markets where both inbound and domestic leisure demand run deep — the Tokyo metropolitan area, Fukuoka and Okinawa.
What stands out is the brand mix. Alongside its own Oriental Hotel and Hotel Oriental Express brands, the company operates properties flying international and domestic chain flags including Hilton, Hyatt, Sheraton, Holiday Inn, Hotel Nikko and Hotel JAL City. Because operating conventions differ with each franchise or management agreement framework, the capabilities required are different from those of a chain operator rolling out a single brand. From an owner’s point of view, the practical characteristic of this company is that it offers the option of outsourcing operations alone while keeping an existing brand agreement in place, rather than having a house brand imposed. The company also continues to extend its own brand line-up.
Source: compiled by the HotelBank Editorial Team from Hotel Management Japan Co., Ltd. official site and Japan Hotel REIT Investment Corporation disclosures
The table below lists the properties shown on the official site’s hotel list by region, matched against the listed-REIT ownership master we maintain. Hakone Retreat is treated as a single property covering its two buildings, villa 1/f and före.
| Region | Hotel | Brand type | Rooms | Listed-REIT owned |
|---|---|---|---|---|
| Kanto | Hyatt Regency Tokyo | International brand | 746 | ● |
| Kanto | Hotel Oriental Express Ginza West | Own brand | 220 | ● |
| Kanto | Hotel Oriental Express Tokyo Kamata | Own brand | 158 | — |
| Kanto | Oriental Hotel Tokyo Bay | Own brand | 511 | ● |
| Kanto | Hilton Tokyo Odaiba | International brand | 453 | ● |
| Kanto | Hilton Narita | International brand | 548 | ● |
| Kanto | International Garden Hotel Narita | Independently operated | 463 | ● |
| Kanto | Hotel JAL City Kannai Yokohama | Domestic brand | 170 | ● |
| Kanto | Hakone Retreat (villa 1/f · före) | Own brand | 48 | — |
| Kansai | Oriental Hotel Kyoto Rokujo | Own brand | 166 | ● |
| Kansai | Hotel Nikko Nara | Domestic brand | 330 | ● |
| Kansai | Hotel Oriental Express Osaka Shinsaibashi | Own brand | 124 | ● |
| Kansai | Holiday Inn Osaka Namba | International brand | 314 | ● |
| Kansai | Namba Oriental Hotel | Own brand | 267 | ● |
| Kansai | Oriental Hotel Universal City | Own brand | 330 | ● |
| Kansai | Kobe Meriken Park Oriental Hotel | Own brand | 323 | ● |
| Chugoku & Kyushu | Sheraton Grand Hotel Hiroshima | International brand | 238 | ● |
| Chugoku & Kyushu | Oriental Hotel Hiroshima | Own brand | 227 | ● |
| Chugoku & Kyushu | Oriental Hotel Fukuoka Hakata Station | Own brand | 221 | ● |
| Chugoku & Kyushu | Hilton Fukuoka Sea Hawk | International brand | 1,052 | ● |
| Chugoku & Kyushu | Hotel Oriental Express Fukuoka Tenjin | Own brand | 263 | ● |
| Chugoku & Kyushu | Hotel Oriental Express Fukuoka Nakasu Kawabata | Own brand | 183 | ● |
| Chugoku & Kyushu | Hotel Oriental Express Kagoshima Tenmonkan | Own brand | 165 | — |
| Okinawa | Oriental Hotel Okinawa Resort & Spa | Own brand | 361 | ● |
| Okinawa | Hotel Nikko Alivila | Domestic brand | 397 | ● |
| Okinawa | Okinawa Harborview Hotel | Independently operated | 352 | ● |
| Okinawa | Southern Beach Hotel & Resort Okinawa | Independently operated | 448 | ● |
Source: compiled by the HotelBank Editorial Team from Hotel Management Japan Co., Ltd. official site and Japan Hotel REIT Investment Corporation disclosures (N=27 properties)
Note: room counts for listed-REIT owned properties are the REIT’s disclosed figures; for the rest they are the values registered in our hotel master. The 746 rooms and September 1980 opening for Hyatt Regency Tokyo follow the figures in Hyatt Hotels & Resorts Japan’s “Press Release, April 2026”, which uses a different inclusion basis from the room count the REIT discloses for its own asset (712 rooms). The room counts in this table sum to 9,078, which differs from the officially published total of 9,051 rooms because of differences in disclosure timing and inclusion basis between the sources. Note also that Hilton Tokyo Odaiba (453 rooms) is scheduled for a major renovation from February 2026 through the end of December 2027, and the REIT has excluded the hotel from the group of hotels covered by its monthly disclosure from 2026. The results for the 29 hotels with variable-rent and similar structures discussed below therefore do not include this hotel.
Source: Japan Hotel REIT Investment Corporation, “Notice Concerning Monthly Disclosure for July 2026” (26 August 2026)
Source: Hyatt Hotels & Resorts Japan Co., Ltd., “Press Release, April 2026”
Source: compiled by the HotelBank Editorial Team from Hotel Management Japan Co., Ltd. official site and Japan Hotel REIT Investment Corporation disclosures
Roughly 96% of rooms held by a single listed REIT — the distance between operator and asset owner
When Hotel Management Japan is considered as an operating partner, the relationship with the asset-owning side is the point most easily overlooked. Matching the hotel names published on the official site against the listed-REIT ownership master we maintain (53 properties disclosed by Japan Hotel REIT Investment Corporation) confirms that 24 of the 27 hotels are owned by that REIT. On a room basis this is 8,707 of 9,078 rooms — in other words, roughly 96% belongs to a single listed REIT.
This means the company’s management portfolio was not built up deal by deal from a diverse set of unrelated owners, but formed around assets tied to a specific sponsor group. Japan Hotel REIT Investment Corporation moved these HMJ group-operated hotels and others to fixed-rent lease agreements in 2020, and in 2021 switched them to fully variable rent. Under that design, the operator’s earning power feeds directly through rent into unitholder distributions, which makes operating quality a matter of immediate concern for investors.
The point to hold onto is that this 96% concentration is a consequence of the capital structure rather than of business development. Japan Hotel REIT Advisors Co., Ltd., the REIT’s asset manager, is owned 87.6% by SCJ One (S) Pte. Ltd. of the SC Capital Partners group, 10.3% by Kyoritsu Maintenance Co., Ltd. and 2.1% by ORIX Corporation (as of 1 April 2026). The REIT’s monthly disclosure explicitly describes Hotel Management Japan as “a group company of the asset manager”. The operator and the asset manager are, in short, sister companies inside the same group.
Seen from the position of an owner weighing an operating partner, this structure cuts both ways. Because asset owner, asset manager and operator all sit within one group, decisions such as renovations or changes to the rent structure can move quickly; an owner outside the group, however, stands outside that decision-making line. The track record of the management business itself is set out in the review aggregation below, but how contract terms and reporting granularity should be designed is hard to think about on the same assumptions that apply to in-group properties. Anyone considering an outsourcing arrangement will want to check, case by case, the company’s track record on properties outside the group and the owner-reporting structure that came with them.
Source: Japan Hotel REIT Advisors Co., Ltd., “Company Profile”; Japan Hotel REIT Investment Corporation, “Notice Concerning Monthly Disclosure for July 2026” (26 August 2026)
The REIT’s disclosed monthly operating results for July 2026 show, for the 29 hotels with variable-rent and similar structures combined, occupancy of 83.1%, ADR of ¥21,806 and RevPAR of ¥18,119. Year on year that is occupancy +4.0pt, ADR +0.1% and RevPAR +5.1%. The shape of this is a RevPAR gain built by stacking up occupancy while holding rate essentially flat — operational improvement that does not lean on pushing price. Note that these 29 hotels also include properties run by operators other than the HMJ group, so the figures are not the company’s results on a standalone basis.
For owners and investors there are two ways to read this structure. One is the stability and accumulated know-how that come from an operating platform rooted deeply in a single sponsor group. The other is that an owner outside the group considering an outsourcing arrangement can draw more of that accumulated capability across to their own situation by checking, individually, operating cases close to their own asset type. Ownership structure and the cost side of hotel assets are also set out in our analysis of hotel acquisition costs at 7.1% of price, turning a 6.5% gross yield into 4.65% net. The fact that the parent is a Singapore-based fund also intersects with Japan’s regulatory environment for foreign acquisitions of hotel real estate.
Operating quality across 62,838 reviews — staff, at 4.379, is the strongest category
So where does the company’s capability as an operator actually show up? Aggregating the most recent 24 months of guest reviews collected by the HotelBank Editorial Team for the properties linked to the company’s chain in our master gives a sample of 9 properties and 62,838 reviews, with an overall rating score of 4.317 (out of 5). Broken down by category, the highest is staff at 4.379, followed by food at 4.341, location at 4.341, breakfast at 4.336 and amenities at 4.334.
What is worth noting is that the property-to-property dispersion of the staff score is among the smallest of the ten categories (standard deviation 0.152, the second smallest, behind amenities at 0.150). Compared with cleanliness (0.246), rooms (0.237) and location (0.225), it sits at 60–70% of those levels, which shows that quality is consistent in exactly the area the operator can control, rather than in areas dictated by the asset — the building and its location. In gauging the capability of a third-party operator, the categories with the least variation between properties are the ones that evidence the existence of an operating template.
Source: HotelBank Editorial Team research (N=9 properties, 62,838 reviews, most recent 24 months)
How should the 4.317 level be read? Aggregating 50 major chains on the same basis (2,731 properties, approximately 5.64 million reviews) puts chain-level overall rating scores at a median of 4.105 and a third quartile of 4.269. HMJ’s 4.317 sits above that third quartile, placing it in the upper band for chain operations. A third-party operator cannot choose its own assets, which means taking on properties where location and building age do not line up favourably. Holding an upper-band score under that constraint carries meaning as a track record when comparing potential operating partners.
Source: HotelBank Editorial Team research (comparison population: 50 major chains, 2,731 properties, approximately 5.64 million reviews, most recent 24 months)
Note: the 50 chains in the comparison population were selected by property count, and HMJ’s 9 sampled properties are not included in that population. Individual chain names are not disclosed.
Nine of the ten categories land at 4.2 or above, while bathrooms, at 3.980, is the only one below 4. This is a hard area to avoid in a portfolio that includes older assets, and it is also where renovation capital tends to work hardest. As noted above, the assets are held by a listed REIT, so capital expenditure decisions do not rest with the operator alone. Whether a relationship exists in which operating quality and renovation planning can be discussed together will shape where this category goes. Water-related facilities scoring relatively low among review categories is not unique to this portfolio: the same pattern shows up in our analysis matching Kyoto’s review score distribution against estimated settled ADR.
What guests talk about — guest service and food dominate the review themes
Looking beyond scores at what guests actually write about brings the operator’s character into sharper relief. Running natural language processing over the review text produces mention rates by theme (15 properties, most recent 24 months). At the top are room cleanliness at 21.4%, food in general at 20.6%, room size at 17.0%, location in general at 15.8% and guest service in general at 13.1%.
Source: HotelBank Editorial Team research (review analysis using natural language processing, N=15 properties, most recent 24 months)
Breaking the guest-service area down further, staff friendliness and smiles account for 7.49%, courtesy of service delivery 6.20%, check-in handling 5.46% and front-desk work 5.27% — mentions accumulate across several sub-themes rather than in one. It is not that a single star property is pulling up the average; the structure is one in which guest service comes up readily across the portfolio. For a yardstick on how mention rates swing with segment and price band, our aggregation of 200,000 hotel reviews, breaking out breakfast and staff mention rates provides the comparison.
Food is similar: alongside food in general at 20.6%, breakfast buffet stands at a high 7.47%. The reviews themselves carry comments such as “breakfast was delicious with a great variety” and “the morning meal was varied and tasty” (Kobe Meriken Park Oriental Hotel), and “the Okinawan local dishes laid out at breakfast” (Oriental Hotel Okinawa Resort & Spa) — mentions of breakfast with regional character woven in.
The highest overall rating within the sample belongs to Hotel Nikko Alivila (Yomitan, Okinawa), with a score of 4.459 across 7,966 reviews. Its guest-service mention rates also rank at the top of the sample. Comments such as “the staff always smile”, “the courteous service is something I look forward to every time” and “the staff were kind and the level of hospitality surprised me” suggest that people are at the centre of the stay experience in a resort setting. Holding that level of rating at a resort scale of 397 rooms is evidence of depth in the operating platform.
Three perspectives when assessing the company as an operating partner
Organised from the standpoint of an owner considering an operating partner, the figures above come down to three points.
First, flexibility on brand agreements. The company has a track record of running its own brands (Oriental Hotel, Hotel Oriental Express) in parallel with international brands (Hilton, Hyatt, Sheraton, Holiday Inn) and domestic brands (Hotel Nikko, Hotel JAL City), which makes it straightforward to outsource operations alone while keeping an existing brand agreement in place. The range of formats is wide as well, from large full-service hotels to select-service properties in the 150–250 room range.
Second, consistency in the quality of people. The staff score of 4.379 is the highest of the ten categories aggregated, and its dispersion between properties is the smallest. That is corroborating evidence that training and operational standardisation are working, and it is a result delivered in the area where reproducibility matters most in third-party management.
Third, understanding the asset ownership structure. The fact that 24 of the 27 hotels operated — roughly 96% on a room basis — are held by a single listed REIT is a strength in terms of stable in-group operations, and at the same time means that an owner outside the group considering an outsourcing arrangement has reason to check individual operating cases close to their own asset type, location and brand conditions. For a sense of the scale of Japan’s largest hotels, our Top 30 ranking by room count is also a useful reference.
The practical way to evaluate a third-party operator is not by counting flags but by asking in which areas quality is consistent. In Hotel Management Japan’s case the answer shows up clearly in guest service and food — areas that depend on people and operating design rather than on the asset.
Note on the sample: the review aggregation in this article uses as its population the properties linked to the “Hotel Management Japan” chain in our hotel master. Because that population may include properties whose management relationship cannot be confirmed on the official hotel list, the sampled properties are not listed individually and are treated only as a sample size (N). The number of hotels the company officially discloses as being under its management (27) does not match the number of properties in our sample. In addition, the category scores (N=9 properties) and the mention rates (N=15 properties) use different aggregation requirements, so the number of properties covered also differs.
Related reading
References and sources
■ Data sources
Basic company information, the list of hotels operated and the total room count are figures published on the Hotel Management Japan Co., Ltd. official site. Occupancy, ADR and RevPAR, and the scope of hotels covered, come from the monthly operating results disclosed by Japan Hotel REIT Investment Corporation (July 2026, dated 26 August 2026). The shareholder composition of the asset manager is from that company’s “Company Profile” (as of 1 April 2026). Category scores and theme-level mention rates from guest reviews were aggregated by the HotelBank Editorial Team over the most recent 24 months. Listed-REIT ownership was determined by matching the official hotel list against the ownership master we maintain.
■ Calculation assumptions
Overall rating scores and category scores are property-level averages further averaged across the sampled properties (N=9 properties, 62,838 reviews). Mention rates come from semantic analysis of review text and use different aggregation requirements, so the number of properties covered also differs (N=15 properties). The population used for the between-chain distribution comparison is 50 major chains aggregated on the same basis (2,731 properties, approximately 5.64 million reviews), selected by property count and excluding our 9 sampled properties. Room counts are the REIT’s disclosed figures for listed-REIT owned properties and the values registered in our hotel master for the rest.
■ Limitations and caveats
First, the population for the review aggregation (properties linked to this chain in our master) does not match the 27 hotels the company officially discloses as being under its management. Because it may include properties whose management relationship cannot be confirmed on the official site, this article does not name the sampled properties individually and treats them only as a sample size. Second, the occupancy, ADR and RevPAR cited here are the combined figures for the 29 hotels with variable-rent and similar structures, and those 29 hotels include properties run by operators outside the company’s group, so they are not the company’s standalone operating results. Hilton Tokyo Odaiba is also excluded from that disclosure because of its major renovation. Third, because room counts are compiled on different bases depending on the owner, the 9,078-room total used here does not match the officially published figure of 9,051 rooms. Fourth, this article describes operating quality and capital structure; it does not address the terms, fee structure or termination provisions of management agreements. A final comparison of operating partners requires those contract terms to be checked separately.
■ Official company information
- Hotel Management Japan Co., Ltd., “Company Information” (Oriental Hotels & Resorts official site)
- Oriental Hotels & Resorts official site (list of hotels operated)
- Hyatt Hotels & Resorts Japan Co., Ltd., “Press Release, April 2026” (opening year and room count for Hyatt Regency Tokyo)
■ Listed REIT disclosures
- Japan Hotel REIT Investment Corporation official site (monthly operating status and portfolio disclosure)
- Japan Hotel REIT Investment Corporation, “Monthly Operating Results, July 2026” (29 hotels with variable-rent and similar structures combined: occupancy 83.1% / ADR ¥21,806 / RevPAR ¥18,119)
■ Our own data
- HotelBank Editorial Team research — category scores from guest reviews (N=9 properties, 62,838 reviews, most recent 24 months)
- HotelBank Editorial Team research — theme-level mention rates from guest reviews using natural language processing (N=15 properties, most recent 24 months)
- MetroEngines Research — listed-REIT ownership master (matched against the 53 properties disclosed by Japan Hotel REIT Investment Corporation)
■ Further reading