

With labour increasingly hard to secure and costs still climbing, a second operating model is taking hold in Japan alongside the conventional approach of turning rooms over one night at a time: the extended-stay model, which places length of stay itself at the centre of product design. This article uses MetroEngines Research listing data on plans carrying consecutive-night conditions to set out the revenue structure of extended-stay hotel operations quantitatively, across four dimensions — rate, occupancy, operating cost and contract form. It is written for operators weighing the introduction of long-stay plans or a change of format, and for investors looking at extended-stay assets.
Metric Definitions Used in This Article
- Listed price: the selling price each property publishes on booking sites. In this article it means the per-room amount for two guests in one room (tax included), on a per-night basis. All comparisons in Sections 2 and 3 are on this listed-price basis.
- ADR (average daily rate): an estimated settled rate (tax-excluded equivalent) derived by applying a format-specific adjustment coefficient to the lowest published plan level at each property. Cross-checked against property-level results disclosed by listed hotel REITs (91 properties, most recent three months), the median error is about 7%. It is an estimate and differs from each property’s actual transacted prices and accounting figures. Area-level ADR is the median across the properties covered.
- OCC (occupancy rate): sold rooms as a share of total rooms in the area (an estimate based on booking-site sales inventory). The occupancy rates used in the Section 4 calculation are assumptions for that calculation.
- Minimum nights: the consecutive-night condition attached to a plan (for example, 2 nights or more, 7 nights or more). The values contained in the listing information were aggregated.
- Data source: MetroEngines Research
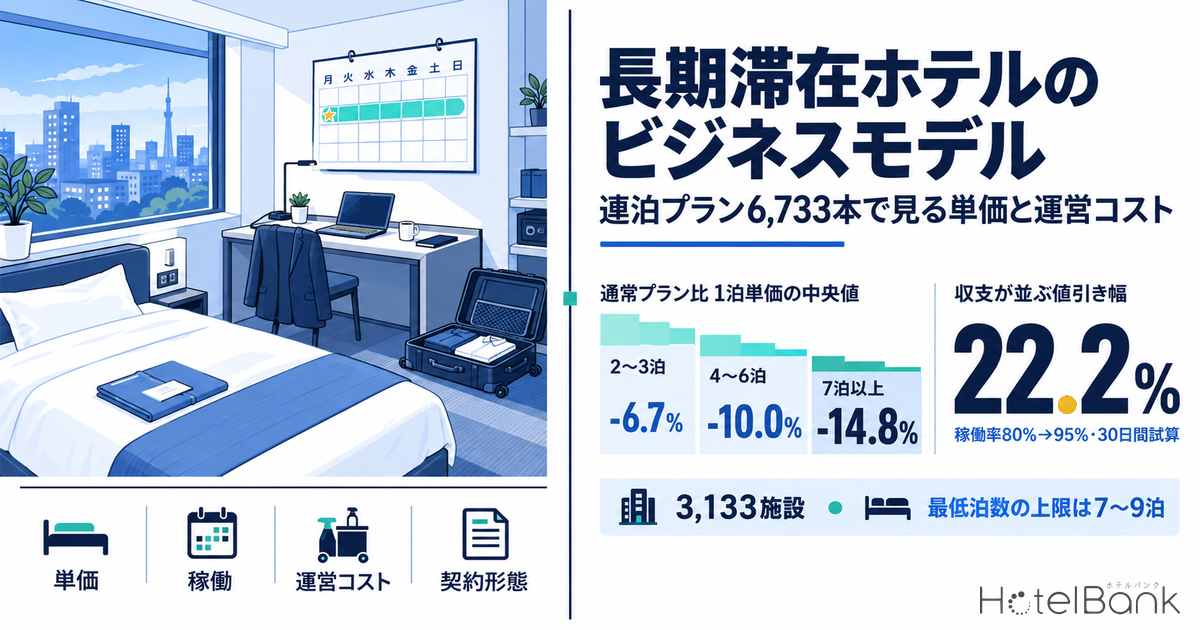
- — -14.8%: the measured per-night rate of plans requiring 7 nights or more, within the same property and the same room type (median versus standard plans, N=93 properties). The gap deepens in steps — -6.7% at 2-3 nights and -10.0% at 4-6 nights.
- — 7-9 nights is the ceiling: across the 1,804 properties where minimum nights could be identified, no listed plan required 14 nights or more. The 30-night band trades outside public inventory, through corporate contracts and direct sales.
- — 22.2%: the discount at which the two models break even in a 30-day calculation assuming occupancy rising from 80% to 95% and three cleanings per 7 nights (the rate is the estimated settled ADR as of August 2026). At 90% occupancy it narrows to 18.3%.
- — The advertised discount is not the effective price gap: the discount stated in plan names (median 20% at 7 nights or more) is consistently larger than the measured figure. Pricing has to be tested against the price gap within your own property’s same room type.
Where the Extended-Stay Model Diverges From Conventional Room Operations
Treating the extended-stay model as simply offering a consecutive-night discount is the easiest way to design it wrong. The dividing line is not the discount rate but a replacement of the revenue drivers. Conventional room operations build daily revenue by multiplying nightly rate by occupancy; the extended-stay model designs monthly revenue per room from length of stay, rate and low variable cost. The room is the same, but the unit being sold shifts from one night to a period of stay.
First, the stability of occupancy changes. A room that fills only after thirty one-night bookings and a room that fills on four seven-night bookings require an order-of-magnitude different number of bookings. Acquisition cost per booking — advertising, commission, staff handling — is spread across the nights of the stay, so the longer the stay, the lower the acquisition cost per night. Being less exposed to the swing between weekend and weekday demand is another design advantage of long stays.
Second, the thinking behind the rate changes. The extended-stay model lowers the nightly rate, but as pricing exchanged for a committed length of stay rather than as a discount. As shown below, measured within the same property and the same room type, plans carrying a condition of 7 nights or more priced a median of 14.8% below standard plans. Whether that level works economically depends on how occupancy and variable costs are designed.
Third, cleaning and linen frequency moves operating cost directly. Between an operation that resets the room every night and one that limits itself to roughly twice-weekly servicing during a stay, variable cost per room-night can more than halve. In practice a meaningful share of consecutive-night plans state no cleaning or eco explicitly — an environmental appeal, and at the same time the cost design itself.
Fourth, the mix of sales channels changes. The longer the stay, the higher the share transacted outside public inventory — corporate contracts, direct sales, long-stay brokers. As Section 3 shows, consecutive-night conditions in listing data top out at 7-9 nights, and bands longer than that cease to be observable as listed inventory. Demand does not disappear; the venue for the transaction moves.
| Revenue driver | Conventional room operations | Extended stay (built around 7+ nights) |
|---|---|---|
| Unit sold | One night | Length of stay (weeks, months) |
| Nightly rate | Varied by demand date | Fixed lower in exchange for a committed period (measured median -14.8%) |
| Nature of occupancy | Exposed to day-of-week and seasonal swings | Inventory is locked during a stay, smoothing the swings |
| Cleaning and linen | Incurred every night | Mid-stay cleaning frequency becomes a design variable |
| Booking acquisition | 30 room-nights requires many separate bookings | The same room-nights are secured with few bookings |
| Demand source | Leisure, business travel, events | Long assignments, construction, training, medical accompaniment, larger inbound parties, relocation scouting |
| Room specification | Centred on sleeping | Kitchen, washing machine, storage and a work desk move the price |
Source: MetroEngines Research; compiled by the HotelBank Editorial Team
Measured: The Longer the Consecutive-Night Condition, the Lower the Nightly Rate
From here the analysis moves to measurement against listing data. Plans with consecutive-night conditions confirmed as listed by MetroEngines Research on or after 15 August 2026 number 32,797 across 3,133 properties (6,733 once duplicate property-plan-name combinations are removed). Plans for which minimum nights could be identified were grouped into three bands, and the discount rates stated in plan names were aggregated. Separately, listed prices for standard plans and consecutive-night plans were matched within the same property and the same room type to measure the actual difference in nightly rate.
The measurement was designed as follows. Listed prices for October 2025 check-in dates (two guests, one room, tax included, per night) were aggregated by property and room type; within each room type, the median of plans without a consecutive-night condition was taken as the denominator and plans with one as the numerator. Cells observed on fewer than 10 days were excluded. This removes differences in price band between properties and differences between room types from the comparison.
Source: MetroEngines Research; compiled by the HotelBank Editorial Team (discounts stated in plan names N=446 plans; within-property measured comparison N=1,429 properties across 4,512 property-by-room-type combinations, October 2025 check-in)
The result was clear. Within the same property and room type, the nightly rate was 6.7% below standard plans at a 2-3 night condition (N=1,354 properties), 10.0% below at 4-6 nights (N=223 properties) and 14.8% below at 7 nights or more (N=93 properties) — deepening in steps as the minimum-night requirement lengthens. Among properties with a condition of 7 nights or more, most set a nightly rate below their standard plans.
The discount rates written into plan names, meanwhile, ran to a median of 10% at 2-3 nights, 15% at 4-6 nights and 20% at 7 nights or more — consistently larger than the measured figures. This does not mean the display is wrong. It is that the reference price the stated discount points back to and the actual selling-price band for the same room type are two different things. When setting prices, profitability has to be tested against the effective price gap within your own property’s same room type, not against the discount on display. The going discount by number of nights as a guest sees it is also measured in Japan Hotel Long-Stay Discounts: 15% at 7 Nights, 20% at 30 Nights.
Source: MetroEngines Research; compiled by the HotelBank Editorial Team (distribution built on property-level medians; 2-3 nights N=1,354 properties, 7+ nights N=93 properties)
The distribution shows pricing philosophy splitting in two. Among 2-3 night plans, 32.8% of properties offer the same level as their standard plans — no discount at all. A substantial number of short consecutive-night plans are designed as a convenience product for guests staying several nights rather than as a discount product. Among properties with a condition of 7 nights or more, by contrast, 30.1% set a gap wider than 20%, and the dominant design clearly lowers the rate as consideration for a committed period.
The Ceiling on Consecutive-Night Conditions Is 7-9 Nights — the 30-Night Band Sits Outside Public Inventory
For thinking about the business model there is a finding more important than the price gap itself. Aggregating the minimum-night values contained in listing information at property level, the ceiling stops at 7-9 nights, and no plan conditioned on 14 nights or more, or 30 nights or more, could be observed. Of the 1,804 properties where minimum nights could be identified, 1,412 (78.3%) top out at 2-3 nights, 253 (14.0%) at 4-6 nights and 139 (7.7%) at 7 nights or more. Only 8 properties carried wording equivalent to monthly or one month in a plan name.
Source: MetroEngines Research; compiled by the HotelBank Editorial Team (1,804 properties where the minimum-night value could be identified; aggregated on each property’s maximum, listings confirmed on or after 15 August 2026)
This 7-9 night wall captures the structure of the long-stay business well. Up to roughly a week, the product still fits inside public retail sale; beyond that the band moves from public inventory to negotiated transactions. Specifically: corporate contracts substituting for company housing, block holds by construction or project, long-stay quotes on direct-booking sites, and referral into a monthly-rental business. The reason the rate for a 30-night stay cannot be measured from public prices is not missing data but that the band is transacted in a different form.
There are two implications for operators. One is that a two-tier structure — designing up to 7 nights as a public retail ladder and connecting anything longer to a quote-and-contract path — matches current market practice. The other is that as the share moving outside public inventory rises, the commission burden falls but a sales function capable of winning demand unaided becomes necessary. Assessing the profitability of an extended-stay operation therefore has to take the business plan beyond the rate card, to how that sales function will be built in-house.
From an investor’s perspective the same two-tier structure is a caution in valuation. Public prices support estimates only as far as the short-to-medium consecutive-night band; rate and occupancy in the long-contract band depend on operator disclosure. In practice, due diligence should include revenue mix by contract length, renewal rates on corporate contracts, and notice-period terms for cancellation.
Cleaning and Linen Frequency Decide the Economics — a Simplified 30-Day Calculation
Whether a lower rate still works is decided by the design of variable costs. The share of consecutive-night plans explicitly stating no cleaning or eco runs to 18.8% at 2-3 nights, 14.6% at 4-6 nights and 27.7% at 7 nights or more — the longer the stay, the more likely the cleaning design is spelled out (N=4,994 consecutive-night plans). Cleaning frequency is treated as an environmental appeal and, at the same time, as a variable that moves cost directly.
On that basis, here is a simplified 30-day profit calculation for a single room. The assumptions: a nightly rate of ¥11,600, taken from the estimated settled ADR for business hotels in Tokyo (about ¥11,600 as of August 2026, N=915 properties); 80% occupancy under conventional operation; 95% occupancy under consecutive-night-led operation; a nightly rate for consecutive-night stays 14.8% below that, the measured median; and an outsourced room-cleaning price of ¥1,800 per room per cleaning (market rates run ¥1,500-¥3,500 per room, with ¥900-¥1,800 cited as a guide under occupancy-linked per-room pricing. Source: industry material on outsourced cleaning rates, listed in the source list at the end). Cleanings were set at one per night under conventional operation and three per 7 nights under consecutive-night operation (two mid-stay plus one on departure).
| One room, 30 days | Conventional operation | Consecutive-night-led operation (7+ nights) |
|---|---|---|
| Assumed occupancy | 80% | 95% |
| Room-nights sold | 24.0 nights | 28.5 nights |
| Nightly rate (assumption) | ¥11,600 | ¥9,900 (-14.8%) |
| Room revenue | ¥278,400 | ¥282,200 |
| Cleanings | 24.0 | 12.2 |
| Cleaning cost (at ¥1,800) | ▲¥43,200 | ▲¥22,000 |
| Net (room revenue less cleaning cost) | ¥235,200 | ¥260,200 |
Source: MetroEngines Research; compiled by the HotelBank Editorial Team (simplified calculation; assumptions as stated in the text)
On these assumptions, even with the nightly rate cut by 14.8%, occupancy rising 15 points and cleanings halving leave the net figure about ¥25,000 higher per month (+10.6%). Working backwards, the discount at which the two break even is 22.2%. In other words, if a design of 95% occupancy with twice-weekly cleaning can be achieved, a reduction in nightly rate of up to roughly 22% falls inside the range that is profit-neutral. The measured median of 14.8% for plans of 7 nights or more sits inside that range.
Sensitivity (varying the assumptions in the same calculation)
- If occupancy under consecutive-night operation reaches only 90%: the net figure is ¥246,500, about ¥11,000 above conventional operation, and the break-even discount narrows to 18.3%.
- If the cleaning price is ¥1,200: ¥267,500 under consecutive-night operation against ¥249,600 under conventional operation, a gap of about ¥18,000. The lower the cleaning price, the smaller the advantage from shifting to consecutive-night stays.
- The calculation covers only room revenue and cleaning cost; it excludes sales commission, advertising, linen stock, utilities and the fixed portion of labour. Where the share of contracts struck outside public inventory rises, a lower commission burden is a further additive factor.
Viewing the sensitivity on two axes makes it clearer which combinations decide success or failure. The table below holds the assumptions of the calculation above (conventional operation at ¥11,600 per night, based on the estimated settled ADR as of August 2026, and 80% occupancy; cleaning under consecutive-night operation at three per 7 nights at ¥1,800 each) and varies two things — occupancy under consecutive-night operation and the discount on the nightly rate — showing the difference against the ¥235,200 net figure for conventional operation.
| Occupancy under consecutive-night operation (assumption) \ discount | -10% (¥10,400) | -14.8% (¥9,900) | -20% (¥9,300) | -25% (¥8,700) |
|---|---|---|---|---|
| 80% | -¥4,000 | -¥16,000 | -¥31,000 | -¥45,000 |
| 85% | +¥10,000 | -¥2,000 | -¥18,000 | -¥33,000 |
| 90% | +¥25,000 | +¥11,000 | -¥5,000 | -¥21,000 |
| 95% | +¥39,000 | +¥25,000 | +¥8,000 | -¥9,000 |
Source: MetroEngines Research; compiled by the HotelBank Editorial Team (simplified calculation; nightly rates rounded to the nearest ¥100, cleanings set at occupied nights x 3/7. The shaded cell is the base case described in the text)
Over the 30-day window, at 95% occupancy the net figure stays positive even at a 20% discount, while at 80% — the same as conventional operation — it turns negative even at a 10% discount. Cutting the number of cleanings alone cannot absorb the discount: whether occupancy can be lifted past 85% is the dividing line for justifying a discount at the measured median of -14.8%.
What the calculation shows is that the profitability of an extended-stay operation is decided not by how far the rate is cut but by whether the lift in occupancy and the cleaning-frequency design hold together as a pair. Cut the rate without lifting occupancy and the economics deteriorate; add consecutive-night stays without changing cleaning frequency and variable costs do not fall. As a practical suggestion: at the early stage of considering the move, settling the frequency and scope of mid-stay cleaning before settling the discount rate is the starting point for the revenue design.
Where the Consecutive-Night Inventory Sits — Distribution by Area and Format
Among properties listing plans with consecutive-night conditions, the 1,804 where the minimum-night value could be identified break down by prefecture with Okinawa highest at 173 properties, followed by Kyoto at 153, Tokyo at 149, Hokkaido at 131 and Osaka at 113. The distinguishing feature is that they are spread across both urban and resort areas — and the demand sources in the two differ.
Source: MetroEngines Research; compiled by the HotelBank Editorial Team (of the 3,133 properties confirmed as listing plans with consecutive-night conditions, the 1,804 where the minimum-night value could be identified, aggregated by prefecture)
By format, business hotels are the largest group at 877 properties, followed by ryokan at 203, city hotels at 191, resort hotels at 148, hostels at 86, rental villas at 67 and machiya townhouses at 57 (on the base of 1,804 properties where minimum nights could be identified). That business hotels are driven mainly by long assignments is as expected, but it is easy to miss that formats offering a whole building or large rooms — ryokan, rental villas, machiya — account for a meaningful number. The common thread is that rooms combining space for a group, the ability to cook and the ability to do laundry tend to lengthen stays.
This picture is consistent with international brand architecture. In Hilton’s brand portfolio, three of the five brands in the all-suite segment — Homewood Suites by Hilton, Home2 Suites by Hilton and LivSmart Studios by Hilton — are positioned as extended stay. The same all-suite segment has newly gained Apartment Collection, covering furnished apartments, as a lodging category (source: Hilton, Company Overview, updated 25 August 2026). None has yet rolled out in Japan. Against markets abroad where extended stay is established as a brand category, Japan is still in the middle of building it out as a format.
Movement on the supply side is emerging in Japan as well. In February 2026 Mitsubishi Estate (三菱地所) and Mitsubishi Estate Hotels & Resorts launched WAYPOINT, an apartment-hotel brand aimed at extended-stay demand, and opened the first property, WAYPOINT TSUKIJI TOKYO, on 1 April 2026. The target is ten properties by 2030 (source: Mitsubishi Estate press release, 2 February 2026). Conversion by renovating an existing property carries a shorter payback period than new-build development, which makes it a useful reference for existing assets weighing a change of format toward extended stay.
How the Business Structure Differs From Rental Housing and Monthly Apartments
Whenever the viability of an extended-stay hotel is assessed, monthly apartments (マンスリーマンション) and ordinary rental housing become the inevitable comparison. On the surface both amount to renting a furnished room by the month, but the contract form and the governing legislation differ, and the difference in revenue structure follows from that. What follows is a general outline; whether it applies to any specific project has to be confirmed with the relevant public health centre or local authority.
A hotel operates under the Hotel Business Act (旅館業法), and its relationship with the guest is an accommodation contract. Most monthly apartments, by contrast, operate under a fixed-term building lease under the Act on Land and Building Leases, placing them between the hotel business and ordinary real-estate letting. A Ministry of Health, Labour and Welfare notification (No. 23 of 29 January 1988, Questions on the Application of the Hotel Business Act) sets out two tests for whether an operation constitutes lodging people under the Act: that responsibility for maintaining the sanitary condition of the facility is, by ordinary social understanding, recognised as resting with the operator; and that the operation is conducted on the principle that users do not hold the base of their daily life in the room. For weekly apartments, even where the user performs cleaning during the period of use, the basic elements of sanitary management — cleaning and bedding management at changeover — have been held to rest with the operator, and such operations have accordingly been treated as falling under the Hotel Business Act.
| Item | Hotel (including extended stay) | Monthly apartment | Ordinary rental housing |
|---|---|---|---|
| Contract form | Accommodation contract | Mainly a fixed-term building lease (some are operated as a hotel business, depending on the operating model) | Building lease |
| Principal governing law | Hotel Business Act | Act on Land and Building Leases, or the Hotel Business Act depending on the operating model | Act on Land and Building Leases |
| Responsibility for sanitary management | Operator | Varies by operating model | Resident (private areas) |
| Freedom to reprice | High (can be set daily in line with demand) | Moderate (fixed during the contract term) | Low (at contract renewal) |
| Nature of revenue | Variable (occupancy x rate) | Quasi-fixed (for the contract term) | Fixed (rent) |
| Who bears operating cost | Operator (cleaning, linen, front desk) | Operator (mainly at move-in and move-out) | Landlord (common areas, restoration) |
| Tenant screening and credit | Generally none (same-day use possible) | Often a light screening | Screening and a guarantor company are standard |
Source: compiled by the HotelBank Editorial Team from the Ministry of Health, Labour and Welfare notification Questions on the Application of the Hotel Business Act (No. 23, 29 January 1988) and related material. This is a general outline; applicability in any specific case rests with the judgement of the relevant local authority
Put in a sentence, the difference in revenue terms is that hotels enjoy freedom to reprice but carry occupancy risk, while rental housing has stable occupancy but few opportunities to reprice. The extended-stay hotel is designed to sit between the two: it lowers occupancy risk by securing a committed length of stay and lowers the nightly rate as consideration. The price gap measured in Section 2 can be read as precisely the price of that risk transfer. The number of nights at which the monthly format becomes cheaper from the guest’s side is calculated in Weekly Apartment vs Hotel in Tokyo: Break-Even at About 4 Nights.
For investment decisions, accordingly, extended-stay assets are hard to measure with the same yardstick as a conventional hotel. Where lining up RevPAR alone splits opinion, factoring in the low variable-cost ratio and the resilience of occupancy to the downside changes the assessment. In designing management-contract terms as well, a structure that rewards operating efficiency including the cleaning-frequency design fits the format better than a fee built solely on occupancy.
What to Examine When Considering Adoption or Conversion
Drawing on the measurements and the framing above, here are the points worth settling at the business-plan stage when considering adoption of, or conversion to, an extended-stay model. None is a verdict on what is better; each is an item to be answered against your own property’s conditions.
| Point | What to check | Guide to the judgement |
|---|---|---|
| Demand source | Which of these exist in the catchment: long assignments, construction, training, medical accompaniment, larger inbound parties, relocation scouting. Which segments your existing consecutive-night business comes from | Whether a mix that does not depend on a single demand source can be secured |
| Room specification | Presence of an in-room washing machine or laundry, storage, work space and a compact kitchen. Which of these moves the price most as stays lengthen | Payback period on the renovation spend against the uplift in rate |
| Cleaning operation | Frequency, scope and linen-change cycle for mid-stay cleaning. Whether the cleaning contract is occupancy-linked or fixed by room count | How far cleaning cost per room-night can fall |
| Price design | A stepped design by minimum nights. What the effective price gap within the same room type works out to | Whether it stays inside the break-even discount (22.2% in this article’s calculation) |
| Sales channel | How public sale up to 7 nights connects to the quote and corporate-contract path beyond it. Who owns corporate sales | Lower commission set against the cost of that sales effort |
| Inventory allocation | The cap on rooms allocated to extended stay. Whether allocation rules protect high-rate demand in peak periods | Committed periods weighed against the opportunity cost of peak-period rates |
| Legal and accounting | Whether the operating form stays within the hotel business framework, the tax treatment of long stays, and the drafting of contract terms | Advance confirmation with the relevant local authority and specialists |
Source: MetroEngines Research; compiled by the HotelBank Editorial Team
A realistic sequence is to carve out part of the existing rooms — say 10-20% of the total — for extended stay and begin with a public ladder running up to 7 nights. At that scale, changes to cleaning frequency and the price design can be tested without seriously disturbing the existing sales structure. A property that already offers consecutive-night plans already has the entrance to extended stay; extending the minimum-night ladder by a single step is enough to test the relationship between occupancy and variable cost against real data.
Conclusion
Four things were established here. First, measured within the same property and the same room type, the nightly rate falls in steps as the consecutive-night condition lengthens, reaching 14.8% below standard plans at 7 nights or more (N=93 properties). Second, the advertised discount (median 20% at 7 nights or more) does not match the effective price gap, so pricing has to be verified within your own property’s same room type. Third, the ceiling on minimum nights in public sale stops at 7-9 nights, and the 30-night band has moved to other transaction forms — corporate contracts, direct sales, monthly-rental businesses. Fourth, whether the economics hold with a lower rate is decided by the lift in occupancy and the cleaning-frequency design; on the assumptions used here, a discount of up to 22.2% falls inside the profit-neutral range.
Extended stay is not a discount product sitting on the end of conventional operations; it is a business design that replaces the revenue drivers. That is why, in practice, the decision to adopt it should start not from the rate card but from checking the cleaning operation and the demand sources. The 3,133 properties already offering consecutive-night plans are in a position to begin that verification with their own data at any time.
Related Reading
- Long-Stay Hotels Take Off in Tokyo: Mitsubishi Estate WAYPOINT and Hilton Enter the Market
- Hotel Subscription Market Tipping Point 2026 — goodroom, unito, HafH Disrupt Settled-Living Hotel Demand
- Only Hotels That Capture Demand Survive: 2026’s Occupancy Ceiling
- Monthly Hotels in Japan: No Lease, 20% Off at 30 Nights
- Japan Hotel Long-Stay Discounts: 15% at 7 Nights, 20% at 30 Nights
- Weekly Apartment vs Hotel in Tokyo: Break-Even at About 4 Nights
- Ryokan Long Stays in Japan: Toji Plans, Costs and How They Differ From Hotels
References and Sources
Market data
- MetroEngines Research — listing data on plans with consecutive-night conditions (listings confirmed on or after 15 August 2026; 3,133 properties, 32,797 plans); listed-price comparison within the same property and room type (October 2025 check-in, 1,429 properties); distribution by prefecture and format; estimated settled ADR by area
Legislation and government material
- Ministry of Health, Labour and Welfare, Questions on the Application of the Hotel Business Act (No. 23, 29 January 1988)
- Ministry of Health, Labour and Welfare, Hotel Business Operated in Apartment-Type Facilities (No. 209006, 9 February 2005)
- Japan Tourism Agency, Overnight Travel Statistics Survey
Company announcements and industry material
- Mitsubishi Estate and Mitsubishi Estate Hotels & Resorts, Launching a Brand for Extended-Stay Needs and Entering the Apartment Hotel Business (2 February 2026)
- Market rates for outsourced hotel cleaning (guideline unit prices for room cleaning)
- Optimising cleaning operations at extended-stay hotels: frequency, staffing and vendor selection
Source: Hilton, Company Overview (updated 25 August 2026)