

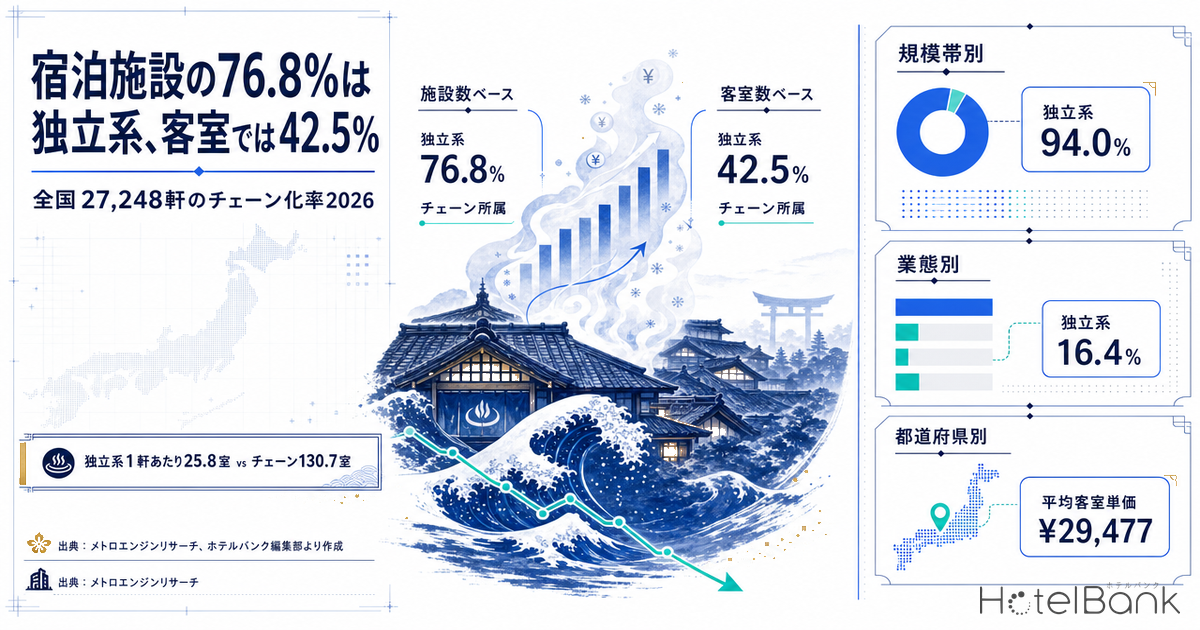
When a hotel operator weighs a succession deal or a management contract, the first thing needed is a sense of the denominator: how many properties nationwide could actually be in scope. Across the universe MetroEngines Research tracks, we sorted the 27,248 operating properties (1,266,645 rooms) in Japan by whether they belong to a chain. On a property count basis, 76.8% (20,920 properties) are independent. On a room count basis, however, independents account for only 42.5% (538,387 rooms) — the majority and the minority swap places.
This article breaks down that “the picture changes depending on whether you count properties or rooms” structure by size band, property type, all 47 prefectures, and municipality. The aim is to show, in numbers, where the acquirable pool sits for buyers and management-contract operators — in which locations, at what scale, and in which price band.
- — 76.8% of properties, 42.5% of rooms — Of the 27,248 operating properties and 1,266,645 rooms nationwide, 20,920 are independent, but on rooms independents fall to 538,387 and become the minority.
- — 25.8 rooms vs. 130.7 rooms per property — The gap in average size between independents and chain-affiliated properties explains exactly why the majority flips between the property count and the room count.
- — 94.0% at 1–9 rooms, 16.4% at 200+ rooms — The independent share falls monotonically as size increases, with the 50–99 room band (58.5%) acting as the tipping point.
- — Ryokan 90.0%, guesthouses 91.5% — The core of independent stock is Japanese-style and small-scale. Business hotels are 49.5% independent by property but drop to 29.0% by rooms.
- — 37 of 47 prefectures above 70% — Independents form the majority almost everywhere in Japan. At the municipal level, areas that are over 90% independent still range from ¥10,675 to ¥29,477 in estimated transacted ADR.
Metric Definitions Used in This Article
- Chain-affiliated: A property linked, in the lodging property master, to an operating group that bundles multiple properties (not only national brands, but also operators running several properties within a single region).
- Independent: A property not linked to any operating group in the same master.
- Unclassified: Properties that carry a group link but whose group entity cannot be confirmed, plus properties whose name suggests affiliation with a specific brand but for which no group is confirmed in the master. These are not counted as independent.
- ADR (average daily rate): An estimated transacted rate (tax-exclusive equivalent) calculated by applying a property-type correction factor to the lowest published plan level each property lists on OTAs and similar channels (two guests per room, per-room price, tax-included). Cross-checked against property-level results disclosed by listed hotel REITs, the median error is 6.6% (verified across business, city, resort, ryokan and capsule types). These are estimates and differ from each property’s actual transacted prices or accounting figures. Area-level ADR is the median across the properties in scope (the level of a typical property in that area).
- Data source: MetroEngines Research
76.8% by properties, 42.5% by rooms — the two faces of independent stock
The scope is the 27,248 properties (1,266,645 rooms) that can be confirmed as operating on OTAs, out of roughly 168,000 domestic properties tracked by MetroEngines Research. The split came out at 5,281 chain-affiliated properties (19.4%) with 690,125 rooms (54.5%), 20,920 independents (76.8%) with 538,387 rooms (42.5%), and 1,047 unclassified (3.8%) with 38,133 rooms (3.0%).
Counted by properties, Japan’s lodging stock is still overwhelmingly independent. Counted by rooms, chains hold the majority. In other words it is a two-layer structure: independents own the property count, chains own the room count. In terms of deal flow for succession and management contracts, independents are the center of the pool; in terms of room volume that can be put to work, the depth sits on the chain side.
Source: MetroEngines Research; compiled by the HotelBank Editorial Team
What produces this reversal is the difference in size per property. Averaged across properties with a registered room count, independents run 25.8 rooms (N=20,839) and chain-affiliated properties 130.7 rooms (N=5,280) — a gap of more than five times per property.
The larger the property, the higher the chain share — 82.6% at 200+ rooms
Sliced by room-count band, the independent share traces a clean downward curve. In the 1–9 room band, 94.0% (8,515 of 9,055) are independent, while at 200 rooms and above the share falls to 16.4% (207 of 1,261) and the chain share reaches 82.6%. The tipping point is the 50–99 room band, where independents (58.5%) and chains (37.3%) are close, and above 100 rooms the ratio inverts. How much stock above this band — properties over 500 rooms — exists nationwide is catalogued inJapan’s Largest Hotel: Shinagawa Prince, 2,384 Rooms — Top 30 Ranking.
Source: MetroEngines Research; compiled by the HotelBank Editorial Team
| Room-count band | Properties | Independent | Independent share | Chain | Chain share | Unclassified |
|---|---|---|---|---|---|---|
| 1–9 rooms | 9,055 | 8,515 | 94.0% | 245 | 2.7% | 295 |
| 10–29 rooms | 8,424 | 7,401 | 87.9% | 633 | 7.5% | 390 |
| 30–49 rooms | 2,715 | 2,105 | 77.5% | 477 | 17.6% | 133 |
| 50–99 rooms | 3,033 | 1,773 | 58.5% | 1,132 | 37.3% | 128 |
| 100–199 rooms | 2,673 | 838 | 31.4% | 1,751 | 65.5% | 84 |
| 200+ rooms | 1,261 | 207 | 16.4% | 1,042 | 82.6% | 12 |
Source: MetroEngines Research; compiled by the HotelBank Editorial Team
This shape is consistent with how management contracts and brand supply work in practice. Standardized operations pay off most in the mid-to-large size range, and group operation has already penetrated that band. Read the other way, the roughly 20,000 properties below 50 rooms are the pool with the most headroom for operating capability, brand and distribution channels to be brought in.
It is also worth noting that the “chain” side is far from homogeneous. There are 521 operating groups holding at least one operating property, but 152 of them run only a single property, and the median group runs just three. The top 20 groups account for 2,072 properties (39.2% of chain-affiliated properties); the rest is an aggregation of small groups. Grouping at the scale of a few properties is already a widely used, practical option.
By property type — ryokan and guesthouses are 90% independent, limited-service is roughly half and half
By property type, the highest independent share is in guesthouses and simple lodgings at 91.5% (8,695 properties), followed by ryokan at 90.0% (6,978 properties). Both stay high on a room basis as well, at 86.8% and 79.9%. Ryokan also carry substantial room volume — 7,753 properties and 179,897 rooms — making them the core of independent stock.
By contrast, business hotels are 49.5% independent on a property basis, close to an even split, but fall to 29.0% on a room basis. City hotels show the same shape, at 46.9% of properties and 29.6% of rooms. Deluxe hotels sit at 21.8% and 13.6%, making them the type where group operation has spread furthest.
Source: MetroEngines Research; compiled by the HotelBank Editorial Team
| Property type | Properties | Rooms | Independent Properties | Independent share (properties) | Independent share (rooms) | Chain Properties | Chain share (properties) | Unclassified |
|---|---|---|---|---|---|---|---|---|
| Guesthouses and simple lodgings | 9,503 | 86,984 | 8,695 | 91.5% | 86.8% | 414 | 4.4% | 394 |
| Ryokan | 7,753 | 179,897 | 6,978 | 90.0% | 79.9% | 558 | 7.2% | 217 |
| Business hotels | 6,387 | 643,452 | 3,161 | 49.5% | 29.0% | 2,942 | 46.1% | 284 |
| Resort hotels | 1,224 | 94,300 | 805 | 65.8% | 43.2% | 381 | 31.1% | 38 |
| City hotels | 1,102 | 176,355 | 517 | 46.9% | 29.6% | 557 | 50.5% | 28 |
| Adults-only | 661 | 17,841 | 369 | 55.8% | 52.6% | 238 | 36.0% | 54 |
| Company and organization lodgings | 257 | 7,706 | 190 | 73.9% | 64.0% | 51 | 19.8% | 16 |
| Capsule hotels | 237 | 30,453 | 169 | 71.3% | 68.8% | 58 | 24.5% | 10 |
| Deluxe hotels | 110 | 29,092 | 24 | 21.8% | 13.6% | 82 | 74.5% | 4 |
Source: MetroEngines Research; compiled by the HotelBank Editorial Team
Put differently, the deal count for succession and turnaround work comes out of ryokan and guesthouses, while anyone seeking room volume per deal should look at independent business hotels and resort hotels (3,161 and 805 properties respectively). Resort hotels, at 65.8% of properties and 43.2% of rooms, are one of the few types where independents of meaningful scale remain in a cluster. Ryokan rebranding deals, in which an acquirer takes on an independent property and repositions it, are one of the routes by which this stock changes hands and its rate level moves.
The 47 prefectures — Nagano leads at 89.2%, and 37 prefectures exceed 70% by properties
By prefecture, the independent share on a property basis is highest in Nagano at 89.2% (of 1,891 properties), followed by Tokushima at 88.1%, Niigata at 87.5%, Yamanashi at 87.4%, Okinawa at 87.0% and Kochi at 87.0%. Thirty-seven of the 47 prefectures exceed 70%, so the pattern of independents forming the majority holds almost everywhere in Japan.
At the other end, Tokyo sits at 54.0%, Miyagi at 54.2%, Fukuoka at 57.6% and Aichi at 60.0% — relatively low in the major metropolitan areas. On a room basis the gap widens further, with Tokyo at 25.1%, Saitama at 23.1% and Miyagi at 26.1%, all in the low-to-mid 20s. In urban areas, large business- and city-hotel stock dominates supply, so the difference in property-type mix shows through directly.
Saitama came out lowest nationwide at 31.7% independent, but it also has the highest unclassified share, at 91 of its 252 properties (36.1%). With only 252 properties in total, it is easily affected by properties whose classification was withheld. Saitama’s ratio should be read with a margin.
Source: MetroEngines Research; compiled by the HotelBank Editorial Team
| # | Prefecture | Properties | Rooms | Independent share (properties) | Independent share (rooms) | Chain share (properties) | Unclassified (properties) |
|---|---|---|---|---|---|---|---|
| 1 | Nagano | 1,891 | 45,283 | 89.2% | 65.9% | 8.7% | 40 |
| 2 | Tokushima | 194 | 6,406 | 88.1% | 60.4% | 11.3% | 1 |
| 3 | Niigata | 753 | 28,039 | 87.5% | 57.2% | 10.6% | 14 |
| 4 | Yamanashi | 722 | 16,911 | 87.4% | 65.3% | 10.8% | 13 |
| 5 | Okinawa | 1,474 | 42,577 | 87.0% | 44.5% | 12.6% | 6 |
| 6 | Kochi | 184 | 7,639 | 87.0% | 70.3% | 11.4% | 3 |
| 7 | Oita | 580 | 17,768 | 86.7% | 56.1% | 12.2% | 6 |
| 8 | Fukui | 312 | 9,096 | 85.9% | 55.6% | 11.5% | 8 |
| 9 | Nara | 253 | 6,675 | 85.4% | 51.7% | 13.4% | 3 |
| 10 | Iwate | 354 | 16,320 | 85.0% | 58.5% | 14.4% | 2 |
| 11 | Tottori | 208 | 7,893 | 84.6% | 56.8% | 13.9% | 3 |
| 12 | Saga | 175 | 6,926 | 84.6% | 56.3% | 12.6% | 5 |
| 13 | Yamagata | 389 | 13,906 | 84.3% | 61.3% | 15.2% | 2 |
| 14 | Wakayama | 396 | 11,416 | 84.1% | 58.7% | 14.4% | 6 |
| 15 | Kyoto | 2,112 | 43,967 | 83.1% | 44.8% | 14.0% | 61 |
| 16 | Shimane | 209 | 8,330 | 82.8% | 49.5% | 17.2% | 0 |
| 17 | Fukushima | 604 | 24,673 | 82.6% | 52.1% | 14.6% | 17 |
| 18 | Gunma | 676 | 20,514 | 82.2% | 57.5% | 10.8% | 47 |
| 19 | Kumamoto | 476 | 18,377 | 82.1% | 44.3% | 15.8% | 10 |
| 20 | Akita | 238 | 10,839 | 81.5% | 50.0% | 17.6% | 2 |
| 21 | Kagawa | 242 | 10,870 | 81.4% | 58.2% | 16.9% | 4 |
| 22 | Kagoshima | 532 | 20,514 | 81.2% | 51.5% | 14.7% | 22 |
| 23 | Shizuoka | 1,437 | 47,250 | 80.9% | 49.3% | 17.5% | 23 |
| 24 | Tochigi | 572 | 20,406 | 80.9% | 51.9% | 16.6% | 14 |
| 25 | Hyogo | 827 | 35,607 | 80.0% | 47.9% | 19.2% | 6 |
| 26 | Gifu | 571 | 17,408 | 78.6% | 49.3% | 16.3% | 29 |
| 27 | Mie | 488 | 19,712 | 77.5% | 48.7% | 18.4% | 20 |
| 28 | Miyazaki | 215 | 11,703 | 77.2% | 47.5% | 21.4% | 3 |
| 29 | Ishikawa | 414 | 18,641 | 77.1% | 37.0% | 20.3% | 11 |
| 30 | Nagasaki | 382 | 17,445 | 75.9% | 45.2% | 20.9% | 12 |
| 31 | Shiga | 228 | 10,228 | 75.0% | 42.5% | 23.2% | 4 |
| 32 | Yamaguchi | 222 | 12,764 | 74.8% | 49.6% | 22.1% | 7 |
| 33 | Chiba | 634 | 44,241 | 73.7% | 40.8% | 20.5% | 37 |
| 34 | Ibaraki | 315 | 16,041 | 73.7% | 50.2% | 24.8% | 5 |
| 35 | Ehime | 267 | 13,223 | 73.4% | 45.6% | 21.0% | 15 |
| 36 | Toyama | 253 | 11,884 | 73.1% | 35.8% | 20.6% | 16 |
| 37 | Aomori | 240 | 14,426 | 72.5% | 44.8% | 26.2% | 3 |
| 38 | Okayama | 277 | 14,951 | 69.7% | 40.8% | 21.7% | 24 |
| 39 | Osaka | 1,006 | 93,041 | 68.6% | 37.1% | 29.1% | 23 |
| 40 | Hiroshima | 411 | 25,385 | 67.6% | 39.9% | 21.7% | 44 |
| 41 | Kanagawa | 760 | 42,982 | 65.9% | 30.9% | 32.4% | 13 |
| 42 | Hokkaido | 1,432 | 82,855 | 64.4% | 38.6% | 21.1% | 208 |
| 43 | Aichi | 617 | 49,122 | 60.0% | 33.4% | 34.5% | 34 |
| 44 | Fukuoka | 559 | 49,133 | 57.6% | 33.4% | 37.6% | 27 |
| 45 | Miyagi | 389 | 27,547 | 54.2% | 26.1% | 24.9% | 81 |
| 46 | Tokyo | 1,506 | 160,298 | 54.0% | 25.1% | 44.6% | 22 |
| 47 | Saitama | 252 | 15,413 | 31.7% | 23.1% | 32.1% | 91 |
Source: MetroEngines Research; compiled by the HotelBank Editorial Team
Rate bands in hot spring and tourist areas where independents exceed 90%
Drop down to the municipal level (228 municipalities with 30 or more properties) and the independent share stands out even more sharply. Kami in Hyogo is at 99.0%, Katashina in Gunma at 98.9%, Nozawaonsen in Nagano at 97.4%, Kyotango in Kyoto at 97.3%, Shimoda in Shizuoka at 96.2%, Hakuba in Nagano at 95.9%, Minamioguni in Kumamoto at 95.8% and Yufu in Oita at 95.7% — a list of hot spring towns, mountain resorts and seaside tourist areas.
Overlay the estimated transacted ADR for these areas over the past 12 months (August 2025 to July 2026) and the rate bands turn out to differ widely. Minamioguni in Kumamoto (which includes Kurokawa Onsen) is around ¥29,500, Kami in Hyogo around ¥28,800 and Kyotango in Kyoto around ¥27,800 — close to ¥30,000 while being more than 90% independent. At the other end, Katashina in Gunma is around ¥10,700, Miyakojima in Okinawa around ¥12,900 and Nozawaonsen in Nagano around ¥13,200, in the low ¥10,000s.
So “more independents” does not mean “lower rates.” Independent clusters that already command high rates and clusters where there is still headroom in rate relative to room volume coexist within the same 90%-independent bracket. In deciding where to target a management contract or a brand rollout, the independent share and the rate band have to be read together, on two axes.
| Prefecture | Municipality | Properties | Rooms | Independent share (properties) | Independent share (rooms) | Estimated transacted ADR (12-month average) | Properties in ADR aggregation (median) |
|---|---|---|---|---|---|---|---|
| Hyogo | Kami | 102 | 978 | 99.0% | 99.0% | ¥28,827 | 46 |
| Gunma | Katashina | 87 | 1,242 | 98.9% | 99.5% | ¥10,675 | 25 |
| Nagano | Nozawaonsen | 114 | 1,349 | 97.4% | 95.6% | ¥13,190 | 23 |
| Kyoto | Kyotango | 111 | 1,658 | 97.3% | 90.5% | ¥27,782 | 80 |
| Shizuoka | Shimoda | 133 | 2,009 | 96.2% | 79.4% | ¥15,102 | 50 |
| Nagano | Hakuba | 319 | 4,287 | 95.9% | 91.4% | ¥14,386 | 42 |
| Kumamoto | Minamioguni | 48 | 649 | 95.8% | 96.5% | ¥29,477 | 44 |
| Oita | Yufu | 184 | 1,910 | 95.7% | 93.1% | ¥23,820 | 136 |
| Okinawa | Miyakojima | 194 | 3,161 | 94.8% | 60.3% | ¥12,861 | 72 |
| Gifu | Takayama | 216 | 5,233 | 84.3% | 58.4% | ¥17,121 | 133 |
| Tochigi | Nikko | 174 | 5,450 | 82.2% | 66.5% | ¥18,135 | 117 |
| Shizuoka | Atami | 135 | 4,839 | 69.6% | 47.3% | ¥24,628 | 101 |
| Hokkaido | Kutchan | 119 | 1,853 | 27.7% | 28.8% | ¥27,458 | 21 |
Source: MetroEngines Research; compiled by the HotelBank Editorial Team (estimated transacted ADR is the average of monthly medians from August 2025 to July 2026; months in which the number of aggregated properties fell below 60% of the period median are excluded)
For reference, Kutchan in Hokkaido — among the lowest independent shares — is at 27.7% by properties and 28.8% by rooms, with an estimated transacted ADR of about ¥27,500. Within the same high-rate band, the ownership composition of the stock is completely different from Minamioguni or Kami.
The receiving side is already moving — management contracts and rebrands in 2026
Recently disclosed deals confirm that independent stock is functioning in practice as an acquirable pool. What happens when no receiving party is found is tracked inJapan Hotel Closures 2026: 3 Hotels, 316 Rooms Closed, 1,149 Delayed.
On 10 March 2026, Take and Give Needs announced that it had been selected as the new operating partner for a hotel in Koshigoe, Kamakura, Kanagawa (total floor area 914.58 sqm, 16 rooms) held by the First Brothers group, and had signed a management contract agreement. The company positions it as the first property of a new hotel brand, with operations scheduled to begin around January 2027. A 16-room property falls exactly into the bands this article measured at 94.0% independent (1–9 rooms) and 87.9% independent (10–29 rooms).
For Lime Resort Myoko in Myoko, Niigata, a plan to renovate and reopen the property under Accor’s boutique brand MGallery Collection was reported in October 2025 (Niigata Nippo; opening scheduled for the end of 2027). It is a case of an international brand being placed on top of an existing independent-brand property.
On the acquisition side, Tosei disclosed on 30 June 2026 that it had acquired two hotels in station-adjacent locations in Kanda and Asakusa. It is one example of mid-sized urban stock moving as an investment target.
To frame the scale of the pool, it helps to place listed hotel REIT holdings alongside it. The seven domestic hotel-focused investment corporations (Hoshino Resorts REIT, Ichigo Hotel REIT, Japan Hotel & Residential Investment Corporation, Japan Hotel REIT, Mori Trust REIT, Invincible Investment Corporation and Kasumigaseki Hotel REIT) hold 302 properties in total — 1.1% of the 27,248 properties in this article’s scope. Only a small share of stock is held directly by listed REITs; the roughly 20,000 independents outside that perimeter are the main arena for deploying operating capability, brand and capital.
Methodology and sources
The aggregation covers the 27,248 properties registered as operating (excluding temporarily closed and permanently closed properties) in the lodging property master held by MetroEngines Research. Chain affiliation is determined from the operating-group links in that master (521 groups hold at least one operating property). Among properties with no group link, those whose name contains the brand notation of a known group were placed in a third category, “unclassified,” and not counted as independent. Properties that carry a group link but whose group entity cannot be confirmed were classified the same way. The result is 1,047 unclassified properties (3.8% of the total).
“Chain” in this article is a broad definition: not only nationally deployed brands, but also operators running several properties within a single region. In fact, the median group among the 521 with operating properties runs three properties, and most are small. “Independent” here is therefore closer in meaning to “single-property operation” and says nothing about brand recognition.
Municipal estimated transacted ADR was calculated for municipalities with 30 or more properties as the simple average of monthly medians from August 2025 to July 2026. Months in which the number of aggregated properties fell below 60% of the period median are excluded. Room counts are the values registered in the master; the 87 properties with no registration (0 rooms) were excluded from the size-band aggregation.
Summary
Of 27,248 properties and 1,266,645 rooms nationwide, 76.8% are independent by property count and 42.5% by room count — a confirmed two-layer structure. By size band the independent share runs from 94.0% at 1–9 rooms to 16.4% at 200 rooms and above, so group operation deepens as size increases. By type, ryokan (90.0%) and guesthouses (91.5%) form the core of independent stock, while business and city hotels are roughly half and half by property and just under 30% by rooms.
By prefecture, 37 of the 47 exceed 70% on a property basis, so independents forming the majority is close to a nationwide constant. At the municipal level, areas above 90% independent span rates from ¥10,700 to ¥29,500, so the share alone cannot explain the rate band. Anyone looking at independent stock as a pool for succession or management contracts should start by reading the independent share and the estimated transacted ADR together.
Related reading
- Japan Hotel Closures 2026: 3 Hotels, 316 Rooms Closed, 1,149 Delayed
- 226k Hotel Rooms in 32 Regional Cities: 42.7% Built Before 1996
- Who Owns the Hot Spring? Water Rights and Ryokan Valuation
- Japan’s Largest Hotel: Shinagawa Prince, 2,384 Rooms — Top 30 Ranking
- Japan’s Pre-1981 Hotel Stock: 236k Rooms, 19.1% — Retrofit or Rebuild
- Regional Bank-Led Small-Scale Continuous Hotel Funds — Capital Supply vs. Large REIT Acquisitions
References and sources
- ■ Data sources
Based on the MetroEngines Research lodging property master (27,248 operating properties, 1,266,645 rooms, 521 linked operating groups), the same firm’s monthly area aggregation (municipal estimated transacted ADR, August 2025 to July 2026), and an ownership master built from the disclosures of seven listed hotel REITs (302 properties). Individual deals are based on disclosures by Take and Give Needs and Tosei and on reporting by Niigata Nippo. - ■ Calculation assumptions
Independent = a property with no confirmable link to an operating group. Properties whose group entity cannot be confirmed, and properties whose name suggests affiliation with a specific brand, are treated as “unclassified” (1,047 properties, 3.8%) and not counted as independent. The size-band aggregation covers the 27,161 properties with a registered room count, excluding 87 unregistered properties. The property-type aggregation covers the 27,234 properties and 1,266,080 rooms with an identifiable type. Municipal estimated transacted ADR covers the 228 municipalities with 30 or more properties, taking the simple average of monthly medians and excluding months in which the number of aggregated properties fell below 60% of the period median. - ■ Limitations and caveats
“Chain” in this article is a broad definition including operators running several properties within a single region, not only nationally deployed brands, and the median group among the 521 runs three properties. The independent share therefore does not indicate the presence or absence of brand recognition. In areas with a high unclassified share (Saitama: 91 of 252 properties, 36.1%), the independent share should be read with a margin. Estimated transacted ADR is an estimate and differs from each property’s actual transacted prices or accounting figures. The scope is limited to properties confirmed as operating on OTAs, and excludes properties not listed on OTAs as well as temporarily and permanently closed properties. - MetroEngines Research — Lodging property master (27,248 operating properties, 1,266,645 rooms), operating-group links, estimated transacted ADR
- Take and Give Needs Inc., “Notice of Conclusion of a Hotel Management Contract Agreement” (10 March 2026)
- Niigata Nippo, “[Myoko resort development] French major’s luxury hotel brand MGallery Collection to open at the end of 2027, also in Nagano — existing hotel to be renovated” (26 October 2025)
- Tosei Corporation timely disclosure, “Hotel business M&A: acquisition of two station-adjacent hotels in Kanda and Asakusa” (30 June 2026, Nikkei Company Information DIGITAL)
- Ownership master built from the disclosures of the listed hotel REITs (Hoshino Resorts REIT, Ichigo Hotel REIT, Japan Hotel & Residential Investment Corporation, Japan Hotel REIT, Mori Trust REIT, Invincible Investment Corporation, Kasumigaseki Hotel REIT), as of 2026, 302 properties