

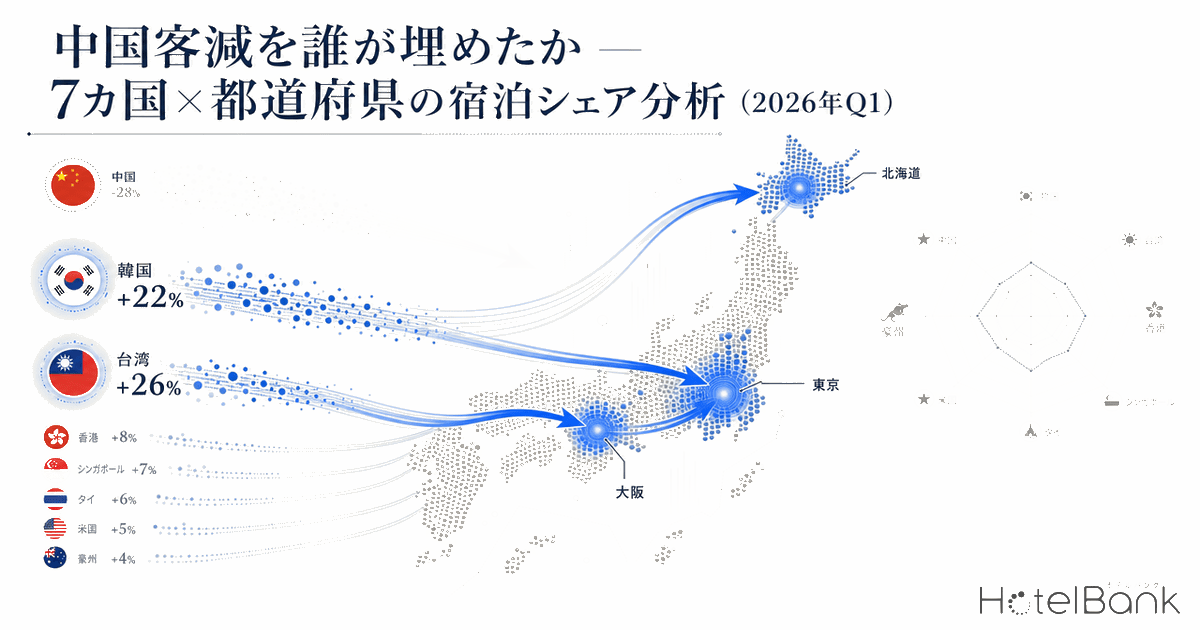
In the first quarter of 2026, Japan’s inbound market exceeded 10 million visitors in the January-March cumulative figures for the second consecutive year. However, the country/region composition has been dramatically rewritten. While visitors from mainland China plunged 54.6% year-on-year, South Korea, Taiwan, and parts of Southeast Asia have filled the gap—a structural shift that is hard to spot in single-month figures alone. This article combines JNTO (Japan National Tourism Organization) inbound visitor statistics for January-March 2026 with the Japan Tourism Agency’s “Accommodation Travel Statistics Survey” data (January 2026 Second Preliminary, February First Preliminary) by nationality and prefecture, quantifying “where and how much each of the top 7 inbound countries are staying” in the regions of Japan.
Metric Definitions Used in This Article
- Total Guest Nights: Person-nights of foreign guests staying at facilities with 20 or more rooms in the Japan Tourism Agency’s “Accommodation Travel Statistics Survey” (one person staying two nights counts as two person-nights). Uses Second Preliminary (January) and First Preliminary (February) data.
- Inbound Visitor Count: Number of inbound visitors at the time of entry, compiled and estimated by JNTO based on the Ministry of Justice’s Immigration Control Statistics. Differs in concept and methodology from total guest nights.
- Top-3 Prefecture Share: The proportion of total guest nights of the country/region accounted for by the top 3 prefectures. The higher the value, the stronger the concentration in specific regions.
- Gini Coefficient: An indicator showing the inequality of guest night distribution across 47 prefectures on a scale of 0-1. 0 = perfectly even distribution, 1 = complete concentration in one prefecture. This article calculates it based on absolute total guest night values.
- Data Sources: JNTO “Inbound Visitor Statistics” (March 2026 estimates), Japan Tourism Agency “Accommodation Travel Statistics Survey” (January 2026 Second Preliminary, February 2026 First Preliminary), MetroEngines Research.
Structural Inbound Shift in Q1 2026
JNTO’s published cumulative inbound visitor count for January-March 2026 was 10,683,500 (+1.4% year-on-year). While the total figure shows only marginal growth, the breakdown by country/region has shifted dramatically. Mainland China posted a net decrease of approximately 1.29 million visitors (down 54.6% YoY), while South Korea recorded a net increase of about 550,000 (+22.0%) and Taiwan added approximately 420,000 visitors (+25.7%). The U.S. also added about 90,000 (+12.1%), and three Southeast Asian countries combined (Thailand, Malaysia, Vietnam) contributed +60,000—multiple countries and regions are filling the “China gap.”
However, inbound visitor counts (entries) and domestic accommodation behavior (total guest nights) are different concepts. Even if 1 million people visit Japan, the regional economic impact differs greatly depending on whether they stay only 2 nights in Tokyo or 4 nights in Hokkaido. Using the Japan Tourism Agency’s accommodation statistics by nationality and prefecture, we can quantitatively grasp “in which regions each country’s accommodation behavior is concentrated.”
▶ Related: The China -60% Shock — Q1 2026 Tectonic Shift in Inbound Visitors and Lodging Markets by Nationality
Source: Compiled by HotelBank Editorial Team from JNTO “Inbound Visitor Statistics” (March 2026 estimates)
Measuring Prefectural Distribution of 7 Countries
From the January-February 2026 (Second Preliminary and First Preliminary) total guest nights by nationality and prefecture, we calculated the geographical distribution of the top 7 inbound countries using three indicators: (1) Tokyo’s share (Tokyo concentration), (2) Top-3 prefecture share (major-city concentration), and (3) Gini coefficient × 100 (overall inequality across 47 prefectures). In all three, higher values indicate stronger “concentration in specific regions.”
| Country/Region | Total Guest Nights (Person-nights, Jan-Feb) |
Tokyo Share | Top-3 Prefecture Share | Gini Coefficient |
|---|---|---|---|---|
| Taiwan | 4,287,520 | 18.7% | 44.8% | 0.707 |
| South Korea | 4,106,640 | 20.9% | 54.7% | 0.789 |
| China | 2,979,080 | 32.6% | 65.8% | 0.804 |
| USA | 1,986,280 | 49.6% | 69.7% | 0.864 |
| Thailand | 757,460 | 28.5% | 62.8% | 0.803 |
| Malaysia | 435,020 | 29.7% | 69.5% | 0.839 |
| Vietnam | 125,740 | 27.8% | 58.0% | 0.807 |
Source: Compiled by HotelBank Editorial Team from Japan Tourism Agency “Accommodation Travel Statistics Survey” (January 2026 Second Preliminary, February First Preliminary)
The highest urban concentration is seen with the USA (Tokyo share 49.6%, Gini coefficient 0.864). Almost half of American visitors’ lodging is concentrated in Tokyo, and the top 3 prefectures (Tokyo, Osaka, Kyoto) account for about 70%. The data confirms that the main travel route for U.S. visitors is heavily skewed toward the “Golden Route” (Tokyo-Kyoto-Osaka).
Conversely, the most regionally dispersed is Taiwan (Tokyo share 18.7%, Top-3 prefecture share 44.8%, Gini coefficient 0.707). Taiwanese visitors’ lodging is broadly distributed across major regional tourist destinations: Tokyo, Hokkaido, Osaka, Okinawa, and Kyoto. This is backed by the many direct flights from Taiwan that serve regional airports (Aomori, Kumamoto, Hakodate, New Chitose, Naha, etc.) and the high repeater ratio.
South Korea also shows relative dispersion with a Gini coefficient of 0.789 (Tokyo 20.9%, Top-3 54.7%). What stands out about Korea is that the Kyushu/Okinawa share is 27.3%—the highest of all 7 countries—with Fukuoka Prefecture alone accounting for 12.5%. The thick LCC network connecting Busan and Incheon to Kyushu’s airports directly translates into Kyushu-centric lodging shares.
Meanwhile, although China saw inbound numbers halved in Q1 2026, its lodging distribution still favors major urban centers: Tokyo 32.6% and Hokkaido 19.1%. Malaysia shows a high Hokkaido share at 23.9%, reflecting the movement of travelers seeking halal-friendly facilities and snow experiences.
Source: Compiled by HotelBank Editorial Team from Japan Tourism Agency “Accommodation Travel Statistics Survey” (January 2026 Second Preliminary, February First Preliminary)
Who Filled the “-3.3M Person-Night” China Gap?
Comparing January-February 2026 total guest nights with the same period last year, accommodations from mainland China posted a net decrease of -3.33 million person-nights (-52.6% YoY). The direct cause was the Chinese government’s renewed call to refrain from travel to Japan during the 2026 Lunar New Year period. Air China suspended all Beijing-Narita flights from January 26 to March 28, and partially canceled Beijing-Haneda flights, resulting in a substantial contraction of flight capacity itself.
So who filled the gap? Net increases from other countries during the same period were as follows:
YoY Net Change in Total Guest Nights by Country, Jan-Feb 2026 (person-nights):
China: -3,336,390 / South Korea: +544,500 / Taiwan: +769,690 / USA: +143,840 / Vietnam: +44,990 / Thailand: -3,370 / Malaysia: -13,230
*Foreign guest total YoY net decrease: -1.15 million person-nights. The drop in China cannot be filled by gains from other countries alone, resulting in an overall decrease.
Although this cannot be directly compared in monetary terms, the combined net increase of Taiwan +770,000, South Korea +540,000, USA +140,000 = +1.45 million person-nights only fills about 40% of the -3.33 million person-night China gap. The remaining 60% has simply vanished, which is the main reason for the -4.6% in total foreign guest nights.
However, the “distribution” of this offsetting matters. The China decline is concentrated in Tokyo, Hokkaido, Osaka, and Kyoto, with Osaka Prefecture’s Chinese guest nights particularly hard-hit at -910,000 person-nights YoY in Jan-Feb 2026. Looking at where other countries’ net increases concentrated reveals the contours of the structural shift.
| Prefecture | China Net Decrease | Korea Net Increase | Taiwan Net Increase | USA Net Increase | Fill-Back Rate* |
|---|---|---|---|---|---|
| Tokyo | -850,040 | +55,750 | +117,940 | +77,410 | 30% |
| Osaka | -914,410 | +182,980 | +116,010 | +45,820 | 38% |
| Kyoto | -353,820 | -9,920 | +39,260 | +15,450 | 13% |
| Hokkaido | -359,750 | +61,770 | +88,710 | +49,640 | 56% |
| Fukuoka | -45,210 | -11,440 | +62,020 | +1,300 | 115% |
| Okinawa | -38,330 | +43,570 | +116,910 | -58,390 | 266% |
| Aichi | -185,830 | +19,420 | +37,190 | -1,150 | 30% |
*Fill-Back Rate = (Korea + Taiwan + USA combined net increase) / |China net decrease| × 100. Source: Compiled by HotelBank Editorial Team from Japan Tourism Agency “Accommodation Travel Statistics Survey”
In Fukuoka, the China net decrease was relatively small at -45,000 person-nights, while the Taiwan net increase of +62,000 person-nights more than offset it (Fill-Back Rate 140%). In Okinawa, the China decline of -38,000 person-nights was vastly exceeded by Taiwan’s +117,000 and Korea’s +44,000 net increases. By contrast, Kyoto saw only a 15% Fill-Back Rate against China’s -350,000 person-nights, with Taiwan +39,000 and USA +15,000—exposing a structure that had been heavily reliant on Chinese visitors. Osaka‘s Fill-Back Rate of 37% similarly reflects the compounding impact of post-Expo aftermath and the China decline.
In other words, the impact of the China decline is not “uniform across the country.” There is a clear regional divergence: regional cities accessible via tourist routes from Taiwan, South Korea, and Southeast Asia (Fukuoka, Okinawa, Hokkaido) easily fill the gap, while cities that had been extremely dependent on Chinese visitors (Kyoto, Osaka) retain large unfilled gaps.
Source: Compiled by HotelBank Editorial Team from Japan Tourism Agency “Accommodation Travel Statistics Survey” (January 2026 Second Preliminary, February First Preliminary)
Top-5 Lodging Prefectures and Background by Country
The following organizes each country’s top-5 lodging prefectures and shares, along with Q1 2026 flight movements and travel trends.
| Country/Region | #1 | #2 | #3 | #4 | #5 |
|---|---|---|---|---|---|
| China | Tokyo 32.6% |
Hokkaido 19.1% |
Osaka 14.2% |
Kyoto 6.1% |
Fukuoka 3.3% |
| South Korea | Tokyo 20.9% |
Osaka 19.9% |
Hokkaido 13.9% |
Fukuoka 12.5% |
Okinawa 5.8% |
| Taiwan | Tokyo 18.7% |
Hokkaido 14.3% |
Osaka 11.8% |
Okinawa 8.3% |
Kyoto 5.8% |
| USA | Tokyo 49.6% |
Osaka 10.3% |
Kyoto 9.8% |
Hokkaido 9.2% |
Chiba 3.5% |
| Vietnam | Tokyo 27.8% |
Osaka 17.3% |
Hokkaido 12.9% |
Kyoto 7.3% |
Aichi 7.0% |
| Malaysia | Tokyo 29.7% |
Hokkaido 23.9% |
Osaka 15.9% |
Kyoto 6.8% |
Chiba 3.5% |
| Thailand | Tokyo 28.5% |
Hokkaido 18.7% |
Osaka 15.5% |
Chiba 4.9% |
Yamanashi 3.7% |
Top-5 lodging prefectures by country, Jan-Feb 2026, total guest nights (share % of each country’s total). Source: Compiled by HotelBank Editorial Team from Japan Tourism Agency “Accommodation Travel Statistics Survey”
South Korea (first ever 1.1M+ monthly visitors): In January alone, inbound visitors exceeded 1.1 million for the first time. Background includes the new Busan-Shizuoka route launch and increased Incheon-Narita frequency. Lodging is well-balanced across Tokyo 20.9%, Osaka 19.9%, Hokkaido 13.9%, and Fukuoka 12.5%, with prefectures outside the top 3 also accounting for 25%+. The Kyushu/Okinawa share of 27.3% is the highest among all 7 countries—the thick short-haul LCC network translates directly into regional dispersion.
Taiwan (March all-time high, Q1 cumulative +25.7%): New routes and increased frequencies on Taichung-Kumamoto and Taipei Taoyuan-Aomori are expanding regional-airport-based travel. Taiwan’s Gini coefficient of 0.707 is the lowest of the 7 countries—literally a “go everywhere in Japan” demographic. Their share is high in regional tourist destinations such as Okinawa 8.3%, Kyoto 5.8%, and Fukuoka. Taiwan filled the most of the China gap (+770,000 person-nights), with particularly large net increases in Hokkaido, Tokyo, and Osaka.
China (-54.6% due to Lunar New Year travel restraint): Inbound numbers were halved YoY in Q1 2026. The direct cause was Air China’s full suspension of Beijing-Narita and partial cancellation of Beijing-Haneda flights during the Lunar New Year period, substantially reducing flight capacity itself. The largest lodging impact was on Osaka Prefecture (-910,000 person-nights), with Kyoto Prefecture also down -350,000 person-nights. Meanwhile, in Tokyo and Hokkaido, the large net increases from Taiwanese visitors are absorbing the impact relatively well.
USA (Q1 cumulative +12.1%, March monthly all-time high): U.S. lodging is overwhelmingly Tokyo-centric at 49.6%. The top 3 prefectures (Tokyo, Osaka, Kyoto) account for about 70%, with a Gini coefficient of 0.864—the highest of the 7 countries. Driven by school holidays, continued yen weakness, and persistent Japan tourism popularity, growth continues, but the benefit is concentrated in Golden Route cities.
Three Southeast Asian Countries (Thailand, Malaysia, Vietnam): All three posted +8-10% net increases in inbound numbers, but their lodging dispersion patterns differ. Malaysia has a high Hokkaido share at 23.9% (backed by the concentration of halal-friendly facilities in Hokkaido), while Thailand (Hokkaido 18.7%) is also strong on snow/ski demand, and Vietnam has the highest Kansai 2-prefecture share at 24.7%.
2026 New Hotel Openings: Prefecture-Level Concentration
How is the hotel supply side responding to changes in inbound lodging shares by country? MetroEngines Research tracks 485 new hotel openings (and planned openings) in 2026. Looking at the prefectural concentration of mid- to large-room properties, a clear correspondence with the lodging shares of the top 7 inbound countries can be confirmed.
| Prefecture | 2026 New Openings | Main Inbound Segments |
|---|---|---|
| Okinawa | 35 | Resort supply for Taiwan and Korea |
| Tokyo | 33 | USA, affluent Greater China, all directions |
| Kyoto | 32 | USA, Taiwan, China (affluent Greater China) |
| Shizuoka | 31 | South Korea (Busan-Shizuoka route launch) |
| Hokkaido | 27 | Malaysia, Thailand, Taiwan (snow/ski) |
| Yamanashi | 26 | Thailand and Southeast Asia (Mt. Fuji touring) |
| Fukuoka | 23 | South Korea (Busan/Incheon direct flights) |
| Nagano | 21 | Taiwan and Southeast Asia (snow/onsen) |
| Chiba | 17 | USA, all directions (Narita Airport access) |
| Hyogo | 16 | South Korea, Taiwan, broader Kansai |
Coverage by MetroEngines Research (2026 new and planned openings). Includes all categories with 20+ rooms. Source: Compiled by HotelBank Editorial Team from MetroEngines Research
Particularly notable are the supply increases in Shizuoka (31 properties) and Yamanashi (26 properties). The new Busan-Shizuoka route improved Korean visitor access, and the Mt. Fuji touring route is popular with Southeast Asian markets. Okinawa (35 properties) has high lodging shares for both Taiwan and South Korea, consistent with both countries’ Q1 net lodging increases (Okinawa: Taiwan +117,000 person-nights, Korea +44,000 person-nights).
On the other hand, Kyoto (32 properties) and Osaka (14 properties)—cities that had high Chinese tourist concentrations—are continuing supply growth, but Q1 lodging actuals show that other-country gains have not been able to fill the China gap. New supply in these cities is being reorganized toward long-stay luxury for affluent Greater China visitors and U.S.-oriented luxury brands. Hokkaido (27 properties) is also seeing more facilities focused on attracting Muslim and Southeast Asian guests from Malaysia and Thailand, with halal-friendly and gluten-free options becoming key responses to diversifying lodging needs.
▶ Related: Hyatt Centric Sapporo Opening — Reading the Spread of Foreign Brands and ADR Trends in Hokkaido
Conclusion: Time to Redesign Nationality Portfolios
Q1 2026 inbound recorded only a +1.4% increase in total visitor count, but the breakdown shows a significant structural shift: “China halved, all others up across the board.” The key facts derived from this analysis are as follows.
- Mainland China total guest nights for Jan-Feb 2026 were down -3.33 million person-nights (-52.6% YoY). Against this, the combined net increases of South Korea +540,000, Taiwan +770,000, and USA +140,000—total +1.45 million person-nights—filled only about 44% of the China decline.
- The fill-back distribution shows strong regional disparity: Fukuoka and Okinawa absorbed the China decline through Taiwan and Korea net increases that exceeded the loss, while Kyoto and Osaka had low fill-back rates due to over-reliance on China (Kyoto 15%, Osaka 37%).
- The U.S. is highly Tokyo-concentrated (Gini 0.864), Taiwan is nationally dispersed (Gini 0.707), and South Korea is strong in nearby regions with a Kyushu/Okinawa share of 27.3%—each country’s geographic preference is clearly distinct.
- 2026 new hotel openings are concentrated in Okinawa, Tokyo, Kyoto, Shizuoka, and Hokkaido. Regional resort supply for Taiwan, South Korea, and Southeast Asia, alongside premium upscaling of Golden Route cities, is progressing in parallel.
For major tourist cities that had been close to single-country dependence on “inbound = China,” 2026 is the year when the redesign of nationality portfolios becomes a real management challenge. Each facility and region must individually optimize the allocation of investment in product design, distribution channel design, and facility responses (language, food, payment) tailored to the lodging behavior patterns (geographic dispersion, length of stay, budget tier) of Taiwan, South Korea, and Southeast Asian markets respectively.
*Notes on Data: The lodging numbers in this article use Second Preliminary values for January 2026 and First Preliminary values for February from the Japan Tourism Agency’s “Accommodation Travel Statistics Survey.” March data has not been preliminarily published as of this article’s writing, so full Q1 lodging data is estimated by combining JNTO inbound visitor statistics. Second Preliminary values may be revised in subsequent surveys. Mainland China’s travel restraint advisory was reissued on January 26, 2026, but the structure may further change in Q2 2026 onward depending on subsequent lifting trends.
Related Reading
- The China -60% Shock — Q1 2026 Tectonic Shift in Inbound Visitors and Lodging Markets by Nationality
- China’s May Day Holiday (May 1-5) | Will “Labour Day Bookings” Grow Despite -60% Inbound? OTA Price Verification
- May 2026 Inbound Booking Trends: Western and Southeast Asian Visitors Lifting Regional ADR
- Japan Tourism Agency January 2026 Preliminary Deep Dive | Tokyo’s Foreign Guest Ratio Settles Above 50% as Domestic Demand Thins
- Hyatt Centric Sapporo Opening — Reading the Spread of Foreign Brands and ADR Trends in Hokkaido
- Kansai Luxury Hotel Supply-Demand Turning Point — Reading 2026 with DBJ Estimates and OTA Actuals
- Hokkaido in June—Out of Rainy Season: How Will Hotel Prices Move? 6-City ADR Comparison 2026
- Will the Junglia Okinawa Opening Shift the Northern Market to “Year-Round”? Verifying with 6-Area ADR and Sell-Out Rates