

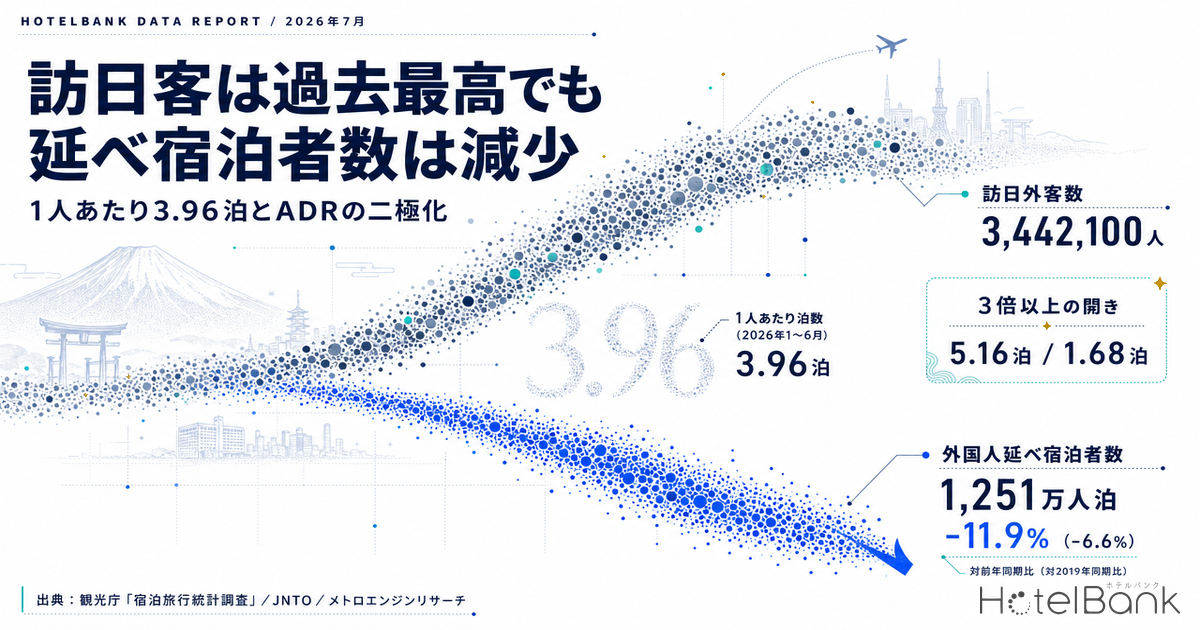
Japan National Tourism Organization (JNTO) reported on August 19, 2026 that inbound arrivals in July 2026 reached 3,442,100 — a record high for the month of July. Meanwhile, the Japan Tourism Agency’s Accommodation Survey for June 2026 (first preliminary figures) put foreign guest nights at 12.51 million, down 11.9% year on year. “Record arrivals, double-digit decline in guest nights” — two seemingly contradictory facts are happening at the same time.
This gap is not a statistical error. Inbound arrivals count the number of people who entered the country; guest nights count the total number of nights stayed. Divide one by the other and you get the average number of nights per visitor. This article decomposes the gap through that division, tests how far the shift in nationality mix explains it, and then cross-checks the result against area-level price reality using MetroEngines Research settled ADR estimates.
Metric Definitions Used in This Article
- ADR (average daily rate): A settled-rate estimate (tax-excluded equivalent) calculated by applying a facility-type correction coefficient to the lowest publicly listed plan rate each property publishes on OTAs and similar channels (double occupancy, per-room rate, tax included). Cross-checked against property-level results disclosed by listed hotel REITs (91 properties, most recent three months), the median error is approximately 7%. These are estimates and differ from each property’s actual transacted rates and accounting figures. Area-level ADR is the median of the properties covered (the level of a typical property in that area).
- OCC (occupancy rate): The share of sold rooms against the total room count in an area (an estimate based on OTA sales inventory). Because the population and definition differ from the room occupancy rate published by the Japan Tourism Agency in its Accommodation Survey, the levels cannot be compared directly.
- Nights per visitor: Foreign guest nights from the Japan Tourism Agency’s Accommodation Survey divided by JNTO inbound arrivals for the same month. It approximates the average total number of nights a visitor spent at accommodation facilities in Japan during their stay.
- Data sources: ADR and OCC are from MetroEngines Research. Arrivals and guest nights are published figures from the Japan Tourism Agency and JNTO.
- — Inbound arrivals of 3,442,100 (July 2026) set a record for the month of July. Yet foreign guest nights in June 2026 came to 12.51 million, down 11.9% year on year — arrivals and guest nights are moving in opposite directions.
- — Length of stay is what connects the two. Dividing same-month figures, nights per visitor fell from 4.24 nights (January–June 2025) to 3.96 nights (same period in 2026), down 6.6%. That works out to roughly 5.87 million guest nights lost in six months for reasons unrelated to the change in visitor numbers.
- — The decline is concentrated in essentially a single market. Guest nights from China in May 2026 fell 53.8%, a decrease of roughly 1.31 million nights — larger than the total decline on the same basis (about 0.92 million nights). Every other market combined added roughly 0.4 million nights.
- — Price reality points the same way. Year-on-year settled ADR estimates for July 2026 show a median of -4.5% across the eight prefectures of the three major metropolitan areas and -2.5% across the 39 regional prefectures, matching the direction of guest nights (-11.5% in the major metros, -3.4% in regional Japan).
- — This is not a uniform nationwide correction, however. Akita +8.9%, Tokushima +8.0% and Okinawa +7.1% (all July 2026, year on year) show that areas outside the big cities are still growing their rates.
Record arrivals and a double-digit drop in guest nights can both be true
Start by laying out what the two statistics actually say. JNTO put inbound arrivals at 3,442,100 in July 2026 (up 0.1% year on year), a record for the month of July. By country and region: South Korea 894,700 (up 31.9%), Taiwan 763,800 (up 26.4%, the first time it has exceeded 700,000 in a single month), China 428,200 (down 56.1%), the United States 286,200 (up 3.3%) and Hong Kong 272,500 (up 54.8%). The January–July cumulative total was 24,527,200, down 1.7% from the same period a year earlier.
On the other side, the most recent release of the Japan Tourism Agency’s Accommodation Survey covers June 2026 (first preliminary figures): total guest nights of 46.78 million (down 6.5% year on year), of which Japanese residents accounted for 34.26 million (down 4.4%) and foreign visitors 12.51 million (down 11.9%), with a room occupancy rate of 56.2%. For the preceding month, May 2026 (second preliminary figures), the totals were 54.29 million guest nights (down 3.2%), Japanese residents 39.78 million (down 0.9%), foreign visitors 14.51 million (down 9.0%), and a room occupancy rate of 61.0%.
| Month | Total | Japanese | Foreign | Room occupancy |
|---|---|---|---|---|
| May 2026 (2nd preliminary) | 54.29M nights | 39.78M nights | 14.51M nights | 61.0% |
| Year on year | -3.2% | -0.9% | -9.0% | -0.7pt |
| June 2026 (1st preliminary) | 46.78M nights | 34.26M nights | 12.51M nights | 56.2% |
| Year on year | -6.5% | -4.4% | -11.9% | -2.6pt |
Source: Japan Tourism Agency, Accommodation Survey (May 2026 second preliminary; June 2026 first preliminary), compiled by the HotelBank Editorial Team
What matters here is the difference in publication lag: guest nights are published only through June, while arrivals are published through July. You must not divide July arrivals by June guest nights. Every nights-per-visitor figure below is calculated by dividing figures for the same month (most recently June 2026); the July JNTO number is treated separately, as the latest trend on the arrivals side.
Nights per visitor fell from 4.24 to 3.96 — what the gap really is
Dividing foreign guest nights by inbound arrivals for the same month yields the average number of nights an inbound visitor spent at accommodation facilities in Japan. Taking the January–June totals and dividing them gives a weighted average of 4.35 nights in 2024, 4.24 nights in 2025 and 3.96 nights in 2026. The 2026 figure is down 6.6% from the same period a year earlier and down 8.9% from 2024.
The scale of that 0.28-night decline is easiest to grasp converted into guest nights. Inbound arrivals in January–June 2026 totalled 21,085,108. Had nights per visitor stayed at the 2025 level of 4.24, foreign guest nights would have come to roughly 89.40 million. The actual figure was 83.53 million (June from the first preliminary release), a difference of about 5.87 million nights. In other words, roughly 5.9 million guest nights were lost in six months “for reasons other than the change in visitor numbers.”
Source: Japan Tourism Agency, Accommodation Survey, and JNTO, Statistics on Visitors to Japan, compiled by the HotelBank Editorial Team (June 2026 uses first preliminary figures)
Month by month, January 2026 stands out at an exceptionally low 3.57 nights; the figure then recovered to 4.16 nights in April before easing to 4.08 in May and 3.97 in June. Given that the same months in 2025 were 4.03, 4.41, 4.32 and 4.21 nights respectively, 2026 has sat below the 2025 line all year. The natural reading is not seasonality but a step down in the level itself. Length of stay also varies sharply by destination: Inbound Stay Length Varies 2.0x: Tokyo 2.32 vs Yamanashi 1.16 Nights sets out that spread prefecture by prefecture.
Almost the entire decline is concentrated in one market
So why did nights per visitor fall? Guest nights broken out by nationality (place of residence) make the structure clear. In the Japan Tourism Agency’s May 2026 figures for foreign guest nights by nationality (a survey covering facilities with 20 or more rooms, totalling 12,764,000 guest nights), the United States ranked first at 1,721,740 nights (up 1.9% year on year), followed by Taiwan at 1,698,370 (up 12.2%), South Korea at 1,596,820 (up 5.7%), China at 1,127,660 (down 53.8%) and Australia at 540,350 (down 2.3%).
Working back from the published year-on-year changes, China fell from roughly 2.44 million nights in May 2025 to about 1.13 million — a decline of some 1.31 million nights. Since the total decline on the same survey basis was about 0.92 million nights, everything other than China adds up to a gain of roughly 0.4 million nights (up 3.5% on that basis). In short, the fall in foreign guest nights is explained, in practical terms, by the movement of a single market. As for which prefectures are absorbing the stays from the markets that are growing, US Now Tops Japan Inbound at 13.5% — Prefecture Host Map 2026 lays that out at the prefecture level.
Source: Japan Tourism Agency, Accommodation Survey (May 2026, second preliminary), and JNTO, Statistics on Visitors to Japan, compiled by the HotelBank Editorial Team (guest nights are from the survey covering facilities with 20 or more rooms; because inbound arrivals are counted on an all-entrants basis, the ratios are a lower bound on actual length of stay)
| Market | Guest nights | Year on year | Inbound arrivals | Nights per visitor |
|---|---|---|---|---|
| United States | 1,721,740 | +1.9% | 333,696 | 5.16 nights |
| China | 1,127,660 | -53.8% | 313,123 | 3.60 nights |
| Taiwan | 1,698,370 | +12.2% | 616,804 | 2.75 nights |
| Hong Kong | 462,240 | -5.3% | 207,937 | 2.22 nights |
| South Korea | 1,596,820 | +5.7% | 951,328 | 1.68 nights |
Source: Japan Tourism Agency, Accommodation Survey (May 2026, second preliminary), and JNTO, Statistics on Visitors to Japan, compiled by the HotelBank Editorial Team. Guest nights come from the survey covering facilities with 20 or more rooms (total 12,764,000 nights), a different population from the all-facility total of 14.51 million nights
Nights per visitor differ by more than a factor of three between markets: 5.16 nights for the United States against 1.68 nights for South Korea. Scaled to the all-facility basis (14.51 million nights), the figures work out to roughly 5.9 nights for the United States, 4.1 for China, 3.1 for Taiwan, 2.5 for Hong Kong and 1.9 for South Korea. Put another way, losing one visitor from China has more than twice the impact on accommodation demand as gaining one from South Korea.
Looking at July 2026 arrivals, China was down 56.1% at around 428,000, South Korea up 31.9% at around 895,000, Taiwan up 26.4% at around 764,000 and Hong Kong up 54.8% at around 273,000. When short-haul, short-stay markets grow while long-stay markets shrink, guest nights can fall even as the headline total hits a record. That is the structure of the gap. Media reports attribute the decline from China to widespread reductions and suspensions of flights between Japan and China.
The impact skews to the major metros; regional Japan is relatively resilient
This substitution does not play out evenly across the map either. According to the Japan Tourism Agency’s May 2026 figures, foreign guest nights fell 11.5% year on year in the three major metropolitan areas (the eight prefectures of Saitama, Chiba, Tokyo, Kanagawa, Aichi, Kyoto, Osaka and Hyogo) and 3.4% in regional Japan. As a share of the total, the major metros accounted for 67.3% (against 69.2% in May 2025 and 71.0% in May 2024), declining for a third consecutive year, while regional Japan rose to 32.7%.
By prefecture, foreign guest nights in May 2026 were down across the main urban destinations — Tokyo 4,944,510 nights (down 9.8% year on year), Osaka 1,930,040 (down 16.8%), Kyoto 1,501,730 (down 15.9%) and Aichi 354,130 (down 20.4%) — while double-digit growth showed up in prefectures such as Kanagawa at 463,850 nights (up 17.1%), Aomori at 43,030 (up 33.0%), Ehime at 74,300 (up 47.6%) and Ibaraki at 33,460 (up 46.2%). The reading is that demand once concentrated on the Golden Route is dispersing in relative terms. How much of that demand regional Japan can absorb depends on the distribution of room stock, which Regional Japan: 61.7% of Rooms, 33.7% of Inbound Nights, 16.5% Growth examines from the supply side.
What happened to prices — year-on-year settled ADR estimates
So much for the official statistics. What about actual selling prices? Using MetroEngines Research settled ADR estimates (prefecture medians), we compared July 2026 with the same month a year earlier across all 47 prefectures. The sample in each prefecture consists of properties for which a settled ADR estimate could be calculated: N=1,136 properties in Tokyo, N=647 in Osaka and N=508 in Okinawa.
Source: MetroEngines Research, compiled by the HotelBank Editorial Team (top eight and bottom eight of the 47 prefectures)
The first thing that jumps out is Osaka at -30.7%, but this is the payback from Expo 2025 Osaka, Kansai, held from April 13 to October 13, 2025. Osaka’s settled ADR estimate was about ¥12,600 in July 2025 and about ¥8,800 in July 2026. The same caveat applies to Nara (-13.3%) and Kyoto (-12.8%), which absorbed spillover demand during the Expo period: the comparison year is exceptional and should be read with that in mind.
Looking beyond the Kansai region, the median year-on-year change in settled ADR estimates was -4.5% across the eight prefectures of the three major metropolitan areas and -2.5% across the 39 regional prefectures. The previous month, June 2026, showed the same ordering at -4.7% for the major metros and -1.6% for regional Japan, matching the direction of foreign guest nights (-11.5% in the major metros, -3.4% in regional Japan).
On the positive side are Akita at +8.9% (N=174 properties), Tokushima at +8.0% (N=141 properties) and Okinawa at +7.1% (N=508 properties). Okinawa was also up 15.8% in June 2026 and 12.5% in May, exceeding the prior year for three consecutive months. While urban rates are in a correction phase, resort and regional areas that are still growing their rates plainly exist.
Source: MetroEngines Research, compiled by the HotelBank Editorial Team (Tokyo, N=1,067–1,151 properties per month)
Tokyo on its own ran consistently above the prior year from January through May 2026 (May at about ¥15,100, up 6.7%). The turning point came in June, when the figure of about ¥12,100 flipped from positive to -3.9%, followed by about ¥12,600 and -4.8% in July. In other words, it took roughly one month for Tokyo’s 9.8% decline in foreign guest nights (May 2026) to show up in prices.
Guest nights, price and inventory sell-through across eight leading areas
The table below brings together official guest-night statistics, our settled ADR estimates and the state of OTA inventory sell-through (estimated OCC) in a single view. Estimated OCC is the share of sold rooms against the total room count in an area, an estimate based on how OTA-listed inventory is being consumed. Note that its population and definition differ from the room occupancy rate published by the Japan Tourism Agency, so the levels cannot be compared directly.
| Prefecture | Foreign guest nights, May 2026 | Same, year on year | ADR May YoY | ADR June YoY | ADR July YoY | Est. OCC July | Properties | Rooms |
|---|---|---|---|---|---|---|---|---|
| Tokyo | 4,944,510 | -9.8% | +6.7% | -3.9% | -4.8% | 93.1% | 1,354 | 182,896 |
| Osaka | 1,930,040 | -16.8% | -26.1% | -32.3% | -30.7% | 86.5% | 698 | 110,295 |
| Kyoto | 1,501,730 | -15.9% | +3.5% | -8.6% | -12.8% | 83.8% | 943 | 52,693 |
| Kanagawa | 463,850 | +17.1% | +3.3% | -6.2% | -7.9% | 85.6% | 607 | 47,397 |
| Aichi | 354,130 | -20.4% | +5.1% | -1.6% | -3.3% | 85.8% | 518 | 54,338 |
| Fukuoka | 713,850 | -12.7% | +10.3% | +0.4% | -0.0% | 91.1% | 603 | 54,406 |
| Hokkaido | 639,710 | -10.0% | +3.5% | +0.1% | +1.4% | 92.3% | 1,293 | 92,099 |
| Okinawa | 779,920 | -2.2% | +12.5% | +15.8% | +7.1% | 91.0% | 1,083 | 51,693 |
Source: foreign guest nights from the Japan Tourism Agency, Accommodation Survey (May 2026, second preliminary); settled ADR estimates and estimated OCC from MetroEngines Research. Compiled by the HotelBank Editorial Team
The most telling feature of this table is that the year-on-year change in guest nights and the year-on-year change in settled ADR estimates do not always point the same way. Kanagawa posted one of the strongest increases in foreign guest nights in the country at +17.1%, yet its settled ADR estimate was down 7.9% in July. Okinawa is the mirror image: guest nights slipped slightly at -2.2%, while its settled ADR estimate rose for three consecutive months. Growth or decline in arrivals and guest nights does not translate directly into rates.
On estimated OCC, the highest readings for July 2026 were Tokyo at 93.1% (1,354 properties, 182,896 rooms), Hokkaido at 92.3% (1,293 properties, 92,099 rooms), Fukuoka at 91.1% (603 properties, 54,406 rooms) and Okinawa at 91.0% (1,083 properties, 51,693 rooms). Kyoto, at 83.8% (943 properties, 52,693 rooms), was the lowest of the eight leading areas. With guest nights down 15.9% and July ADR down 12.8%, Kyoto is the area where the change in demand shows up most plainly in both price and inventory.
Note that estimated OCC data collection began in March 2026, so no year-earlier comparison is possible. What is shown here is a cross-sectional comparison of levels, not a discussion of increases or decreases.
The opportunity for operators — room to design for “nights,” not just heads
What does all of this mean for operating decisions? Three points.
First, there is a case for tracking guest nights rather than arrivals as the KPI. A record inbound arrival count does not guarantee that demand at your own property grows in step. In a period when nights per visitor moved from 4.24 to 3.96, demand forecasts built on head counts are prone to overshooting. Putting your area’s foreign guest nights and your property’s own foreign guest results side by side in the same unit — guest nights — makes changes in your share of the market visible.
Second, the growth of short-stay markets is a good moment to revisit multi-night rate design. If markets with 1.7 to 3.1 nights per visitor — South Korea, Taiwan, Hong Kong — are gaining share, one- and two-night bookings will increase in relative terms. Rather than keeping consecutive-night discount rates as they are, there is room in building a package that thickens the value delivered per night (breakfast, early check-in, luggage storage) so that rates hold up even on short stays. Conversely, for markets such as the United States where stays of more than five nights can be expected, designing benefits for three nights and above is itself an upside.
Third, the room for rate growth in regional Japan is backed by actual data. Regional Japan’s share of foreign guest nights has risen steadily: 29.0% in May 2024, 30.8% in May 2025 and 32.7% in May 2026. Settled ADR estimates tell the same story, with Akita up 8.9%, Tokushima up 8.0% and Okinawa up 7.1% (all July 2026, year on year) — regional areas growing their rates. Regional properties that have held prices down using urban levels as their benchmark have room to test stepped pricing.
All three are about how to go after demand, given the shift in demand composition now under way. A period in which arrivals stay at a peak while stays get shorter is also a period in which operators can re-choose whether to build revenue through rate or through length of stay.
Frequently asked questions
Q. If inbound arrivals are at a record high, why are guest nights falling?
A. Because the number of nights each visitor stays is getting shorter. Nights per visitor for January–June 2026 was 3.96, down 6.6% from 4.24 in the same period of 2025. The main driver is that markets with long stays (the United States at 5.16 nights, China at 3.60) declined while markets with short stays (South Korea at 1.68, Hong Kong at 2.22 — both May 2026, on the basis of the survey covering facilities with 20 or more rooms) grew.
Q. Can I divide July inbound arrivals by June guest nights to get nights per visitor?
A. No. The two statistics have different publication lags: as of August 2026, guest nights are published through June (first preliminary figures) and inbound arrivals through July. Nights per visitor must always be calculated using the same month for both. July guest nights (first preliminary) are scheduled for release at the end of September 2026.
Q. Can the year-on-year changes in the Accommodation Survey be compared as published?
A. Care is needed. To improve statistical accuracy, the stratification basis was changed from “number of employees” to “number of rooms” starting with the January 2026 (Reiwa 8) survey, and the Japan Tourism Agency itself notes that year-on-year comparisons and differences may include the effect of that revision. The year-on-year figures in this article may be affected as well.
Methodology and caveats
- Nights per visitor is calculated by dividing foreign guest nights from the Japan Tourism Agency’s Accommodation Survey (nationwide, all-facility basis) by JNTO inbound arrivals for the same month. Annual figures are weighted averages obtained by dividing the January–June totals for each year. Foreign guest nights for June 2026 use the published first preliminary figure (12.51 million nights) and may change in the second preliminary release.
- Guest nights by nationality (place of residence) are based on the survey covering “facilities with 20 or more rooms,” totalling 12,764,000 nights (May 2026). Because this is a different population from the all-facility total of 14.51 million nights, nights per visitor by market should be treated as a lower bound on actual length of stay.
- Starting with the January 2026 (Reiwa 8) survey, the Japan Tourism Agency’s Accommodation Survey changed its stratification basis from “number of employees” to “number of rooms.” Year-on-year comparisons and differences may include the effect of that revision.
- The survey covers accommodation facilities under the Hotel Business Act; lodging formats outside its scope are not included.
- Settled ADR estimates use, as their population, the roughly 27,000 properties and approximately 1.26 million rooms with confirmed activity on OTAs among the approximately 168,000 domestic properties tracked by MetroEngines Research, taking the median of properties for which a settled ADR estimate could be calculated in each prefecture. The N (number of properties covered) for each prefecture is given in the text and exhibits.
- Because estimated OCC data collection began in March 2026, no year-on-year comparison is made. Only a cross-sectional comparison of levels is presented.
Conclusion
Inbound arrivals of 3,442,100 in July 2026 were a record for the month of July, and foreign guest nights of 12.51 million in June 2026 were down 11.9% year on year. The two are not contradictory. What connects them is nights per visitor, calculated by dividing same-month figures, which fell 6.6% from 4.24 nights in January–June 2025 to 3.96 nights in the same period of 2026.
The main cause of that shortening is the turnover in nationality mix. In the May 2026 data by nationality, guest nights from China fell 53.8% year on year, a decline of roughly 1.31 million nights — larger than the total decline on the same basis (about 0.92 million nights). Everything other than China adds up to a gain of roughly 0.4 million nights, so the decline is concentrated in essentially a single market. Nights per visitor range more than threefold — 5.16 for the United States, 3.60 for China, 2.75 for Taiwan, 2.22 for Hong Kong and 1.68 for South Korea — so replacing long-stay markets with short-stay ones pushes guest nights down even when arrivals hold steady.
Price reality is consistent with the same picture. Year-on-year settled ADR estimates for July 2026 show a median of -4.5% across the eight prefectures of the three major metropolitan areas and -2.5% across the 39 regional prefectures, matching the direction of foreign guest nights (-11.5% in the major metros, -3.4% in regional Japan, May 2026). At the same time, areas such as Okinawa at +7.1%, Akita at +8.9% and Tokushima at +8.0% are still growing their rates, so this is not a uniform nationwide correction.
For operators, three concrete entry points turn this shift in demand composition into revenue: move the KPI from arrivals toward guest nights; thicken the value delivered per night on the assumption that short stays are increasing; and test stepped pricing in regional areas while checking the room for rate growth against actual data.
Related articles
- Regional Japan: 61.7% of Rooms, 33.7% of Inbound Nights, 16.5% Growth
- Japan Hotels 7.9% Cheaper in USD Than 2019 — But +38.3% in Yen
- China National Day 2026: 21pt Weekday OCC Gap Across 26 Prefectures
- What Is Hotel ADR? Settled Rates 34-57% of Listed Prices, 2026
- Osaka City vs Business Hotels: 1.49x ADR Gap Explained by Meals
- Inbound Stay Length Varies 2.0x: Tokyo 2.32 vs Yamanashi 1.16 Nights
- US Now Tops Japan Inbound at 13.5% — Prefecture Host Map 2026
- City Hotels: 45.9% of Guest Nights Are Foreign — Ryokan +3.7%
- June 2026 Occupancy 56.2%: Guest-Nights per Room in 47 Prefectures
References and sources
■ Government statistics and public data
- Japan Tourism Agency, “Accommodation Survey (May 2026 second preliminary; June 2026 first preliminary)” (published July 31, 2026)
- Same, press release materials (PDF)
- Japan Tourism Agency, “Accommodation Survey” time-series tables (monthly foreign guest nights by prefecture)
- JNTO (Japan National Tourism Organization), “Inbound Arrivals (July 2026 estimate)” (August 19, 2026)
- JNTO, “Statistics on Visitors to Japan,” monthly estimates (Excel)
■ Data sources
Inbound arrivals are from JNTO, “Statistics on Visitors to Japan” (through the July 2026 estimate). Guest nights and room occupancy rates are from the Japan Tourism Agency, “Accommodation Survey” (May 2026 second preliminary; June 2026 first preliminary). Guest nights by nationality are the portion of that survey covering facilities with 20 or more rooms. Settled ADR estimates and estimated OCC are from MetroEngines Research (settled ADR estimates: 47 prefectures, January 2025 to July 2026; estimated OCC: July 2026).
■ Calculation assumptions
Nights per visitor = foreign guest nights ÷ inbound arrivals for the same month. Annual figures are weighted averages obtained by dividing the January–June totals for each year. Area-level settled ADR estimates are the median of properties for which a settled ADR estimate could be calculated in the prefecture concerned (July 2026: Tokyo N=1,136 properties, Osaka N=647, Okinawa N=508, Akita N=174, Tokushima N=141). The three major metropolitan areas are the eight prefectures of Saitama, Chiba, Tokyo, Kanagawa, Aichi, Kyoto, Osaka and Hyogo; regional Japan is the remaining 39 prefectures. The median of prefecture-level year-on-year changes was calculated for each group.
■ Limitations and caveats
Because inbound arrivals and guest nights have different publication lags, every division is performed using the same month for both (most recently June 2026). Starting with the January 2026 (Reiwa 8) survey, the Accommodation Survey changed its stratification basis from “number of employees” to “number of rooms,” and year-on-year comparisons and differences may include the effect of that revision. Settled ADR estimates and estimated OCC are both estimates, and because their population and definition differ from the room occupancy rate published by the Japan Tourism Agency, the levels cannot be compared directly. No year-on-year comparison is made for estimated OCC because data collection began in March 2026.
■ Market data
- MetroEngines Research — settled ADR estimates (47 prefectures, January 2025 to July 2026) and estimated OCC (May to July 2026)
■ News and reference articles