

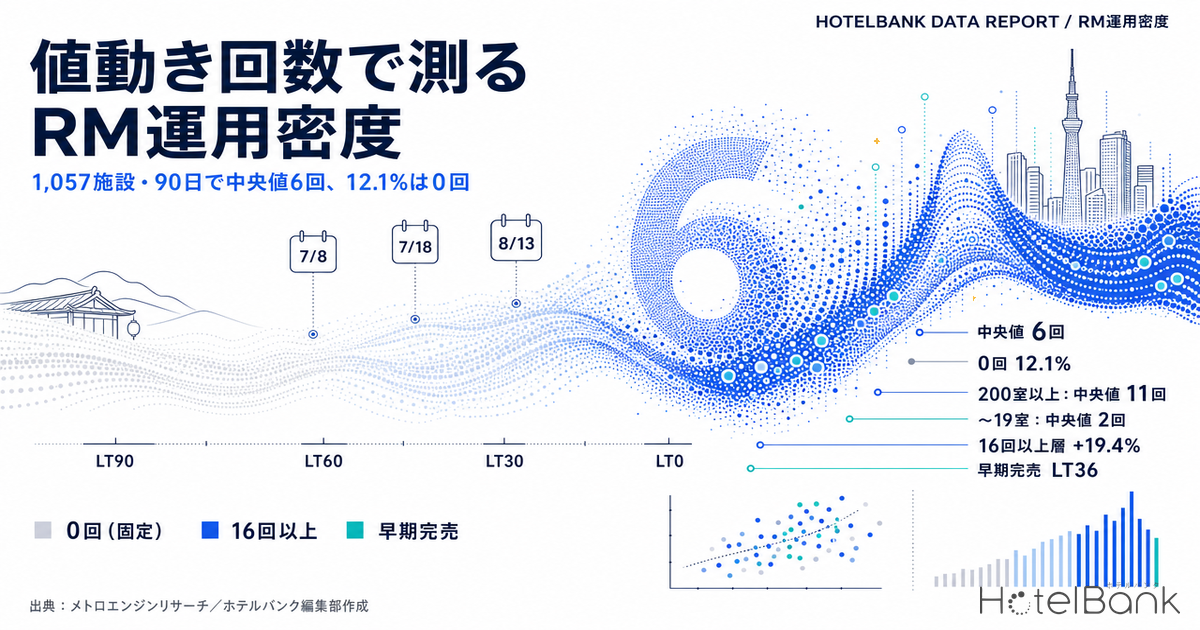
Hotel revenue management is decided not only by “what price to sell at,” but by the operational density behind it — when, and how many times, a property actually touches its rates. Yet almost no statistics measuring that operational density from the outside have ever been published. Drawing on inventory and price observation records running from 90 days before check-in through the check-in date itself, this article counts how many times individual properties actually moved their prices across 1,057 hotels, quantifies how that differs by area, property type and room count, and measures how much headroom remains for the segment that barely moves price at all.
Metric Definitions Used in This Article
- LT (lead time): Days remaining until the check-in date. LT0 = the check-in date itself; LT60 = 60 days out.
- Lowest offered rate: The per-room rate (tax included) of the cheapest plan publicly listed on OTAs and similar channels for that property and that check-in date on each observation day. It is a listed rate, not an actual transacted rate. Because display conditions differ by property (single occupancy versus two guests per room), this article handles it as ratios and rates of change as a rule.
- Price move count: The number of days within the observation window (LT90 to LT0) on which the lowest offered rate changed from the previous day’s observation. It captures both revisions to the rate itself and switches in which plan is cheapest, caused by low-priced plans selling out.
- Revision size per move: For days on which a price move occurred, the median day-over-day rate of change (absolute value).
- Price range: The spread between the highest and lowest values observed during the window (expressed as a percentage of the lowest value).
- Early sell-out LT: The lead time at which remaining rooms first reached zero. The larger the value, the earlier the sell-out.
- Data source: MetroEngines Research
- — Median of 6 moves Across the 90-day observation window, the median price move count was 6. Prices differed from the previous day on only about 7% of the 84 observed days.
- — 12.1% never moved Of 1,057 properties and 1,468 property-date records, 12.1% never changed price once, and 46.4% moved 5 times or fewer.
- — Room count is the largest explanatory variable Properties of 19 rooms or fewer posted a median of 2 moves and a 23.0% zero-move share; those of 200 rooms or more posted a median of 11 moves and a 0.6% zero-move share, changing monotonically across size bands.
- — 0% even when sold out Even in cases that sold out before LT7, the zero-move segment’s price range was 0%. Its 46.9% sell-out rate was the highest of the four bands.
- — +10.6% to +19.4% In those same sell-out cases, high-frequency properties had lifted their lowest offered rate by a median of +10.6% to +19.4% versus LT60, and to +25.1% to +32.5% at peak.
A Median of 6 Moves in 90 Days — Prices Changed on Fewer Than 1 Day in 10
The sample covers six prefectures — Tokyo, Kanagawa, Osaka, Kyoto, Hokkaido and Fukuoka — three property types — business hotels, ryokan and resort hotels — and three check-in dates: Wednesday, July 8, 2026 (a weekday), Saturday, July 18, 2026 (the first day of a three-day weekend) and Thursday, August 13, 2026 (Obon). For each of these 6 × 3 × 3 = 54 combinations, we extracted properties publishing at least 30% of their total room count as inventory on OTAs and similar channels, and limited the analysis to those with 60 or more observation days. The final population is 1,057 properties and 1,468 records (property × check-in date), with a median of 84 observation days per record.
Start with the overall picture. The median price move count was 6. Six moves against 84 observation days means prices differed from the previous day on only about 7% of days. Put the other way around, on more than nine days out of ten the same price as the day before was sitting on the shelf.
Splitting the distribution into four bands: properties that never moved price at all accounted for 12.1%, 1–5 moves for 34.3%, 6–15 moves for 40.5%, and 16 or more moves for 13.1%. In other words, nearly half — 46.4% — touched their prices five times or fewer over 90 days.
Source: MetroEngine Inc.; compiled by the HotelBank Editorial Team
By property type the gap is stark. Business hotels showed just 4.0% with zero moves, while 22.2% made 16 or more; their median was 9. Ryokan, by contrast, showed 23.4% at zero moves and only 2.0% at 16 or more, with a median of just 3. Resort hotels sat in between at 9.3% zero-move and a median of 5.
This is best read not as better or worse, but as a reflection of market structure. Business hotels have simple room-type line-ups and clear demand gaps between weekdays, weekends and event dates, so the decision to move price is easy to standardize. Ryokan, by contrast, combine meals, room types and seasonal plans in complex ways, and moving a single rate cascades across many linked plans. The very structure that makes prices hard to move shows up as a low price move count. How far price volatility ultimately spreads by property type is organized as ADR volatility by area and property type in RM Tools & Price Dispersion.
Room Count Is What Sets Price Move Frequency — 2 Moves at 19 Rooms or Fewer
An even stronger driver than property type was room count. Properties with 19 rooms or fewer posted a median of 2 price moves, with the zero-move share reaching 23.0%. At 200 rooms or more, the median rises to 11 and the zero-move share falls to 0.6%. Operational density increases monotonically as the size band goes up.
Source: MetroEngine Inc.; compiled by the HotelBank Editorial Team
| Room-count band | N (property × date) | Price moves (median) | Zero-move share | Price range (median) |
|---|---|---|---|---|
| Up to 19 rooms | 427 | 2 | 23% | 18.5% |
| 20–49 rooms | 312 | 5 | 15.1% | 33.3% |
| 50–99 rooms | 243 | 8 | 6.6% | 40% |
| 100–199 rooms | 331 | 9 | 4.5% | 44.4% |
| 200 rooms or more | 155 | 11 | 0.6% | 40.4% |
Source: MetroEngine Inc.; compiled by the HotelBank Editorial Team
Price range — the spread between the highest and lowest values during the observation window — moves in the same direction: 18.5% at 19 rooms or fewer, and 44.4% at 100–199 rooms. The more often a property moves price, the wider its price swing. That looks like an obvious relationship, but the important reading is the inverse: properties with few price moves are selling strong-demand days and weak-demand days at essentially the same price.
Much of the correlation between size and operational density can be explained by staffing. A 200-room property can dedicate a full-time revenue manager. At a 20-room ryokan, the okami or general manager watches pricing alongside guest service, purchasing and housekeeping. It is reasonable to see the gap in operational density not as a gap in awareness but as a gap in the hours that can be invested. Precisely for that reason, this is also a gap that systems can close.
Moves Split Evenly Between Up and Down — This Is Not a “Rate-Hike Function”
Looking at the 1,291 records with at least one price move, the share of moves in the upward direction came to exactly 50.0% at the median. It stays at 50.0% for the 1–5 move band, the 6–15 move band and the 16-or-more band alike. The revision size per move has a median of roughly 9–11%.
This result shows that properties moving prices frequently are not simply “raising rates all the time.” When demand comes in softer than expected, they cut; when it comes in stronger, they raise. Symmetrical adjustment in both directions is what operational density actually consists of, and the price move count should be read not as a count of rate hikes but as a count of responses to demand.
Prices Move Least on the Days That Sold Out — The Biggest Headroom
Here is the core of this analysis. Of the 1,468 records analyzed, 451 were “early sell-out” cases in which remaining rooms reached zero before LT7 (earlier than seven days before check-in). Breaking those 451 down by price move band reveals an unexpected structure.
In the zero-move segment, 46.9% of 177 records had sold out before LT7 — the highest sell-out rate of the four bands. What is more, the median lead time at which remaining rooms first hit zero was LT36: sold out more than a month before check-in. For the 16-or-more band, the sell-out rate was 21.8% and the median early sell-out LT was LT17.5.
| Price move band | N (property × date) | Rooms (median) | Share sold out before LT7 | Early sell-out LT (median) | Price range (median) |
|---|---|---|---|---|---|
| 0 moves (fixed) | 177 | 14 rooms | 46.9% | LT36 | 0% |
| 1–5 moves | 503 | 22 rooms | 34.6% | LT31.5 | 22.2% |
| 6–15 moves | 595 | 81 rooms | 25.5% | LT24 | 46.5% |
| 16 moves or more | 193 | 134 rooms | 21.8% | LT17.5 | 67.1% |
Source: MetroEngine Inc.; compiled by the HotelBank Editorial Team
One confounder demands caution here: room count. The median room count of the zero-move segment was 14; for the 16-or-more segment it was 134. Small properties physically reach full occupancy on far fewer bookings, so sell-outs surface earlier. A simple causal reading — “they sell out early because they don’t move prices” — therefore does not hold.
Even so, one thing is certain. An early sell-out is measured evidence that demand for that date was strong. And in the very situations where that strong demand was observed, the zero-move segment’s price range was 0% — it sold out at exactly the same price from first observation to last. That is not weakness; it is room that has yet to be used. How the lowest offered rate actually behaves by lead time differs from area to area, but the zero-move segment shows no movement at all in either direction.
In Sell-Out Situations, High-Frequency Operators Captured +10% to +19%
So, within those same “sold out early” situations, how did the properties with high price move counts actually move their rates? We indexed the lowest offered rate at LT60 to 100 and traced the median trajectory by band.
Source: MetroEngine Inc.; compiled by the HotelBank Editorial Team
The zero-move segment (N=83) is perfectly flat at an index of 100 from LT60 through LT0. The 1–5 move segment (N=174) is also close to flat at the median, though its highest value during the window reached 107.8.
By contrast, the 6–15 move segment (N=152) begins climbing around LT30, reaching 110.6 at LT0 with a median in-window peak of 125.1. The 16-or-more segment (N=42) hit 119.4 at LT7, with a median peak of 132.5. At the same time, this segment’s median in-window low was 89.4 — it moved downward as well. This is not a one-way climb: it contains a round trip in which rates are cut in response to a misread on demand and then raised again from there.
To summarize: in situations where demand was confirmed (an early sell-out), properties moving prices frequently had lifted the lowest offered rate to a median of +10.6% to +19.4% versus LT60, and at peak to +25.1% to +32.5%. The zero-move segment stood at ±0% in those identical situations.
That difference is a direct gauge of the headroom available. Suppose a property targeted only dates with a proven sell-out record, introduced a practice of stepping prices up from LT30 onward, and achieved roughly the +10% median of the high-frequency segment. At a property with a ¥20,000 lowest offered rate, applying that across 10 sold-out dates and 20 rooms produces, on a simple calculation, an uplift in the range of several hundred thousand yen a year. What matters here is not the size of the figure but the fact that because those dates already sell out, the test can be run without taking inventory risk. Being able to start with the dates that carry the lowest risk of unsold rooms is the defining property of this headroom.
A suggested order of attack
(1) Identify the dates that sold out early in the past → (2) on those dates, raise price by just one or two steps between LT30 and LT7 → (3) if the sell-out LT comes too early, increase the size of the step next time; if rooms are left over, revert. The goal is not to push the price move count from 6 to 10 over 90 days, but to increase the number of times you intervene on the handful of days when demand is strong.
Price Moves Versus Price Range — The Same Gradient Across Property Types
Plotting price move count against price range at the property level shows that different property types sit on the same gradient. Ryokan cluster in the lower left (low frequency, narrow range) while business hotels extend to the upper right (high frequency, wide range). Even so, a group of ryokan does sit in the upper right, which simultaneously shows that property type does not dictate operational density.
Source: MetroEngine Inc.; compiled by the HotelBank Editorial Team
By Area — Tokyo Has 22.9% at 16+ Moves, Osaka Has 17.0% at Zero
Looking at composition by prefecture, Tokyo had the highest share of records at 16 or more moves among the six prefectures at 22.9%, with a median of 8. Kanagawa had the lowest zero-move share at 7.8% while sitting at 11.3% for 16 or more, indicating a thick layer of mid-range operation. Osaka came in on the high side at 17.0% zero-move, and Fukuoka at 15.7%.
Source: MetroEngine Inc.; compiled by the HotelBank Editorial Team
A substantial part of this gap, however, can be explained by each area’s property-type mix and size distribution. Osaka’s sample includes many small ryokan, and that layer’s zero-move share pushes up the overall figure. Checking the area × property-type matrix, business hotels alone come in at 10 moves in Tokyo, 11 in Hokkaido, 10 in Fukuoka, 8 in Osaka, 8 in Kyoto and 8 in Kanagawa — the gap between areas is smaller than the gap between property types.
| Area | Property type | N | Price moves (median) | Zero-move share | Revision size per move (median) | Price range (median) |
|---|---|---|---|---|---|---|
| Tokyo | Business hotel | 110 | 10 | 3.6% | 6.9% | 39% |
| Tokyo | Ryokan | 48 | 2 | 22.9% | 11.1% | 14.9% |
| Tokyo | Resort hotel | 12 | 3.5 | 8.3% | 11.4% | 23.6% |
| Kanagawa | Business hotel | 109 | 8 | 2.8% | 7.9% | 40.9% |
| Kanagawa | Ryokan | 105 | 5 | 17.1% | 13.4% | 31.3% |
| Kanagawa | Resort hotel | 68 | 6 | 1.5% | 9.1% | 34.2% |
| Osaka | Business hotel | 118 | 8 | 3.4% | 8.8% | 41.2% |
| Osaka | Ryokan | 56 | 1.5 | 44.6% | 9.6% | 5.3% |
| Osaka | Resort hotel | 8 | 1.5 | 25% | 25.9% | 26.3% |
| Kyoto | Business hotel | 116 | 8 | 5.2% | 9.8% | 50.6% |
| Kyoto | Ryokan | 108 | 2 | 16.7% | 10.6% | 24.4% |
| Kyoto | Resort hotel | 21 | 6 | 9.5% | 12.2% | 49.5% |
| Hokkaido | Business hotel | 112 | 11 | 3.6% | 8.8% | 43% |
| Hokkaido | Ryokan | 113 | 2 | 22.1% | 12.4% | 26.1% |
| Hokkaido | Resort hotel | 115 | 5 | 12.2% | 9.7% | 31.8% |
| Fukuoka | Business hotel | 114 | 10 | 5.3% | 10.2% | 45.6% |
| Fukuoka | Ryokan | 112 | 2 | 26.8% | 12.4% | 13.7% |
| Fukuoka | Resort hotel | 23 | 6 | 13% | 12.2% | 53.8% |
Source: MetroEngine Inc.; compiled by the HotelBank Editorial Team (N = property × check-in date; cells with N below 8 are not shown)
Looking at revision size per move, ryokan land at 9.6–13.4%, larger than the 6.9–10.2% of business hotels. The operating pattern is one of moving prices rarely but moving them by a lot when they do — consistent with a seasonal rate-card approach that builds the year’s pricing on a small number of decisions.
High-Frequency Operation in Practice — Three Properties on Obon, August 13
To see what actual price movement looks like, we examine measured data for three properties with a check-in date of August 13, 2026 (the Obon peak). All three display rates on a single-guest, single-room basis, so their listed prices can be compared directly.
Source: MetroEngine Inc.; compiled by the HotelBank Editorial Team
| Property | Rooms | Price moves | In-window low | In-window high | Early sell-out LT | Days observed sold out |
|---|---|---|---|---|---|---|
| Hotel Indigo Hakone Gora (ホテルインディゴ箱根強羅) | 98 rooms | 21 | ¥57,500 | ¥133,800 | LT14 | 1 day |
| Hotel Marinoa Resort Fukuoka (ホテルマリノアリゾート福岡) | 43 rooms | 21 | ¥36,800 | ¥56,500 | LT28 | 5 days |
| Esperia Hotel Hakata (エスペリアホテル博多) | 287 rooms | 19 | ¥11,800 | ¥24,400 | LT24 | 1 day |
Source: MetroEngine Inc.; compiled by the HotelBank Editorial Team. Prices are lowest offered rates (single guest, single room; per room; tax included), rounded to the nearest ¥100
Esperia Hotel Hakata (エスペリアホテル博多, 287 rooms) stepped its level up from around ¥12,400 at LT60, reaching an index of 141 around LT10 and ultimately 148. Most of its 19 price moves were concentrated in the final month, and prices continued to move even after remaining rooms hit zero at LT24. Prices moving after a sell-out is likely a matter of reselling inventory returned through cancellations at a higher level.
Hotel Indigo Hakone Gora (ホテルインディゴ箱根強羅, 98 rooms) started at around ¥68,000 at LT60, first cut to an index of 87.6, then reversed course toward its LT14 sell-out and ultimately lifted to 140.9. Its 21 moves clearly contain a down-then-up round trip — a textbook pattern of changing direction after watching demand build.
Hotel Marinoa Resort Fukuoka (ホテルマリノアリゾート福岡, 43 rooms) did the opposite: it raised early, to an index of 120.8 around LT50, then pulled back to roughly 83 before selling out at LT28. At a mid-size 43 rooms it still delivered 21 price moves, a concrete example that being small does not mean being unable to move. For how far inventory was absorbed across the prefectures of Kyushu over that same Obon period, see Obon T-7: Kyushu’s 31.7pt Gap, which compares the six prefectures directly.
Translating the Headroom Into Yen — The Rate Level Changes the Order of Magnitude
The figures so far have been expressed as ratios, but in practice the decision turns on how much this is worth per room per night. This section introduces no new forecast; it is a unit conversion that multiplies the uplift levels observed in the article by the lowest offered rate. Only one formula is used — “uplift = lowest offered rate × uplift rate” — with no occupancy rate or conversion rate applied.
| Scenario | Uplift rate (observed in this article) | Per room per night | Total for 10 days × 20 rooms |
|---|---|---|---|
| Mid case LT0 level of the 6–15 move segment | +10.6% | ¥2,120 | ¥424,000 |
| Upper case LT7 level of the 16-or-more move segment | +19.4% | ¥3,880 | ¥776,000 |
| Peak case In-window peak level of the 6–15 move segment | +25.1% | ¥5,020 | ¥1,004,000 |
Source: MetroEngines Research; compiled by the HotelBank Editorial Team (unit conversion using only values stated in this article)
The mid case totals ¥424,000, matching the “several hundred thousand yen a year” mentioned above. Next, we vary the rate level itself. The vertical axis uses five lowest-offered-rate levels that actually appear in this article, and the horizontal axis uses five uplift levels observed in this article; neither extends beyond the observed range.
| Lowest offered rate | ±0% (zero-move segment) | +10.6% | +19.4% | +25.1% | +32.5% |
|---|---|---|---|---|---|
| ¥11,800 | ¥0 | ¥1,251 | ¥2,289 | ¥2,962 | ¥3,835 |
| ¥20,000 | ¥0 | ¥2,120 | ¥3,880 | ¥5,020 | ¥6,500 |
| ¥36,800 | ¥0 | ¥3,901 | ¥7,139 | ¥9,237 | ¥11,960 |
| ¥57,500 | ¥0 | ¥6,095 | ¥11,155 | ¥14,432 | ¥18,688 |
| ¥133,800 | ¥0 | ¥14,183 | ¥25,957 | ¥33,584 | ¥43,485 |
Source: MetroEngines Research; compiled by the HotelBank Editorial Team (unit conversion using only values stated in this article)
Two things stand out. First, at the same +10.6%, the uplift per room per night spans an 11.3-fold range, from ¥1,251 (at ¥11,800) to ¥14,183 (at ¥133,800). The debate over “how many percent can we raise” does not determine the size of the money until the rate level is fixed. Second, in the low-rate band, percentages alone do not accumulate into meaningful amounts. For a property at ¥11,800 to match, in yen, the +10.6% of a ¥57,500 property (¥6,095), it would need +51.7% — beyond the largest uplift observed in this article, +32.5% (worth ¥3,835). Headroom in the low-rate band has to be pursued through the number of dates it can be applied to, not the size of the daily increment.
All of these figures assume application only to dates with a proven sell-out record. As noted above, starting from dates that already sell out lets a property run the test without risking lost inventory.
Conclusion — “How Many Times Did You Move It” Is Measurable, and Increasable
Three points emerge from the measured data on 1,057 properties and 1,468 records.
First, days on which prices move are the exception. Over a 90-day observation window the median price move count was 6, and on more than nine days in ten the same price as the previous day was on the shelf. Second, what most strongly governs operational density is neither property type nor area but room count: 19 rooms or fewer gives a median of 2 moves and a 23.0% zero-move share, while 200 rooms or more gives a median of 11 and a 0.6% zero-move share, changing monotonically across size bands. Third, even when a strong demand signal in the form of an early sell-out is present, the zero-move segment does not move price at all. In those same situations, the high-frequency segment achieved +10.6% to +19.4% versus LT60, and +25.1% to +32.5% at peak.
The virtue of the price move count as a metric is that it lets a property score its own operation from the outside, and immediately. Open the last 90 days of sales records and simply count the number of days on which the price of the cheapest plan changed. If the answer is five or fewer, there is certainly an unworked peak of demand still sitting there. And because you can start with dates that already sell out, the test can begin without taking on the risk of losing inventory.
According to the Japan Tourism Agency’s Accommodation Travel Statistics Survey, the nationwide room occupancy rate in June 2026 was 56.2% — the market as a whole is not full. That is precisely why how a property handles the handful of days when demand concentrates translates into a revenue gap. How many times are you moving price? That simple question is the easiest yardstick available for measuring that gap.
On data limitations: The price move count in this article is a daily observation of price changes in the cheapest plan publicly listed on OTAs and similar channels, and it captures both revisions to the rate itself and switches in which plan is cheapest caused by low-priced plans selling out. It should therefore be interpreted not as the number of decisions made by the property, but as the number of price changes observable from the market. In addition, extraction was limited to properties publishing at least 30% of their total room count as inventory on OTAs and similar channels, so operations centred on direct booking, or properties that restrict inventory allocation to OTAs, are not included. Because the analysis draws from the top of the inventory signal within each band, it tends to skew toward properties where demand pressure was observed. That bias works in the direction of overstating the price move count, so the “low frequency of price moves” shown here should be regarded as a conservative lower bound.
Related reading
- Solo vs Family Stays Just 0.3pt Apart — Rethinking Rate and Inventory
- Miyazaki & Saga Hotel Investment Whitespace: Zero Hotels at ¥18-25k
- 493 Medical Conferences in Japan: 75.7% of Nights Fall Wed-Fri
- Autumn School Trips: Weekday Rate Floors in 5 Areas, Nagasaki +1.6pt
- RM Tools & Price Dispersion: Tokyo/Osaka ADR Volatility by Hotel Type
- Tokyo Aug 14: 434 Hotels, Front-Loaded 10.8% vs Late-Surge 9.4%
- Obon T-7: Kyushu’s 31.7pt Gap — Fukuoka 73.0%, Kagoshima 41.3%
References and Sources
■ Data source
Daily observation records of inventory and prices. For 54 segments — six prefectures (Tokyo, Kanagawa, Osaka, Kyoto, Hokkaido and Fukuoka) × three property types (business hotels, ryokan and resort hotels) × three check-in dates (July 8, July 18 and August 13, 2026) — we extracted properties publishing at least 30% of their total room count as inventory on OTAs and similar channels, and analyzed those with 60 or more observation days (1,057 properties and 1,468 records, with a median of 84 observation days per record). Statements on nationwide room occupancy are based on the Japan Tourism Agency’s Accommodation Travel Statistics Survey (June 2026, first preliminary figures).
■ Calculation assumptions
The section “Translating the Headroom Into Yen” is a unit conversion, not a forecast. Only one formula is used — “uplift = lowest offered rate × uplift rate” — and the five price levels on the vertical axis (¥11,800 to ¥133,800) and the five uplift rates on the horizontal axis (0 to +32.5%) are all values that actually appear in this article; nothing is extrapolated beyond the observed range. No occupancy rate, conversion rate or cost is introduced. The base case (a ¥20,000 lowest offered rate, +10.6%, 10 sold-out dates and 20 rooms) is identical to the worked example given in the text, and the ¥424,000 total is consistent with the “several hundred thousand yen a year” stated there.
■ Limitations and caveats
The price move count is a daily observation of price changes in the cheapest plan publicly listed on OTAs and similar channels; it is not the number of decisions made by the property (it captures both rate revisions and switches in which plan is cheapest caused by low-priced plans selling out). Because extraction draws from the top of the inventory signal within each band, it skews toward properties where demand pressure was observed, so the low frequency of price moves shown here should be regarded as a conservative lower bound. Prices are listed rates, not transacted rates. The relationship between early sell-out and price move count is confounded by room count and cannot be read as causal.
■ Market data
- MetroEngines Research — Daily observation records of inventory and prices (6 prefectures × 3 property types × 3 check-in dates; 1,057 properties and 1,468 records analyzed)
■ Government statistics