

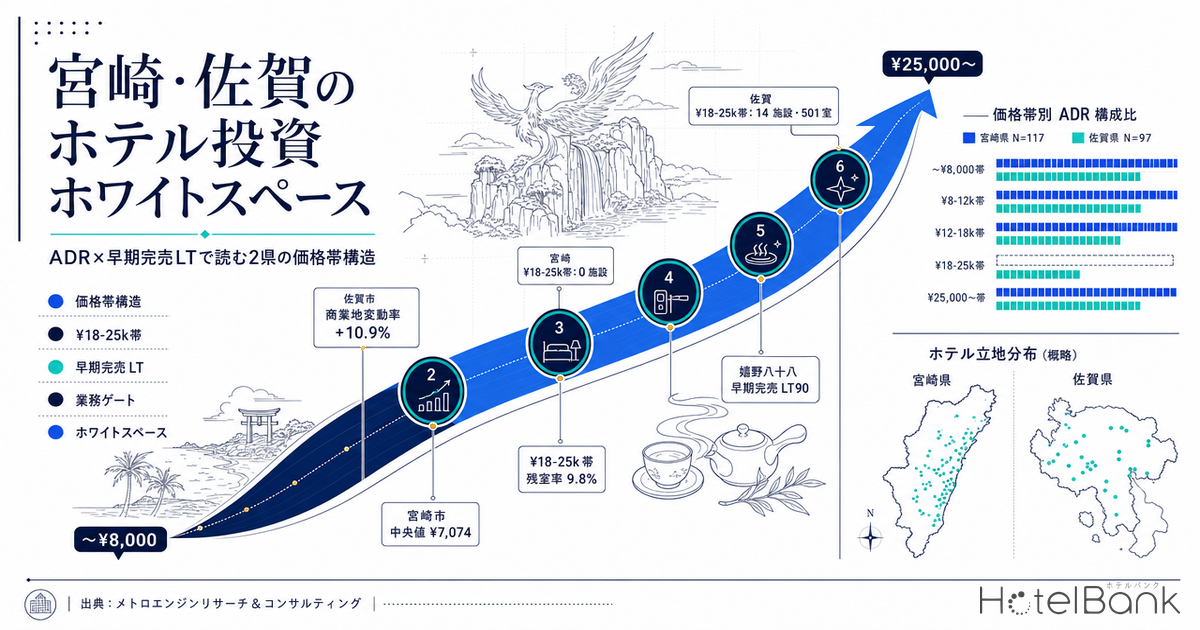
When Kyushu’s hotel investment map is drawn, Fukuoka, Kumamoto, Oita and Kagoshima come up again and again, while Miyazaki and Saga rarely receive a consolidated quantitative treatment. The two prefectures share a similar structure — business demand concentrated in the prefectural capital, plus nationally recognised onsen and resort locations within the prefecture — yet their price-band distributions could hardly be more different. This article matches estimated settled ADR against room-level inventory absorption data for lodging properties in Miyazaki and Saga whose operations can be observed within the coverage of MetroEngines Research, and quantifies which price bands are empty on the supply side and whether demand actually backs them up.
Metric Definitions Used in This Article
- ADR (average daily rate) = an estimated settled rate (tax-exclusive equivalent) calculated by applying property-type correction coefficients to the lowest published plan level each property lists on OTAs and similar channels (two guests per room, per-room rate, tax included). Cross-checked against property-level actuals disclosed by listed hotel REITs (91 properties, most recent three months), the median error is approximately 7%. These are estimates and differ from each property’s actual transaction prices and accounting figures. Area-level ADR is the median of the properties covered (the level of a typical property in that area).
- OCC (occupancy rate) = the share of sold rooms against total rooms within an area (an estimate based on OTA sales inventory). Used only at macro units such as prefecture and municipality; occupancy for individual properties is not calculated.
- LT (lead time) = the number of days until the check-in date. LT0 = same day. Earliest sellout LT = the lead time at which remaining rooms first reached zero (a larger value means the property sold out earlier).
- Data source: MetroEngines Research & Consulting
- — Miyazaki has zero properties in the ¥18,000–25,000 estimated settled ADR band. Of the 117 properties with 10 or more rooms for which an ADR could be calculated, 76.1% cluster below ¥8,000, and Miyazaki City’s interquartile range is compressed into ¥5,907–8,106.
- — Saga sustains 14 properties and 501 rooms in that same band. Supply is spread across five tiers, from 34.0% below ¥8,000 to 19.6% above ¥25,000, demonstrating that an upper-middle price band can work in a regional market.
- — The empty band is where supply and demand are tightest. In room-level inventory for Obon 2026 (Aug 13–16), all five covered properties in the ¥18,000–25,000 band were observed selling out, and the average remaining-room rate of 9.8% was the lowest of any price band.
- — A new build cannot reach an 8% yield. Construction cost runs to roughly ¥37.3 million per room (excluding land), against a maximum investment of ¥19.51M–¥21.68M for an 8% yield at ADR ¥18,000–20,000.
- — The realistic answer is converting existing stock. Miyazaki City’s sub-¥8,000 band holds a pool of 89 properties and 6,860 rooms; acquisition at around ¥20 million per room plus a full renovation makes the economics of the empty band work.
Summary — Not One Property in Miyazaki Sits in the ¥18,000–25,000 Estimated Settled ADR Band
Start with the conclusion. In Miyazaki, of the 117 properties with 10 or more rooms for which an estimated settled ADR could be calculated, not a single one sits in the ¥18,000–25,000 price band. The ¥12,000–18,000 band holds just 7 properties and 396 rooms, and 76.1% of properties (75.6% of rooms) cluster below ¥8,000. Narrowing to Miyazaki City, a market of 44 properties and 4,897 rooms is compressed into an extremely narrow interquartile range of ¥5,907–8,106.
Saga, by contrast, is a regional prefecture with a hierarchical spread: 34.0% below ¥8,000, 17.5% at ¥8,000–12,000, 14.4% at ¥12,000–18,000, 14.4% at ¥18,000–25,000, and 19.6% at ¥25,000 and above. What matters is that demand backs up those upper bands. In room-level inventory data for Obon 2026 (Aug 13–16), every one of the five properties in the ¥18,000–25,000 band for which Obon inventory could be obtained was observed selling out, and the average remaining-room rate of 9.8% was the lowest of any price band. Rooms are not left unsold as a consequence of higher pricing — this band clears fastest.
In short, Saga demonstrates that an upper-middle price band can work in a regional market, and in Miyazaki that band is empty in its entirety. What follows examines, in order: relative position within Kyushu, location conditions, supply density by price band, positioning on ADR × earliest sellout LT, and the conditions under which an investment can pencil.
Position Within Kyushu’s Seven Prefectures — Miyazaki at the Bottom, Saga Mid-Tier but Correcting
First, where do the two prefectures sit within Kyushu? Averaging estimated settled ADR at the prefectural level over the most recent three months (April–June 2026), Miyazaki comes in at ¥6,432 — the lowest in Kyushu — while Saga at ¥11,075 ranks just behind Fukuoka (¥11,719). Year on year, Fukuoka is the only prefecture in Kyushu showing a clear increase at +9.8%, while Saga has entered a correction at −11.7%.
Saga’s correction is largely a pullback from levels that were pushed up in 2025 by the combined effect of the Nishi-Kyushu Shinkansen opening and recovering travel demand. According to Saga Shimbun, the main ryokan of Ureshino Onsen recorded 44,402 overnight guests at the one-year mark after the Shinkansen opened, up roughly 12,000 from 2019 (32,776), with guests from the Kanto region more than doubling. This is an adjustment from a high baseline; the supply-density analysis below confirms that the tiered price structure itself has not broken down.
Miyazaki is essentially flat at −1.0% year on year. The level is low but volatility is also small, which reads as a market where demand itself is stable. A comparable case elsewhere in Kyushu is central Kagoshima, where a stepped price-band gap likewise opens up between thick business demand and a Sakurajima-view premium.
* Only months with confirmed actuals (through June 2026) are shown. From July onward the figures are estimates based on selling prices listed on OTAs and elsewhere at the time of the survey, and they shift as the check-in date approaches, so they are excluded from trend interpretation.
Location Assessment — Saga City Leads on Business-Demand Depth and Land Price Momentum
To evaluate an empty price band as an investment target, one has to confirm that the location carries the demand base to support it. We compared business concentration in the two prefectural capitals using employment data for a 1 km radius based on the Economic Census.
| Establishments | 1,669 |
| Employees | 21,729 |
| Office-sector share | 18.0% |
| Establishments | 1,613 |
| Employees | 19,577 |
| Office-sector share | 23.9% |
| Saga City, commercial land, rate of change | +10.9% |
| Saga City, top point (Ekimae-Chuo) | ¥346,000/m² (+16.5%) |
| Miyazaki City, commercial land, average | ¥100,103/m² |
| Miyazaki City, commercial land, rate of change | +2.08% |
The two cities are almost identical in business scale, with no major gap in either establishments or employees. Where they diverge is the office-sector share: 23.9% around Saga Station against 18.0% around Miyazaki Station, 5.9 points lower. Saga City is increasingly being absorbed into the Fukuoka metropolitan commuting area, and in the 2026 published land prices its 10.9% rise in commercial land ranked third nationally among prefectural capitals, with the top point at Saga Ekimae-Chuo up 16.5% year on year. Nikkei cites hotel and corporate demand around JR Saga Station as the driver of that increase. On land prices as a leading indicator, Saga City is clearly ahead.
Miyazaki City’s commercial land averages ¥100,103/m², up 2.08% year on year — subdued in both level and growth. With construction costs staying elevated, a lighter land-acquisition burden is one of the few favourable conditions available to a new project.
A note on resort and onsen locations. The 1 km radius around Aoshima (southern Miyazaki City) has an office-sector share of 2.4% and 85 establishments, confirming it as a leisure-only location with essentially no business demand. Central Ureshino Onsen, on the other hand, has no small-area Economic Census data on record, so demand there cannot be described from employment statistics. These onsen and resort locations are assessed using lodging supply-and-demand data in the chapters that follow.
Supply Density by Price Band — 76% of Miyazaki Sits Below ¥8,000
Properties with 10 or more rooms for which an estimated settled ADR could be calculated were tallied by price band. The shape of the distribution is entirely different on each side.
| Estimated settled ADR band | Miyazaki properties | Miyazaki rooms | Saga properties | Saga rooms |
|---|---|---|---|---|
| Under ¥8,000 | 89 | 6,860 | 33 | 2,840 |
| ¥8,000–12,000 | 16 | 1,706 | 17 | 1,450 |
| ¥12,000–18,000 | 7 | 396 | 14 | 574 |
| ¥18,000–25,000 | 0 | 0 | 14 | 501 |
| ¥25,000 and above | 5 | 112 | 19 | 431 |
In Miyazaki, 89 properties and 6,860 rooms cluster below ¥8,000, and the count thins rapidly moving up. The ¥12,000–18,000 band holds 7 properties and 396 rooms, the ¥18,000–25,000 band is empty, and ¥25,000 and above accounts for just 5 properties and 112 rooms. Those five are all small, averaging 22 rooms. In other words, Miyazaki lacks the category of “a property of 20 or more rooms operating at an ADR of around ¥18,000” altogether.
Saga is the opposite: 14 properties at ¥12,000–18,000, 14 properties and 501 rooms at ¥18,000–25,000, and 19 properties at ¥25,000 and above. The onsen towns of Ureshino, Takeo and Tara, together with the seaside locations of Karatsu, form the upper bands. Viewed by municipality, the tiered structure becomes clearer still.
| Prefecture | Municipality | Properties | Rooms | Median estimated settled ADR | Interquartile range |
|---|---|---|---|---|---|
| Saga | Tara | 7 | 125 | ¥25,747 | ¥15,016 – ¥39,208 |
| Saga | Ureshino | 19 | 791 | ¥22,343 | ¥18,717 – ¥29,991 |
| Saga | Karatsu | 19 | 659 | ¥17,539 | ¥6,707 – ¥22,788 |
| Miyazaki | Takachiho | 8 | 259 | ¥14,126 | ¥7,929 – ¥25,973 |
| Saga | Takeo | 10 | 453 | ¥13,920 | ¥7,959 – ¥17,830 |
| Saga | Saga City | 23 | 1,949 | ¥8,884 | ¥7,165 – ¥15,387 |
| Miyazaki | Miyazaki City | 44 | 4,897 | ¥7,074 | ¥5,907 – ¥8,106 |
| Saga | Tosu | 6 | 867 | ¥6,154 | ¥5,678 – ¥7,378 |
| Saga | Imari | 6 | 516 | ¥6,122 | ¥4,876 – ¥6,816 |
| Miyazaki | Hyuga | 6 | 465 | ¥5,917 | ¥5,571 – ¥6,947 |
| Miyazaki | Miyakonojo | 14 | 1,137 | ¥5,851 | ¥4,329 – ¥6,783 |
| Miyazaki | Nobeoka | 16 | 1,201 | ¥5,747 | ¥4,353 – ¥6,957 |
| Miyazaki | Nichinan | 11 | 389 | ¥5,696 | ¥4,311 – ¥12,770 |
| Miyazaki | Ebino | 6 | 204 | ¥5,548 | ¥5,407 – ¥6,459 |
Saga forms a clear five-step hierarchy: Tara ¥25,747, Ureshino ¥22,343, Karatsu ¥17,539, Takeo ¥13,920 and Saga City ¥8,884. In Miyazaki, only Takachiho (¥14,126) exceeds ¥10,000; Miyazaki City ¥7,074, Hyuga ¥5,917, Miyakonojo ¥5,851, Nobeoka ¥5,747 and Nichinan ¥5,696 leave the entire prefecture bunched around ¥6,000.
The interquartile ranges for Nichinan and Takachiho are worth noting. Nichinan has a median of ¥5,696 but a third quartile of ¥12,770, and Takachiho a median of ¥14,126 against a third quartile of ¥25,973 — both stretch widely on the upper side. A small number of properties succeed at high rates, while the layer at that band is thin.
Dense Where supply is already filled
Under ¥8,000 × business locations
89 properties and 6,860 rooms in Miyazaki; 33 properties and 2,840 rooms in Saga. Centred on station-front business hotels in Miyazaki City, Miyakonojo, Nobeoka and Tosu — a zone where a new entrant needs an axis of differentiation other than price.
WS① Upper-midscale business location
¥18,000–25,000 × 20–60 rooms
Zero properties in Miyazaki. In Saga, 14 properties and 501 rooms are viable, with an average remaining-room rate of 9.8% over Obon — the tightest of any band. The strongest candidate gap, backed by business demand in Miyazaki City (21,729 employees).
WS② Mid-scale resort and onsen
¥25,000 and above × 30–60 rooms
Miyazaki’s five qualifying properties skew small at an average of 22 rooms. Nichinan, Aoshima and Takachiho already stretch to around ¥25,000 at the upper quartile, leaving headroom in the 30-plus-room range where economies of scale apply.
Positioning Analysis — Inventory Absorption Does Not Slow as Price Rises
To test whether demand exists in the thin bands, we matched room-level inventory data for Obon 2026 (Aug 13–16) against estimated settled ADR. The scatter plot places estimated settled ADR on the horizontal axis and earliest sellout LT on the vertical axis (the lead time at which remaining rooms first hit zero; a larger value means an earlier sellout), with circle size representing room count. Coverage is limited to properties whose OTA-released allotment is 30% or more of total rooms, yielding 68 properties with 10 or more rooms (27 in Miyazaki, 41 in Saga).
| Estimated settled ADR band | Properties covered | Sellout observed | Median earliest sellout LT | Average remaining-room rate |
|---|---|---|---|---|
| Under ¥8,000 | 31 | 27 (87%) | LT62 | 32.9% |
| ¥8,000–12,000 | 7 | 6 (86%) | LT66 | 24.2% |
| ¥12,000–18,000 | 11 | 11 (100%) | LT47 | 17.8% |
| ¥18,000–25,000 | 5 | 5 (100%) | LT56 | 9.8% |
| ¥25,000 and above | 14 | 11 (79%) | LT58 | 29.5% |
Normally, raising price slows sales. This data shows no such simple inverse relationship. All five properties in the ¥18,000–25,000 band (100%) were observed selling out, and the average remaining-room rate of 9.8% is the lowest of any band. All 11 properties in the ¥12,000–18,000 band were also observed selling out, and their average remaining-room rate of 17.8% is far below the 32.9% of the sub-¥8,000 band.
Put differently, during peak demand in these two prefectures the upper-middle price bands are the ones that sell out first, and price is not acting as a ceiling on demand. Even so, Miyazaki has no properties at all in the ¥18,000–25,000 band, and only 7 in the ¥12,000–18,000 band. The picture is one of supply failing to keep up with bands where demand is demonstrably present.
Sitting at the upper right of the scatter plot is a cluster of properties that combine high rates with early sellouts. Listing the top performers by earliest sellout LT reveals a broad mix across price bands and property types.
| Rank | Property | Prefecture | Type | Rooms | Earliest sellout LT | Days sold out | Estimated settled ADR |
|---|---|---|---|---|---|---|---|
| 1 | 嬉野八十八 | Saga | Ryokan | 36 | LT90 | 4 / 4 | ¥49,403 |
| 2 | Takezaki Kanko Hotel Umezakitei | Saga | Ryokan | 10 | LT90 | 3 / 4 | ¥27,071 |
| 3 | Aoshima Suikoen HOTEL | Miyazaki | Ryokan | 50 | LT90 | 1 / 4 | ¥6,831 |
| 4 | Business Hotel Surfin | Miyazaki | Business hotel | 20 | LT89 | 4 / 4 | ¥4,682 |
| 5 | Business Hotel Rich | Miyazaki | Business hotel | 18 | LT89 | 4 / 4 | ¥4,519 |
| 6 | Kyomachi Kanko Hotel | Miyazaki | Ryokan | 36 | LT89 | 3 / 4 | ¥6,455 |
| 7 | Family Lodge Hatagoya Hyuga-Kadogawa | Miyazaki | Business hotel | 12 | LT89 | 2 / 4 | ¥7,727 |
| 8 | Family Lodge Hatagoya Miyazaki | Miyazaki | Business hotel | 12 | LT89 | 2 / 4 | ¥8,256 |
| 9 | Kitago Onsen Ryokan Beppin-no-Yu Marushinso | Miyazaki | Ryokan | 12 | LT89 | 1 / 4 | ¥13,163 |
| 10 | HOTEL AZ Saga Ogi | Saga | Business hotel | 91 | LT89 | 1 / 4 | ¥5,570 |
| 11 | Karatsu Onsen Ryokan Wataya | Saga | Ryokan | 12 | LT89 | 4 / 4 | ¥23,710 |
| 12 | Tokiwaso — Seasonal Cuisine & Hot Spring Inn | Miyazaki | Ryokan | 23 | LT86 | 1 / 4 | ¥10,672 |
| 13 | Hotel Karae | Saga | Business hotel | 21 | LT84 | 3 / 4 | ¥6,135 |
| 14 | Takachiho Ryokan Shinsen | Miyazaki | Ryokan | 13 | LT81 | 3 / 4 | ¥68,128 |
The top performer, 嬉野八十八 (36 rooms, Ureshino), sits at an estimated settled ADR of ¥49,403 and was observed with zero remaining rooms from LT90 on all four days of Aug 13–16 — meaning its Obon allotment was effectively full three months out. Karatsu Onsen Ryokan Wataya (からつ温泉 旅館 綿屋, 12 rooms, Karatsu) likewise sold out on all four days at LT89 with an estimated settled ADR of ¥23,710 — the single strongest demand signal in the ¥18,000–25,000 band.
On the Miyazaki side, Aoshima Suikoen HOTEL (50 rooms, Aoshima) reached LT90; Kyomachi Kanko Hotel (京町観光ホテル, 36 rooms, Ebino) sold out on three days at LT89; and Takachiho Ryokan Shinsen (高千穂 旅館 神仙, 13 rooms) sold out on three days at LT81 at an estimated settled ADR of ¥68,128. These properties demonstrate that demand capable of sustaining the upper bands does exist in Miyazaki.
Supply–Demand Balance by Property Type — Business-Band Occupancy Above 80% in Both Prefectures
Beyond the peak period, normal-period demand is worth checking too. Estimated occupancy for June 2026 (based on OTA-listed inventory) was tallied by property type.
| Type | Miyazaki properties | Miyazaki rooms | Miyazaki est. OCC | Saga properties | Saga rooms | Saga est. OCC |
|---|---|---|---|---|---|---|
| All properties | 217 | 12,212 | 81.7% | 160 | 6,644 | 85.6% |
| Business hotel | 81 | 7,330 | 81.4% | 41 | 4,042 | 88.0% |
| City hotel | 16 | 1,874 | 90.9% | 8 | 406 | 87.3% |
| Resort hotel | 13 | 1,658 | 69.6% | 7 | 459 | 70.0% |
| Ryokan | 29 | 415 | 77.0% | 72 | 1,597 | 78.4% |
Estimated occupancy in the business hotel band stands at 81.4% in Miyazaki and 88.0% in Saga, both high. Miyazaki’s city hotel band is the highest at 90.9%, running close to sold out despite carrying 1,874 rooms. That level indicates room on the demand side to consider additional supply or a higher rate position.
* Estimated occupancy is an estimate based on absorption of inventory sold on OTAs and differs from a property’s actual overall occupancy. Given the nature of the data collection, days on which observation does not hold are excluded from the tally. Our estimated occupancy also has a short accumulation history, and the published figures of the Japan Tourism Agency’s Overnight Travel Statistics Survey are better suited to evaluating long-run macro occupancy trends.
Recent New Supply — What Is Accumulating Is Small-Scale and Low-Priced
To gauge whether the empty band is likely to fill, we compiled new openings over the past three years. Within the scope of OTA listings confirmed by MetroEngines Research, Miyazaki recorded 24 openings in 2024, 18 in 2025 and 10 in 2026 (as of July), while Saga recorded 9 in 2024, 12 in 2025 and 10 in 2026.
Among projects of 20 or more rooms, Miyazaki saw a concentrated wave in 2024 — HOTEL MYSTAYS Miyazaki (208 rooms), Prince Smart Inn Miyazaki (163 rooms) and Miyazaki Mango Hotel (133 rooms). From 2025 onward the pipeline has been dominated by smaller projects: CABINITY HOTEL Premier Miyazaki (30 rooms), Seagaia Forest Condominium (48 rooms) and its cottages (72 rooms), HOTEL R9 The Yard Ebino (50 rooms), and in 2026 FAV LUX Miyazaki (41 rooms), HOTEL R9 The Yard Shintomi (54 rooms) and HOTEL R9 The Yard Kobayashi-Hosono (41 rooms). In Saga, 七彩ホテル (131 rooms) opened in 2025 and ANA Holiday Inn Tosu (126 rooms) in April 2026.
Miyazaki’s three large 2024 projects were all limited-service, adding further depth to the sub-¥8,000 band. What has been added since 2025 is condominiums, cottages and small hotels; no project has been identified that would fill the ¥18,000–25,000 band at a scale of 20 or more rooms. The empty band is not on track to be filled naturally by the current supply pipeline.
* Counts are based on confirmed OTA listings, and because listings begin several months before opening, figures for the second half of 2026 onward will rise as further listings appear. In planning data based on MLIT’s Building Construction Dynamics Statistics Survey, no qualifying projects had been identified in either prefecture as of the survey date, and the number may increase as additional building confirmation applications are filed.
What Makes the Investment Work — Converting Existing Stock Beats Building New
So what economics would a project that fills this gap actually face? We work backwards from construction cost.
Based on MLIT’s Statistics on Building Construction Starts, 2025 hotel construction costs run to ¥2.405 million per tsubo for steel-frame, ¥2.026 million per tsubo for reinforced concrete, and ¥1.952 million per tsubo across all structures. That is a sharp rise from ¥1.38 million per tsubo in 2022 and has stayed elevated. Assuming 25 m² guest rooms and a guest-room floor ratio of 62% (an upper-midscale assumption), gross floor area per room comes to about 40.3 m² = 12.2 tsubo, which at the 2025 steel-frame unit price puts construction cost per room at roughly ¥29.34 million.
Inflation during the construction period also has to be factored in. Assuming a 2028 opening with the construction midpoint in 2027, compounding at +5.3% (2026) and +5.0% (2027) gives about ¥32.43 million per room; adding 15% for FF&E, design supervision and pre-opening costs brings the figure to roughly ¥37.3 million per room (excluding land).
| Assumed ADR (estimated settled basis) | GOP per room / year | Max investment at 8% yield | Max at 7% | Max at 6% |
|---|---|---|---|---|
| ¥14,000 | ¥1.21M | ¥15.18M | ¥17.34M | ¥20.24M |
| ¥18,000 | ¥1.56M | ¥19.51M | ¥22.30M | ¥26.02M |
| ¥20,000 | ¥1.73M | ¥21.68M | ¥24.78M | ¥28.91M |
| ¥25,000 | ¥2.17M | ¥27.10M | ¥30.97M | ¥36.14M |
| ¥30,000 | ¥2.60M | ¥32.52M | ¥37.17M | ¥43.36M |
The reverse calculation makes one thing plain. To achieve an 8% yield at ADR ¥18,000–20,000 — the empty band — investment per room has to be held to ¥19.51M–¥21.68M. A new build (roughly ¥37.3 million per room excluding land) cannot reach 8% in this band. Targeting the ¥18,000–25,000 band with a new build means either evaluating at the 6% level typical of the long-hold horizon of regional banks and local operating companies, or premising the project on a differentiated product design capable of achieving around ¥30,000 ADR.
Conversely, this empty band is best filled by repositioning through acquisition and renovation of an existing property. An acquisition plus full renovation that stays within total investment of around ¥20 million per room lands inside the 8% yield range at ADR ¥18,000–20,000 and OCC 72% (the full-year modelling assumption). Miyazaki City has a deep pool of 89 properties and 6,860 rooms in the sub-¥8,000 band, and there is ample quantitative room to convert part of it into the upper bands. Approaches such as combining rooms to enlarge floor area, strengthening common areas and food and beverage, and introducing a brand are worth examining as ways to fill the gap while making use of existing stock. On the boundary at which renovation investment outperforms a new build, the relationship between investment per room and the resulting ADR lift is the decisive test.
Soaring construction costs also suppress new supply. With new openings nationwide expected to thin from 2027 onward, the value of existing properties rises in relative terms. In regional markets this works as an upside factor for conversion of existing stock.
Sensitivity Analysis — Resilience to Downside in ADR and Occupancy
| Scenario | GOP per room / year | Max investment at 8% yield | vs. base |
|---|---|---|---|
| Base case (ADR ¥20,000, OCC 72% / full-year basis) | ¥1.73M | ¥21.68M | — |
| ADR −10% (¥18,000) | ¥1.56M | ¥19.51M | −10.0% |
| OCC −5pt (67%) | ¥1.61M | ¥20.18M | −6.9% |
| Both simultaneously | ¥1.45M | ¥18.16M | −16.3% |
Two-Axis Sensitivity — Maximum Investment by Assumed ADR × Occupancy (8% Yield)
| Assumed ADR \ Occupancy | 62% | 67% | 72% | 77% | 82% |
|---|---|---|---|---|---|
| ¥14,000 | 13.07 | 14.12 | 15.18 | 16.23 | 17.28 |
| ¥18,000 | 16.80 | 18.16 | 19.51 | 20.87 | 22.22 |
| ¥20,000 | 18.67 | 20.18 | 21.68 | 23.19 | 24.69 |
| ¥25,000 | 23.34 | 25.22 | 27.10 | 28.98 | 30.87 |
| ¥30,000 | 28.00 | 30.26 | 32.52 | 34.78 | 37.04 |
Viewed on two axes, absorbing the new-build cost (¥37.3M per room) at an 8% yield is limited to a narrow set of combinations — assumed ADR ¥30,000 with occupancy of 77% or above, or ¥25,000 with 82% occupancy. In the empty band of ADR ¥18,000–20,000, even at 82% occupancy the maximum investment tops out at ¥22.22M–¥24.68M per room, out of reach for a new build. Conversely, the ¥20M-per-room benchmark for acquisition plus renovation is reached at roughly 74% occupancy at ADR ¥18,000, or roughly 67% at ADR ¥20,000. Seen on two axes, the variable that makes this band work is acquisition price rather than occupancy.
Even in a combined scenario where ADR falls 10% and occupancy drops 5 points, maximum investment still holds at ¥18.16M per room. Whether acquisition plus renovation of an existing property can be kept within ¥20 million per room is the decision point for investors targeting this gap.
* This modelling is a simplified calculation based on public data; an actual investment decision requires property-level due diligence and a detailed feasibility study.
Caveats — Three Variables to Watch
1. Saga’s ADR correction. Saga’s estimated settled ADR remains in correction at −11.7% year on year. Where the level settles once the demand boost from the Nishi-Kyushu Shinkansen opening has run its course bears directly on investment decisions in the upper bands. That said, the tiered price structure itself is intact and Obon supply–demand remains tight. Adjustment in level and change in structure need to be evaluated separately.
2. Compression of the Miyazaki City market. Miyazaki City’s narrow interquartile range of ¥5,907–8,106 means the market retains substantial room for differentiation on price. At the same time, because no reference price yet exists in the market for an upper-band product, staged market testing is an effective way to prove demand. That the upper quartiles for Nichinan, Aoshima and Takachiho stretch to around ¥25,000 is corroborating evidence that upper-band demand exists within the prefecture.
3. Construction cost and staffing constraints. Construction costs rose 41% in the two years from 2022 and have stayed elevated since. On top of that, securing operating staff in regional markets affects the room-count scale itself. A design that achieves a high rate with a small room count is in fact consistent with staffing constraints, and in that sense the gap identified here (20–60 rooms, ADR ¥18,000–25,000) is a realistic range.
Conclusion
Miyazaki and Saga have prefectural capitals of almost identical business scale, yet the price-band structure of their lodging supply is entirely different. Saga spreads across five tiers from below ¥8,000 to above ¥25,000, with sufficient depth in the upper bands as well. In Miyazaki, 76.1% cluster below ¥8,000 and the ¥18,000–25,000 band has zero properties.
And what the room-level inventory data for Obon 2026 showed is that this empty band is precisely where supply and demand are tightest. All five covered properties in the ¥18,000–25,000 band were observed selling out, and the average remaining-room rate of 9.8% is the lowest of any price band. Demand exists ahead of price.
Entering through a new build is unlikely to reach an 8% yield given the level of construction costs. Converting the thick sub-¥8,000 existing stock in Miyazaki City into the upper-midscale band at around ¥20 million per room, by contrast, is worth examining on both quantitative and economic grounds. For regional developers and local financial institutions, this gap in Miyazaki remains an untouched area on Kyushu’s investment map.
Related Reading
- Construction +41% & Labor Crunch Erase Japan’s 2027-2029 Hotel Supply
- Supply Absorption Capacity in 8 Regional Core Cities — GW2026 Sellout Rate × New Openings
Reference Materials and Sources
■ Data sources
Estimated settled ADR, room-level remaining-inventory trends and estimated occupancy are tallied by MetroEngines Research & Consulting (Miyazaki N=159–167 properties per month; Saga N=145–157 per month). Property-level and municipality-level tallies cover the 214 properties with 10 or more rooms for which an estimated settled ADR could be calculated; the Obon 2026 (Aug 13–16) inventory observations cover a population of 68 properties whose OTA-released allotment is 30% or more of total rooms. Construction costs are from MLIT’s Statistics on Building Construction Starts, land prices from the same ministry’s Published Land Prices (2026), and business concentration from the MIC / METI Economic Census for Business Activity.
■ Modelling assumptions
The business modelling assumes, on a full-year basis, 72% occupancy, a 33% GOP margin and 365 operating days, calculating GOP per room per year = assumed ADR × occupancy × 365 × GOP margin, and maximum investment per room for a target yield = GOP per room per year ÷ target yield. The 33% GOP margin is a conservative figure for a regional upper-midscale property, informed by actuals by property type (limited-service 50–60%, city hotel 10–30%) and GOP results disclosed by J-REITs. Construction cost applies the 2025 steel-frame unit price of ¥2.405 million per tsubo to 25 m² guest rooms with a 62% guest-room floor ratio (12.2 tsubo of gross floor area per room), compounds at +5.3% (2026) and +5.0% (2027) assuming a 2028 opening with a 2027 construction midpoint, and adds 15% for FF&E, design supervision and pre-opening costs, giving roughly ¥37.3 million per room (excluding land). The two-axis sensitivity table is a deterministic calculation substituting five ADR levels × five occupancy levels into the same assumption formula and contains no new observed values.
■ Limitations and caveats
Estimated settled ADR is an estimate derived by applying property-type correction coefficients to OTA published prices and differs from actual transaction prices and accounting figures (median error of approximately 7% when cross-checked against property-level actuals disclosed by listed hotel REITs). Estimated occupancy is a macro estimate based on absorption of OTA sales inventory, differs from a property’s actual overall occupancy, and is tallied excluding days on which observation does not hold. Municipality-level tallies are limited to municipalities with 10 or more rooms and 4 or more properties, so they cannot be compared directly with prefecture-level or area-level figures drawn from a different population. The Obon 2026 inventory observation is a cross-section with a base date of 24 July 2026 and does not reflect subsequent sales activity. The business modelling is a simplified calculation based on public data and is not a substitute for property-level due diligence or a feasibility study.
■ Market data
- MetroEngines Research & Consulting — estimated settled ADR (Miyazaki N=159–167 properties per month; Saga N=145–157 per month), room-level remaining-inventory trends (Obon 2026, N=68 properties), estimated occupancy, property-level and municipality-level tallies (10+ rooms, N=214 properties)
- MetroEngines Research & Consulting (based on confirmed OTA listings) — new openings (Miyazaki: 24 in 2024, 18 in 2025, 10 in 2026 / Saga: 9 in 2024, 12 in 2025, 10 in 2026)
■ Government statistics and public data
- MIC / METI, “Economic Census for Business Activity” (boundaries = 2020 Population Census small areas, e-Stat Statistical GIS)
- MLIT, “Statistics on Building Construction Starts” (hotel construction cost per tsubo)
- MLIT, “Published Land Prices” (2026 / Reiwa 8)
- MLIT, “Building Construction Dynamics Statistics Survey” (hotels in planning)
- Miyazaki Prefecture, “Reiwa 6 Miyazaki Prefecture Tourist Arrivals Statistics Survey Results”
■ Industry data
- Invincible Investment Corporation disclosure materials (GOP results for operated hotels)
- archi-book, “Construction Cost per Tsubo Data, 2025 Edition”
■ News and reporting
- Nikkei, “[Published Land Prices 2026] Saga City commercial land ranks 3rd nationally in growth rate, drawing ‘Fukuoka commuter belt’ demand” (March 2026)
- Saga Shimbun, “Published land prices in Saga Prefecture rise for a fifth straight year across all uses; industrial land up 12%, first nationally, 2026”
- Saga Shimbun, “<One year after the Nishi-Kyushu Shinkansen opening: a changing region> Visitor numbers up at Ureshino Onsen and Takeo Onsen”
- tochidai.info, “Land price market and published land prices for Miyazaki City (2026)”