

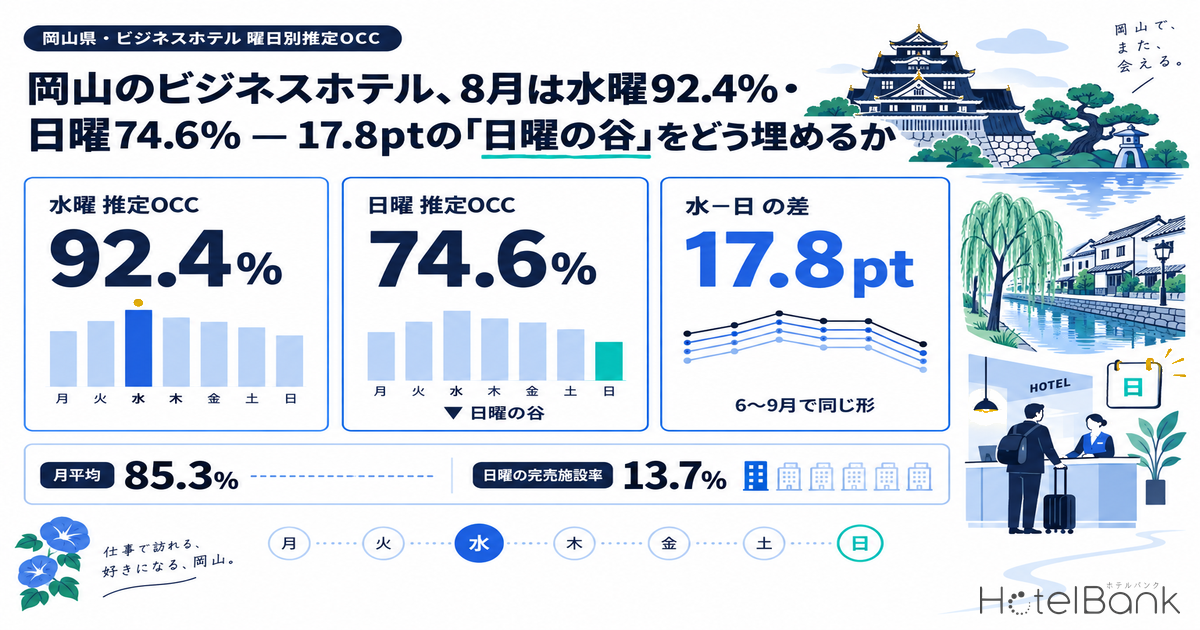
In August 2026, business hotels in Okayama Prefecture posted a monthly average estimated occupancy (OCC, based on OTA-listed inventory) of 85.3%. Inside that single number, however, the level splits sharply by day of week. Wednesday was the highest at 92.4% and Sunday the lowest at 74.6%, a gap of 17.8pt. Recalculating with the entire Obon week (August 10–16) excluded gives Wednesday 93.7% and Sunday 75.8%, a gap of 17.9pt — the pattern does not change at all. This “Sunday trough” is also not an August-only phenomenon: the same shape appears in June, July and the first 20 days of September. This article breaks down estimated OCC by day of week for Okayama business hotels, uses booking-pace snapshots to pin down when and at what stage the trough forms, and then sets out how to rebuild Sunday-night demand.
Scope: Okayama Prefecture, business hotels, N=43–46 properties (mode within the month: 46) / 5,423 rooms (based on listings on major booking sites). Price metrics in this article are the estimated settled ADR (the estimated transaction price level derived from OTA and other sales data, tax-excluded equivalent); occupancy is an estimate based on OTA-listed inventory. Definitions of both are given at the end of the article. Data as of September 20, 2026.
- — Wednesday 92.4%, Sunday 74.6%: a 17.8pt gap. Okayama business hotels averaged 85.3% estimated OCC in August 2026, but the level splits widely once broken out by day of week.
- — Excluding Obon does not change the picture. With August 10–16 excluded, Wednesday is 93.7% and Sunday 75.8%, a 17.9pt gap. Limited to August 17–31, the gap actually widens to 21.5pt.
- — Sunday is the trough in all of the last four months. The gap to Wednesday was 21.6pt in June, 15.7pt in July, 17.8pt in August and 13.7pt in September (1st–20th). This is demand structure, not seasonality.
- — The trough forms in the final 30 days. At 45 days out, Sunday (59.3%) and Wednesday (58.4%) are almost level; the build-up to 30 days out then diverges at +4.7pt for Sunday versus +7.0pt for Wednesday.
- — The lift from pricing has run its course. Estimated settled ADR YoY was −3.9% in June, −0.3% in July and −0.7% in August. Selling Sunday inventory is the remaining headroom.
Splitting 85.3% Estimated OCC (August 2026, N=46 Properties) by Day of Week: Wednesday 92.4%, Sunday 74.6%
We first averaged daily estimated OCC for August 2026 (a completed month, based on settled observations) by day of week. The cohort consists of properties in Okayama Prefecture classified as business hotels that list at least 30% of their total rooms on major booking sites: 43–46 properties over the month (mode: 46), with a modal room count of 5,423.
Source: MetroEngines Research; compiled by HotelBank Editorial Team
The peak falls on Tuesday to Thursday. Wednesday tops out at 92.4%, followed by Tuesday at 89.5% and Thursday at 89.8%; these three days sit clearly above the monthly average of 85.3%. Friday at 85.8% is roughly in line with the average and Saturday at 87.8% slightly above it. Monday at 80.6% and Sunday at 74.6% form the trough. It is a textbook business-travel demand curve: thick from Monday night to Thursday night, thinning on Friday night, recovering on Saturday with leisure and family-visit travel, and at its thinnest on Sunday night.
Because August includes Obon, holiday demand could be distorting the day-of-week averages. We therefore re-ran the same calculation excluding the seven days of Obon week, Monday August 10 to Sunday August 16. The result: Wednesday 93.7% and Sunday 75.8%, a gap of 17.9pt. Removing Obon actually lifts Wednesday and nudges Sunday up slightly. During Obon week the weekdays softened a little — Thursday (8/13) 89.8%, Friday (8/14) 87.4% — while the weekend did not fully fill either — Saturday (8/15) 79.8%, Sunday (8/16) 69.6% — so the week was compressing the day-of-week gap.
Looking only at the 15 days from August 17 to 31, when the cohort size was stable, Wednesday was 92.7% against Sunday 71.2%, a gap of 21.5pt. The closer the calendar moves toward the end of the summer holidays, the wider the divergence between weekdays and Sunday becomes. The monthly high was 97.2% on Saturday August 22 and the low 65.0% on Sunday August 30 — a 32.2pt swing within the same month.
| Day | Est. OCC All of August |
Est. OCC Excl. Obon week |
Est. OCC Aug 17–31 |
Sold-out share All of August |
|---|---|---|---|---|
| Mon | 80.6% | 77.8% | 78.0% | 16.2% |
| Tue | 89.5% | 89.8% | 89.7% | 22.6% |
| Wed | 92.4% | 93.7% | 92.7% | 36.3% |
| Thu | 89.8% | 89.8% | 90.3% | 32.1% |
| Fri | 85.8% | 85.2% | 85.0% | 22.1% |
| Sat | 87.8% | 89.8% | 93.2% | 36.4% |
| Sun | 74.6% | 75.8% | 71.2% | 13.7% |
| Wed − Sun | 17.8pt | 17.9pt | 21.5pt | 22.6pt |
Okayama Prefecture, business hotels, N=43–46 properties / 5,423 rooms (mode). Sold-out share = share of properties with no listed inventory visible on OTAs and other channels (estimate). Source: MetroEngines Research; compiled by HotelBank Editorial Team
The sold-out share in the right-hand column points the same way. On Wednesdays 36.3% of properties and on Saturdays 36.4% had no listed inventory left, versus only 13.7% on Sundays. Excluding Obon week, the spread widens further: 40.4% on Wednesday and 40.6% on Saturday against 14.5% on Sunday. In other words, Wednesday and Saturday were days when roughly four in ten business hotels in the prefecture were sold out, while Sunday was a day when only one property in seven sold out. Across the market as a whole, Sunday inventory tends to be the last to clear.
The Sunday Trough Is Not Unique to August — the Shape Matches Across the Last Four Months
One month of data alone cannot tell us whether a 17.8pt gap is a summer coincidence or a year-round structure. We therefore calculated day-of-week estimated OCC within each recent completed month and overlaid only the shapes. Because the number of properties and rooms in the cohort differs from month to month, the comparison is limited to the day-of-week spread within each month (the shape), not the absolute level.
Okayama Prefecture, business hotels. June N=42–43 properties / July N=42–45 / August N=43–46 / September (1st–20th) N=45–49. Day-of-week averages within each month. Source: MetroEngines Research; compiled by HotelBank Editorial Team
The four lines run almost in parallel. The trough is Sunday without exception, and the gap to Wednesday was 21.6pt in June, 15.7pt in July, 17.8pt in August and 13.7pt in September (1st–20th). The width moves from month to month, but the ordering never breaks: Tuesday to Thursday highest, a dip on Friday, a recovery on Saturday, and the lowest point on Sunday. The natural reading is that Sunday’s trough in Okayama business hotels is not a seasonal effect but the demand structure itself.
Monday also deserves attention. Monday holds steady one step below Tuesday–Thursday, at 80.6% in August, 78.7% in June and 77.5% in July. That means relatively few business trips in Okayama check in on Sunday night to start work Monday morning. The “Sunday trough” therefore does not end with Sunday alone; it shows up as thin demand across a Sunday–Monday two-night block. This is why the measures discussed below should not be designed around Sunday in isolation. Nor is this back-to-back dip on Sunday and Monday unique to Okayama: the same double trough appears in other regional business-hotel markets, including Toyama Prefecture, where estimated OCC was 90.1% on Saturday against 73.9% on Sunday.
When Does the Trough Form? At 45 Days Out, Sunday and Wednesday Are Level
Next we look at booking pace (booking curves) for upcoming stay dates. For a group of Sundays and a group of Wednesdays between late September and early November, we compared how estimated OCC built up from 45 days before arrival to the most recent observation. The framework of reading pace at three points — 45 days out, 30 days out and close-in — is laid out with Okayama data in our Okayama Booking Curves: 3 Checkpoints article.
To state the conclusion first: at 45 days out there is almost no difference between Sunday and Wednesday. The 45-day-out average for six Sundays (9/27, 10/4, 10/11, 10/18, 10/25, 11/1) was 59.3%, and for five Wednesdays (9/30, 10/7, 10/14, 10/21, 10/28) 58.4% — a gap of 0.9pt. At 30 days out, the four-Sunday average of 64.3% is still ahead of the three-Wednesday average of 62.6%. Some of the Sundays fall within holiday weekends (October 11 is the middle day of a three-day weekend ending with Sports Day on Monday October 12), which lifts the Sunday group.
Okayama Prefecture, business hotels, N=46 properties / 5,423 rooms. Observations from 45 days before arrival to the most recent date. Source: MetroEngines Research; compiled by HotelBank Editorial Team
Where the difference opens up is in the size of the build-up between 45 and 30 days out. Over those 15 days the four Sundays added +4.7pt on average and the three Wednesdays +7.0pt — Wednesday is 2.3pt faster. Individually, Wednesday 9/30 built +20.0pt from 53.5% at 45 days out to 73.5% at the latest observation (11 days out), while Sunday 9/27 went from 53.8% to 69.7% (8 days out), +15.9pt. Wednesday 10/7 went from 57.0% to 72.2% (18 days out), +15.2pt, and Sunday 10/4 from 56.2% to 68.9% (15 days out), +12.7pt.
This carries an important practical implication. Sunday inventory is not left over because Sundays have no bookings at 45 days out. The starting line at 45 days is nearly identical; it is the difference in how much builds up over the final 30 days that eventually becomes the 17.8pt gap. Put the other way, if you judge Sunday as “on track” based solely on its 45-day pace, you will miss the close-in stall. It is better to treat Sunday as a day with a different alert threshold, even when its pace matches a weekday.
The Pricing Backdrop — Estimated Settled ADR Is Back to Last Year’s Level
Before turning to day-of-week tactics, it is worth confirming what phase pricing is in for Okayama business hotels. The table below shows year-over-year changes in estimated settled ADR (tax-excluded equivalent), comparing settled values only. Prices are examined monthly only, not by day of week.
| Stay month | 2025 (settled) | 2026 (settled) | YoY |
|---|---|---|---|
| Jan | ¥6,400 | ¥7,000 | +9.7% |
| Feb | ¥6,700 | ¥7,100 | +7.1% |
| Mar | ¥7,100 | ¥7,300 | +3.4% |
| Apr | ¥6,900 | ¥7,000 | +2.2% |
| May | ¥7,400 | ¥7,600 | +2.3% |
| Jun | ¥6,900 | ¥6,700 | −3.9% |
| Jul | ¥7,100 | ¥7,100 | −0.3% |
| Aug | ¥8,000 | ¥7,900 | −0.7% |
Okayama Prefecture, business hotels. Comparison of settled estimated settled ADR values (tax-excluded equivalent). N=95–98 properties in 2025 / 93–97 in 2026. Amounts are rounded to the nearest ¥100; YoY is calculated on unrounded values. Source: MetroEngines Research; compiled by HotelBank Editorial Team
The year opened with strong growth — +9.7% YoY in January and +7.1% in February — but slowed to the +2–3% range from spring, then returned to roughly last year’s level or slightly below: −3.9% in June, −0.3% in July and −0.7% in August. At least in the Okayama business-hotel market, the phase in which rate increases alone could push revenue up appears to have run its course. That is exactly why the 17.8pt gap hidden inside the 85.3% monthly average — Sunday at 74.6% — emerges as the next source of revenue. How Okayama’s estimated settled ADR has diverged by hotel type through the first half is tracked in Okayama City Hotel ADR −23.3% in July, Business +2.8% in H1 2026.
For Revenue Managers Running Business Hotels in Okayama — Implications and Action Plan
Four Points Drawn from the Shape of the Market
(a) Operator insights
1. As long as you look at monthly averages, the Sunday gap stays invisible. August estimated OCC for Okayama business hotels averaged 85.3% — not a bad number. Split by day of week, however, it is Wednesday 92.4% versus Sunday 74.6%. Operating from monthly reports alone lets full days and under-filled days cancel out, so the one day with room to improve becomes structurally invisible. Start by re-cutting your own results at the same granularity, lining up your day-of-week occupancy against the market’s day-of-week estimated OCC, and determining whether your trough is as deep as the market’s or specific to your property.
2. The trough is created in the final 30 days. At 45 days out, Sunday is 59.3% and Wednesday 58.4% — almost identical — yet by 30 days out Sunday has added only +4.7pt against +7.0pt for Wednesday. In other words, even when Sunday passes the 45-day mark at the same pace as a weekday, it should be monitored on the assumption that its subsequent growth will be weaker. Setting a higher pace alert threshold for Sunday alone than for weekdays is an approach worth considering.
3. Sunday and Monday are thin together. Monday too, at 80.6%, sits one step below Tuesday–Thursday (89.5–92.4%). Trying to fill the gap with Sunday-in, Monday-out single nights fills only one soft day. Designing two-night stays — Sunday-in/Tuesday-out, or Saturday-in/Monday-out — addresses the full width of the trough more efficiently.
4. The room to push up via price has run its course. Estimated settled ADR has returned to last year’s level: −3.9% in June, −0.3% in July, −0.7% in August. Annual plans that assume rate increases alone need revisiting; for now, improving RevPAR by “selling the days that aren’t selling” is the more realistic option. Note also that both Okayama City and Kurashiki City are discussing the introduction of an accommodation tax of ¥200 per person per night (see sources below), which could change how the total price appears to guests — something to factor into medium-term pricing design.
Action Plan — Today to This Week / Within Two Weeks / Toward Next Month
Based on the above, the action plan is organized into three time horizons. None of these guarantees results; they are options that assume testing against your own catchment and guest mix.
| Horizon | Action | Decision trigger | Objective |
|---|---|---|---|
| Today to this week | Re-cut your own results into day-of-week occupancy and overlay the market’s day-of-week shape (Wed 92.4% / Sun 74.6%) | If your own Wednesday–Sunday gap is larger than the market’s 17.8pt, suspect property-specific factors first | Separate a “market-level trough” from “your own missed demand” |
| Check pace for the next 4–6 weeks of Sundays at three points: 45 days out, 30 days out and close-in | Flag Sundays whose 45-day level matches the market (Sunday group 59.3%) but whose build-up to 30 days out falls short of the market’s +4.7pt | Identify stalling Sundays before the final three weeks | |
| Within two weeks | Secure inventory and rate-plan allocation in advance for Sunday-arrival two-night stays (two patterns: Sun–Tue and Sat–Mon) | In weeks where Monday is also one step lower (market 80.6%) in addition to Sunday — as soon as it becomes clear single nights will not fill the gap | Absorb two soft nights in a single stay |
| Prepare a “Sunday pre-stay” pitch for corporate and business-travel channels, aimed at Monday-morning meetings and site starts | If your Monday arrivals are clearly fewer than Tuesday–Thursday arrivals (in the market too, Monday at 80.6% is below Tuesday–Thursday at 89.5–92.4%) | Pull existing business-travel demand forward by one night into the bottom of the trough | |
| Toward next month | Place stay-extension offers that carry Saturday leisure demand into Sunday (touring within the prefecture, such as Korakuen Garden and the Kurashiki Bikan Historical Quarter) along the Saturday booking path | In the market, Saturday is 87.8% (93.2% for Aug 17–31) versus Sunday 74.6%. Act if your own property has weeks where Saturday runs high and Sunday drops off | Fill Sunday by extending weekend guests who are already in-house |
| Rebuild the annual rate-revision calendar from a rate-increase premise to a “sell Sunday” premise | If estimated settled ADR continues at last year’s level (−3.9% in June, −0.3% in July, −0.7% in August) | Build RevPAR from the occupancy side rather than relying on rate alone |
Source: MetroEngines Research; compiled by HotelBank Editorial Team
Aiming to lift Sunday through price cuts alone calls for caution. Sunday’s sold-out share is low at 13.7%, meaning inventory remains across the market. Competing with rivals on price does not increase the total volume of demand in the market. Measures that change the shape of the stay — two-night designs, pre-stay pitches and extension paths — have more scope to bring genuinely new demand into the same Sunday.
Summary — Three Yardsticks for Reading Sundays in Okayama
Yardstick 1: Look at day-of-week gaps, not monthly averages. Okayama business hotels averaged 85.3% estimated OCC in August 2026, but inside that sits a 17.8pt gap between Wednesday (92.4%) and Sunday (74.6%). Excluding Obon week it is 17.9pt; for August 17–31 alone, 21.5pt. Monthly figures always dilute the one day that has room to improve.
Yardstick 2: Test whether the trough is a one-month coincidence by checking the shape across several months. The Wednesday–Sunday gap was 21.6pt in June, 15.7pt in July, 17.8pt in August and 13.7pt in September (1st–20th). The width moves; the order does not. Sunday being the trough is not seasonal — it is the structure of business demand in Okayama.
Yardstick 3: Judge by growth from 45 to 30 days out, not by the 45-day level. At 45 days out, Sunday (59.3%) and Wednesday (58.4%) are almost level. By 30 days out, Sunday has added +4.7pt and Wednesday +7.0pt. Sunday is a day that “starts level but doesn’t grow” — a day on which the 45-day pace alone should never be taken as reassurance.
With these three yardsticks in hand, redesign the shape of the stay in three directions: Sunday-arrival two-night stays, Sunday pre-stays ahead of Monday mornings, and extensions from Saturday. In an Okayama business-hotel market where the lift from pricing has run its course, the 17.8pt gap remains the largest untapped source of revenue.
Frequently Asked Questions
Q. Why does occupancy drop only on Sundays at business hotels in Okayama Prefecture?
A. Because business-travel demand is concentrated from Monday night to Thursday night. In August 2026, day-of-week estimated OCC peaked Tuesday–Thursday (Tuesday 89.5%, Wednesday 92.4%, Thursday 89.8%), dipped on Friday (85.8%), recovered on Saturday (87.8%) with leisure and family-visit travel, and hit its low on Sunday (74.6%). Monday, at 80.6%, is also one step below Tuesday–Thursday, so the Sunday trough does not end with Sunday alone.
Q. Is the Sunday trough specific to August (Obon)?
A. No. Recalculating without the seven days of Obon week (August 10–16) still gives Wednesday 93.7% and Sunday 75.8%, a 17.9pt gap, and for the 15 days from August 17 to 31 the gap actually widens to 21.5pt. The Wednesday–Sunday gap was 21.6pt in June 2026, 15.7pt in July, 17.8pt in August and 13.7pt in September (1st–20th) — the same ordering in all of the last four months.
Q. How can I tell whether my hotel’s Sundays are “in line with the market” or “missed demand”?
A. The starting point is to re-cut your own results by day of week at the same granularity and compare your Wednesday–Sunday gap with the market’s 17.8pt. If your gap is larger than 17.8pt, suspect property-specific factors first; if it is about the same, treat it as an area-wide demand-structure issue and consider stay-design measures such as multi-night stays, pre-stays and extensions.
Q. If Sunday’s booking pace at 45 days out matches weekdays, can I assume it is on track?
A. Not necessarily. For stay dates from late September to early November 2026, estimated OCC at 45 days out was almost the same for the Sunday group (six-day average) at 59.3% and the Wednesday group (five-day average) at 58.4%, but the build-up to 30 days out diverged at +4.7pt for Sunday versus +7.0pt for Wednesday. In practice, it makes sense to set a higher alert threshold for Sunday than for weekdays even at the same pace.
Q. Are rate cuts effective for filling Sundays?
A. They call for careful judgment. Sunday’s sold-out share is 13.7% (Wednesday 36.3%, Saturday 36.4%), meaning inventory remains across the area. Competing on price does not increase total market demand. Measures that change the shape of the stay — Sunday-arrival two-night stays, Sunday pre-stays ahead of Monday mornings, and extensions from Saturday — have more scope to bring in new demand.
About the Data
Definition of estimated OCC (based on OTA-listed inventory): OTA-listed-inventory occupancy = 100 − 100 × OTA-listed rooms remaining ÷ total rooms. The cohort is a fixed set of properties that list at least 30% of their total rooms on OTAs (the same set of properties for each stay date, with that count shown as N). It is an estimate based on how OTA-sold inventory is absorbed and differs in definition from actual room occupancy (rooms not listed are counted on the sold side, so it tends to read high). This article refers to it as “estimated OCC (based on OTA-listed inventory)”.
Booking curves: Based on observations from 45 days before arrival to the most recent date.
Definition of estimated settled ADR: The estimated transaction price level (tax-excluded equivalent) derived from OTA and other sales data (lowest-plan price level × hotel-type coefficient, ensembled across multiple channels). Past months are settled values; current and future months are estimates based on current sales. Median error against published operating results is 6.6%. This article uses settled months only and does not directly compare settled values with current estimates.
Breakdown of N: Estimated OCC = Okayama Prefecture business hotels: June 2026 N=42–43 properties, July N=42–45, August N=43–46 (mode 46, 5,423 rooms), September (1st–20th) N=45–49. Booking-pace snapshots: N=46 properties / 5,423 rooms (based on listings on major booking sites). Estimated settled ADR = Okayama Prefecture business hotels: 2025 N=95–98 properties, 2026 N=93–97. Day-of-week figures are simple averages for each weekday (4–5 days per weekday for June–August; 2–3 days per weekday for September, which covers the 1st–20th only).
Data as of: September 20, 2026. Sales conditions and inventory change daily, so the figures in this article are a snapshot at the time of retrieval.
References and Sources
■ Data sources
Day-of-week estimated OCC, sold-out share and booking pace come from listed-inventory data on major booking sites collected by MetroEngines Research (Okayama Prefecture, business hotels; daily observations from June 1 to September 20, 2026, and observations from 45 days before arrival for check-ins from September 27 to November 1, 2026; N=42–49 properties, 5,423 rooms). Estimated settled ADR is a monthly series estimated from the same company’s sales data (2025 N=95–98 properties / 2026 N=93–97 properties, settled months only). The status of the accommodation tax is based on public information from Okayama City, Kurashiki City and news media; public holidays are based on the Cabinet Office’s “About National Holidays”.
■ Calculation assumptions
Day-of-week values are simple averages of daily estimated OCC by weekday within each month (4–5 days per weekday for June–August 2026; 2–3 days per weekday for September, which covers the 1st–20th only). Obon week is defined as the seven days from August 10 to 16, and figures excluding it are shown alongside. Booking pace uses lead times of 45 days or less only; the 45-day and 30-day averages are calculated only for stay dates with observations at that point (Sundays: six dates at 45 days, four at 30 days; Wednesdays: five dates at 45 days, three at 30 days). YoY for estimated settled ADR is calculated on values before rounding to ¥100. Day-of-week prices are not covered.
■ Limitations and caveats
Estimated OCC is an estimate based on the absorption of listed inventory and differs in definition from actual room occupancy (rooms not listed are counted on the sold side, so it tends to read high). Because the number of properties covered varies by day, comparisons across months should be read as the day-of-week spread (shape) within each month, not as levels. September 2026 covers only the 20 days from the 1st to the 20th. Median error of estimated settled ADR against published operating results is 6.6%. Figures in this article are a snapshot as of September 20, 2026 and do not guarantee future occupancy or prices.
• Kurashiki City drafts accommodation tax ordinance at ¥200 per person per night, opens public comment (KSB Setonaikai Broadcasting, July 3, 2026; Japanese)
• Okayama City to submit ordinance introducing accommodation tax of ¥200 per person per night, expecting about ¥280 million in annual revenue (KSB Setonaikai Broadcasting / Yahoo! News, August 25, 2026; Japanese)
• Accommodation taxes in Okayama, Kurashiki and Izumo (Shimane): ¥200 for stays of ¥5,000 or more per night (Nikkei; Japanese)
• About National Holidays (Cabinet Office; Japanese)
• Okayama City / Kurashiki City
At the time of writing, both cities’ accommodation taxes are still in the procedural stage toward introduction, and the start date and design may change. Please check each city’s latest public information.
Related Reading
- Okayama Booking Curves: 3 Checkpoints, Aug 8 Late-Surges +11.8pt
- Okayama City Hotel ADR −23.3% in July, Business +2.8% in H1 2026
- Saitama Business Hotels: Sat 77.2% vs Sun 70.1%, Gap Widens to 11pt
- Aichi Day-of-Week OCC: Sunday 12.6pt Below Saturday on 92-Day Data
- Hokkaido Business Hotels Aren’t Weekend-Led: Thu 95.4% Ties Sat 95.4%