

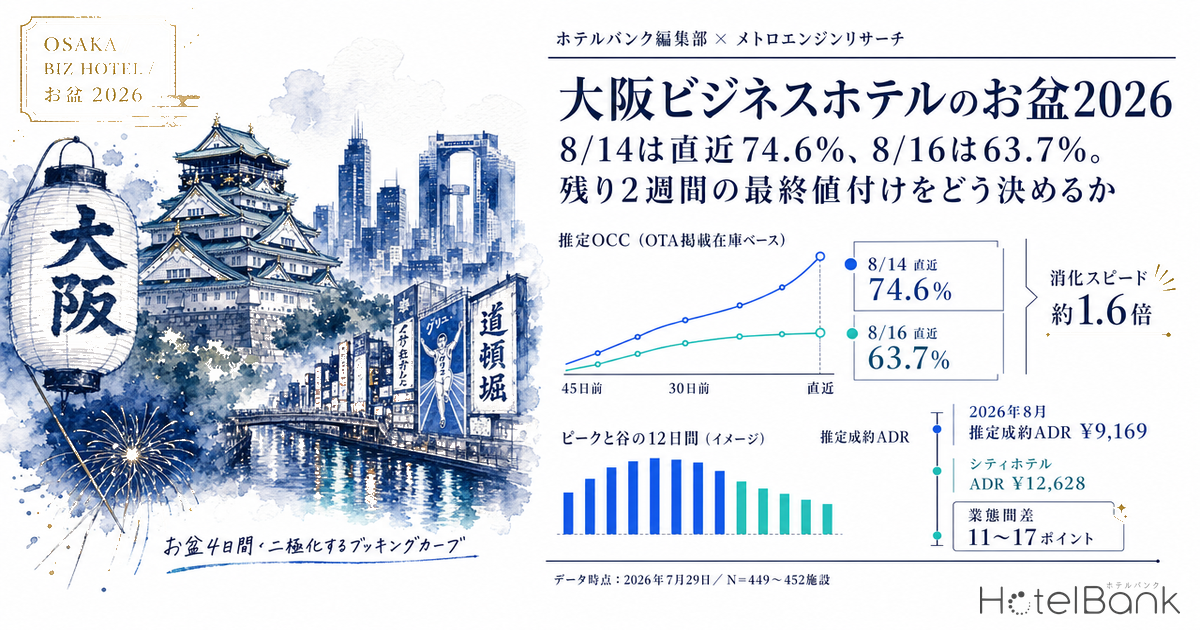
For business hotels in Osaka, the Obon 2026 selling season has become a different battle on each individual date. Observing from 45 days before the stay date through to the latest reading, estimated OCC (based on OTA-listed inventory) for Friday, August 14 built up from 66.4% at 45 days out to 70.2% at 30 days out and 74.6% at the latest reading, while Sunday, August 16 has moved only from 58.6% to 61.7% to 63.7%. The gain from 45 days out to the latest reading is +8.2 points for August 14 but only +5.1 points for August 16 — within the same “Obon” period, the pace of inventory absorption differs by roughly 1.6 times. City hotels on the same dates have reached 86.1% on August 14 and 81.0% even on August 16, putting the gap between the two categories at 11 to 17 points. As a pricing yardstick, the estimated settled ADR for August 2026 is ¥9,169 (N=487 properties) for business hotels and ¥12,628 (N=96 properties) for city hotels. This article reads the final pricing needed to fill the remaining two weeks — and the level below which a discount can no longer be recovered — from these three observation points.
About the data in this article — Scope: business hotels in Osaka, N=449–452 properties (approx. 73,000 rooms), with city hotels (N=91 properties, 24,219 rooms) as a comparison set. Price metrics in this article are estimated settled ADR (the settled price level estimated from OTA and other sales data, tax-exclusive equivalent); occupancy is an estimate based on OTA-listed inventory. Definitions for both appear at the end of the article. Data as of July 29, 2026.
- — August 14 stands at 74.6% and August 16 at 63.7% in the latest reading. Within the same “Obon” period, inventory absorption at Osaka business hotels differs by 10.9 points (observed July 27, 2026; N=448–452 properties).
- — The divergence appears after the 30-day mark. From 45 days out to 30 days out, all four dates gained a similar +3.1 to +3.8 points; from 30 days out to the latest reading, August 13 added +5.5 and August 14 +4.4, while August 15 slowed to +3.2 and August 16 to +2.0 points.
- — August 16 falls within Obon on the calendar, but the market treats it as a post-Obon weekday. Its latest reading of 63.7% sits inside the 61.2% (August 17) to 66.6% (August 21) band, and Saturday, August 22 at 71.9% exceeds August 15 at 69.7%.
- — Estimated settled ADR for August 2026 is ¥9,169 for business hotels (N=487 properties) and ¥12,628 for city hotels (N=96 properties). For confirmed months, the year-on-year decline has widened to -32.8% in June 2026 — but April through October 2025 fell within the Expo period, making that comparison base unusual.
- — A 10% price cut only breaks even with a +7.1 point gain in occupancy. This follows from the identity RevPAR = ADR × occupancy applied to the ¥9,169 and 63.7% figures used in this article, and it gives you a basis for setting the maximum discount before you start cutting.
Booking curves across the four Obon days — three fixed points at 45 days, 30 days and the latest reading
We begin with business hotels in Osaka (N=449–452 properties), taking the four days from Thursday, August 13 to Sunday, August 16, 2026, and cutting each of them at three fixed points: 45 days before the stay date, 30 days before, and the latest reading. Every latest-reading cross-section is from the July 27, 2026 observation, which corresponds to 17 to 20 days remaining before each stay date.
The results split clearly into two groups. August 13 and 14 were already at high levels of 64.0% and 66.4% at the 45-day mark, and added a further +9.3 and +8.2 points to reach 73.3% and 74.6% in the latest reading. By contrast, Saturday, August 15 started at 63.2% and added only +6.5 points, and Sunday, August 16 started at 58.6% and added only +5.1 points. The pattern is direct — the lower a date starts, the smaller its subsequent gain — and the latter two days show no sign of “catching up late” on an early shortfall.
Source: compiled by the HotelBank Editorial Team from MetroEngines Research data
Splitting the timeline further makes the difference in character sharper still. Over the 15 days from 45 days out to 30 days out, the gains were +3.8 points for August 13, +3.8 for August 14, +3.3 for August 15 and +3.1 for August 16 — essentially level across all four days. The divergence came afterwards. From 30 days out to the latest reading, August 13 accelerated to +5.5 points and August 14 to +4.4 points, while August 15 decelerated to +3.2 points and August 16 to +2.0 points. Growth over the most recent two weeks has more than halved — that is the real picture for August 15 and 16.
| Stay date | 45 days out | 30 days out | Latest | 45 days → latest | 30 days → latest | Share of properties with no confirmable listed inventory (latest, estimated) |
|---|---|---|---|---|---|---|
| Thu, August 13 | 64.0% | 67.8% | 73.3% | +9.3pt | +5.5pt | 4.0% |
| Fri, August 14 | 66.4% | 70.2% | 74.6% | +8.2pt | +4.4pt | 7.5% |
| Sat, August 15 | 63.2% | 66.5% | 69.7% | +6.5pt | +3.2pt | 3.1% |
| Sun, August 16 | 58.6% | 61.7% | 63.7% | +5.1pt | +2.0pt | 1.1% |
Osaka business hotels, N=449–452 properties. Latest cross-section observed July 27, 2026 (17–20 days remaining). Source: compiled by the HotelBank Editorial Team from MetroEngines Research data
The “share of properties with no confirmable listed inventory” — the estimated proportion of properties whose inventory can no longer be confirmed on OTAs and other channels, meaning in practice that they have no allocation left to sell — also corroborates the character of each date. In the latest cross-section, August 14 is the highest of the four Obon days at 7.5%, while August 16 sits at just 1.1%. August 14 is not only high in overall market terms; a meaningful number of properties have already sold out their allocation. On August 16, by contrast, almost every property in the market is still holding inventory.
Across the 12 days around Obon, the peak is August 13–14 and the trough is August 16–17
Looking only at the four Obon days will lead you to misread the overall structure. The chart below places the 45-day cross-section alongside the latest cross-section (again observed July 27, 2026, with 15 to 26 days remaining) for the 12 days from Tuesday, August 11 to Saturday, August 22, using the same business hotel population.
Source: compiled by the HotelBank Editorial Team from MetroEngines Research data
In the latest cross-section, the peak is August 14 at 74.6%, followed by August 13 at 73.3%, Saturday, August 22 at 71.9% and Tuesday, August 11 at 71.3%. At the other end, the lowest is Monday, August 17 at 61.2%, followed by Sunday, August 16 at 63.7% and Tuesday, August 18 at 63.8%. In other words, in the Osaka business hotel market, the Obon demand peak is concentrated in the two days of August 13 and 14, eases rapidly from the 15th, and bottoms out across August 16 to 18. The structure is a gap that opens once homecoming and leisure demand has drained away but before ordinary business demand has fully returned.
What deserves attention is that while the latest cross-section for the post-Obon weekdays (August 17 to 21) runs from 61.2% to 66.6%, August 16 at 63.7% sits almost exactly in the middle of that band. August 16 may be “Obon” on the calendar, but in terms of market inventory absorption it is being treated the same as an ordinary post-Obon weekday. Meanwhile Saturday, August 22 at 71.9% in the latest reading exceeds Obon’s August 15 (69.7%) — absorption is further along on the “post-Obon Saturday” than on the “Obon Saturday.” Estimating demand purely from how the day of the week overlaps with the calendar will cause you to miss this reversal.
The 11 to 17 point gap against city hotels — the same date fills differently
Even within Osaka and on the same stay date, changing category changes the picture entirely. For city hotels (N=91 properties, 24,219 rooms), estimated OCC at the 45-day mark is already close to where business hotels stand in their latest reading.
| Stay date | Business, 45 days out | Business, latest | City, 45 days out | City, latest | Gap in latest reading |
|---|---|---|---|---|---|
| Thu, August 13 | 64.0% | 73.3% | 80.9% | 86.2% | 12.9pt |
| Fri, August 14 | 66.4% | 74.6% | 80.7% | 86.1% | 11.5pt |
| Sat, August 15 | 63.2% | 69.7% | 79.2% | 84.1% | 14.4pt |
| Sun, August 16 | 58.6% | 63.7% | 77.5% | 81.0% | 17.3pt |
Osaka: business hotels N=449–452 properties / city hotels N=91 properties. Latest cross-section observed July 27, 2026. Source: compiled by the HotelBank Editorial Team from MetroEngines Research data
The narrowest gap falls on August 14, the demand peak (11.5 points); the widest falls on August 16, the trough (17.3 points). The softer the demand on a given date, the wider the gap between business hotels and city hotels. City hotels’ gains from the 45-day mark are also smaller — +5.3 points on August 13, +5.4 on the 14th, +4.9 on the 15th and +3.5 on the 16th — against business hotels’ +9.3 to +5.1 points. City hotels, in other words, lock in a high level early and add gradually as the date approaches, while business hotels start low and chase in the final stretch: the shape of the curve itself is different. When you benchmark your own curve against the market, note that which of these two shapes you compare against will change your conclusion.
The pricing yardstick — where estimated settled ADR sits in 2026
You cannot set pricing by looking at inventory progress alone. Estimated settled ADR for Osaka business hotels (the settled price level estimated from OTA and other sales data, tax-exclusive equivalent) stands at ¥9,169 (N=487 properties) for August 2026. This is, however, an estimate based on current sales conditions and may move with selling activity through the end of the month. For the same month, city hotels are at ¥12,628 (N=96 properties), putting the gap between categories at roughly ¥3,500.
Osaka business hotels. Solid line = confirmed values; dotted line = estimates based on current sales conditions. Source: compiled by the HotelBank Editorial Team from MetroEngines Research data
Viewed year over year, the 2026 level has stepped down sharply from 2025. Comparing confirmed values against confirmed values, January 2026 was ¥9,144 (N=496), roughly flat at +3.9% year on year, but February came in at -11.1%, March -8.9%, April -23.8%, May -27.5%, and the most recent confirmed month, June 2026, was ¥7,884 (N=495), a decline of -32.8% year on year — the drop widening month by month. As background, the Expo 2025 Osaka, Kansai ran from April 13 to October 13, 2025, so the comparison base from April 2025 onward is unusually high, and that needs to be kept in view. On the same confirmed-value basis, city hotels have also stepped down — April 2026 -18.1%, May -16.6%, June -26.3% — placing both categories in a pullback phase from the elevated levels of the prior year. How much of this pullback is the fading of the Expo premium and how much reflects the underlying trend cannot be separated from year-on-year figures alone; the April-to-October 2025 base should be treated as an outlier rather than a normal benchmark.
With that in mind, the estimated settled ADR for August 2026 (current estimate) of ¥9,169 is above the ¥7,884 of the confirmed month of June 2026 and roughly on a par with January’s ¥9,144. The confirmed value for August 2025 was ¥13,211 (N=499), but you cannot speak of an increase or decrease by simply comparing a current estimate against a confirmed value. Evaluating those two side by side requires waiting for the month to close. In practice, the safer way to gauge where August sits is a relative comparison against your own property’s other months in 2026 — that is, how far above February (confirmed ¥8,430) and June (confirmed ¥7,884), the troughs of the year, August manages to stand.
For revenue managers running business hotels in Osaka — implications and an action plan
1. Are you pricing Obon as a single four-day block? In the latest cross-section, August 14 is at 74.6% and August 16 at 63.7% — a 10.9 point spread. August 16 also falls inside the post-Obon weekday band (61.2% on August 17 through 66.6% on August 21), meaning the market is not treating August 16 as an Obon demand date. The first thing to check on your own calendar is whether your inventory and pricing policy is differentiated date by date.
2. The assumption that “a slow start recovers at the last minute” is unlikely to hold for the latter two days this year. From 45 days out to 30 days out, all four dates gained a near-identical +3.1 to +3.8 points, but from 30 days out to the latest reading, August 13 added +5.5 points and August 14 +4.4, while August 15 slowed to +3.2 and August 16 to +2.0. For dates where deceleration is already observable, whether to keep holding an aggressive remaining-allocation setting premised on a late surge deserves careful judgment. It is also worth remembering that prices seen close to the stay date are not a clean read on the market level: what is still on sale at the last minute is leftover inventory, so an apparently low price near the date can reflect the mix of rooms that remain rather than a market-wide discount.
3. Measure the level below which a cut cannot be recovered by the distance from market ADR. The market’s estimated settled ADR for August 2026 is ¥9,169 for business hotels (current estimate, N=487). If your own August setting sits well below that and inventory is still unsold, the problem may not be price but how the inventory is being released or how it appears on the sales side. Conversely, on dates that will not fill even after cutting well below the market level, you may already be in territory where the incremental volume does not outweigh the rate erosion. Before cutting, put the “incremental revenue if every remaining room on this date sells” next to the “effect of lowering the rate on bookings already on the books” and look at them together.
4. Read the gap against city hotels as a difference in shape, not a gap you can capture. City hotels start from a high 77.5% to 80.9% at 45 days out and add +3.5 to +5.4 points through the latest reading. Business hotels build +5.1 to +9.3 points from a base of 58.6% to 66.4%. Set your benchmark at the city hotel level and your own curve will always look like it is “running behind.” Aligning the comparison to same-category curves is the practical choice.
Pulling the above together by time horizon gives the following.
| Time horizon | Action | Decision trigger (tied to figures in this article) | Objective |
|---|---|---|---|
| Today to this week | Break August 13–16 into individual days and re-sort your own booking pace date by date | The market’s latest cross-section is Aug 13 = 73.3%, Aug 14 = 74.6%, Aug 15 = 69.7%, Aug 16 = 63.7%. If you are running the same price and the same inventory policy across all dates, there is room to revisit it | Separate the peak (13th–14th) from the trough (16th) |
| Today to this week | For remaining allocation on August 14, check whether you are holding inventory in the upper rate bands | Aug 14 has the highest share of properties with no confirmable listed inventory of the four days at 7.5%, and the highest market level | Avoid leaving low-rate inventory on the strongest demand date |
| Within two weeks (up to the stay date) | For August 15–16, set the maximum discount first, then adjust in stages | Estimated settled ADR for August 2026 is ¥9,169 (current estimate). If nothing moves until you go far below that, recalculate the incremental revenue available | Avoid discounts that cannot be recovered |
| Within two weeks | Rebuild inventory and pricing for August 16 as “the first post-Obon weekday” rather than as Obon | Aug 16’s latest reading of 63.7% sits inside the band from Aug 17 (61.2%) to Aug 21 (66.6%) | Remove aggressive settings driven by calendar assumptions |
| Looking to next month | Build the weekends from Saturday, August 22 onward separately from the Obon period | Aug 22’s latest reading of 71.9% exceeds Aug 15 (69.7%) | Avoid missing post-Obon weekend demand |
| Looking to next month | Shift to managing your 2026 ADR trajectory by its month-by-month position within the year rather than by year-on-year comparison | Year-on-year declines on confirmed values are widening: April -23.8%, May -27.5%, June -32.8%. April to October 2025 fell within the Expo period, making the comparison base unusual | Prevent excessive discounting driven by the year-on-year drop |
Source: compiled by the HotelBank Editorial Team from MetroEngines Research data
How many points of occupancy does a discount need to pay for itself — RevPAR sensitivity
This article has argued so far that there is a level below which a discount cannot be recovered, and that breakeven point can be set arithmetically. Because RevPAR (revenue per available room) is determined by the identity ADR × occupancy, placing the discount rate and the resulting gain in occupancy on two axes uniquely determines the point beyond which a cut no longer pays.
The reference point is the two figures confirmed in this article: the estimated settled ADR for Osaka business hotels in August 2026 of ¥9,169 (N=487 properties, current estimate), and the latest estimated OCC for the demand trough of Sunday, August 16 of 63.7% (observed July 27, 2026). That combination gives a RevPAR of ¥5,841, and every increase or decrease below is measured against that level.
RevPAR by discount rate × occupancy gain — a 5×5 grid
| Discount rate Set ADR | +0pt 63.7% | +2pt 65.7% | +4pt 67.7% | +6pt 69.7% | +8pt 71.7% | Gain required to break even |
|---|---|---|---|---|---|---|
| +0% ¥9,169 | ¥5,841 +0.0% | ¥6,024 +3.1% | ¥6,207 +6.3% | ¥6,391 +9.4% | ¥6,574 +12.6% | — |
| -5% ¥8,711 | ¥5,549 -5.0% | ¥5,723 -2.0% | ¥5,897 +1.0% | ¥6,071 +3.9% | ¥6,245 +6.9% | +3.4pt |
| -10% ¥8,252 | ¥5,257 -10.0% | ¥5,422 -7.2% | ¥5,587 -4.3% | ¥5,752 -1.5% | ¥5,917 +1.3% | +7.1pt |
| -15% ¥7,794 | ¥4,965 -15.0% | ¥5,120 -12.3% | ¥5,276 -9.7% | ¥5,432 -7.0% | ¥5,588 -4.3% | +11.2pt |
| -20% ¥7,335 | ¥4,673 -20.0% | ¥4,819 -17.5% | ¥4,966 -15.0% | ¥5,113 -12.5% | ¥5,259 -10.0% | +15.9pt |
The reading is straightforward. A 5% cut needs +3.4 points, a 10% cut +7.1 points, a 15% cut +11.2 points and a 20% cut +15.9 points of additional occupancy before RevPAR returns to its original level. From August 16’s latest reading of 63.7%, +15.9 points means 79.6% — approaching the 81.0% of city hotels, the most heavily absorbed segment on that same date. A 20% discount, in other words, cannot be recovered unless you assume absorption beyond what your own category achieves.
Three scenarios based on a 10% cut
| Case | Set ADR | Occupancy reached | RevPAR | vs. reference |
|---|---|---|---|---|
| Pessimistic (weak response) | ¥8,252 (-10%) | 65.7% (+2pt) | ¥5,422 | -7.2% |
| Mid case (breakeven) | ¥8,252 (-10%) | 70.8% (+7.1pt) | ¥5,842 | +0.0% |
| Optimistic (strong response) | ¥8,252 (-10%) | 75.7% (+12pt) | ¥6,247 | +7.0% |
The optimistic case’s 75.7% exceeds the market level of 74.6% on August 14, the strongest demand date of Obon. That amounts to assuming a single property generating better absorption on August 16, the trough, than the market achieves on its peak day — hard to call realistic. The pessimistic case (+2 points), meanwhile, comes out at -7.2% on RevPAR. In practice, the discounting decision is better reframed from “will cutting fill the rooms?” to “can +7.1 points of additional occupancy physically be achieved given the remaining room mix on that date?”
The figures in this section are identity-based calculations using only the two values stated in this article — estimated settled ADR of ¥9,169 and estimated OCC of 63.7%. The occupancy gains are placeholders used to show sensitivity and are not forecasts of future demand or booking activity. The effect of lowering the rate on bookings already on the books (dilution) is not included in this section’s calculations.
Summary — three yardsticks for reading the final two weeks
Yardstick 1: watch the slope from 30 days out, not the starting level. From 45 days out to 30 days out, the gains for August 13–16 were +3.1 to +3.8 points, with almost no difference between them. The divergence came after the 30-day mark: +5.5 points for August 13 and +4.4 for August 14, against +3.2 for the 15th and +2.0 for the 16th. The relative strength of a date shows up in its slope near the end.
Yardstick 2: classify dates by inventory absorption, not by the calendar. Sunday, August 16’s latest reading of 63.7% sits in the same band as the post-Obon weekdays of August 17 (61.2%) through August 21 (66.6%). Meanwhile post-Obon Saturday, August 22, at 71.9%, exceeds Obon’s August 15 (69.7%). In the Osaka business hotel market, the equation “Obon = high demand” applies only to the 13th and 14th. The post-Obon second half of August therefore deserves to be planned on its own inventory read, date by date, rather than being treated as a single low-demand block.
Yardstick 3: set the discount ceiling by the distance from market ADR. Estimated settled ADR for August 2026 is ¥9,169 for business hotels (current estimate, N=487) and ¥12,628 for city hotels (N=96). A date that will not move unless you price far away from that level may already be in territory where a cut cannot be recovered. Precisely because year-on-year comparisons have widened to -32.8% (June 2026, confirmed value), it is worth fixing the maximum discount before you begin operating.
Metric Definitions Used in This Article
- Definition of estimated OCC (based on OTA-listed inventory): OTA-listed-inventory-based occupancy = 100 − 100 × rooms remaining on OTA listings ÷ total rooms. This is an estimate based on how inventory offered for sale on OTAs is being absorbed; it is defined differently from actual room occupancy and reads higher.
- Booking curve: based on observations from 45 days before the stay date through to the latest reading.
- Definition of estimated settled ADR: the settled price level (tax-exclusive equivalent) estimated from OTA and other sales data (lowest-plan level × category-specific coefficients, ensembled across multiple channels). Past months are confirmed values; the current and future months are estimates based on current sales conditions. Median error against published operating results is 6.6%.
- Scope breakdown: booking curves cover business hotels in Osaka, N=449–452 properties (72,722–73,407 total rooms), and city hotels, N=91 properties (24,219 rooms). Estimated settled ADR covers Osaka business hotels N=487–503 properties and Osaka city hotels N=89–96 properties (both varying by month). All latest cross-sections are from the July 27, 2026 observation (target month: August 2026).
- Data as of July 29, 2026. Because sales conditions and inventory change daily, the figures in this article are a snapshot at the time of retrieval.
References and Sources
- EXPO 2025 Osaka, Kansai, Japan official website, “Event Overview” (period: April 13 – October 13, 2025)
■ Data sources
Inventory progress (estimated OCC) comes from MetroEngines Research aggregated data, which observes OTA-listed inventory by stay date on a daily basis for business hotels and city hotels in Osaka. Scope is Osaka business hotels N=448–452 properties (72,722–73,407 total rooms) and city hotels N=91 properties (24,219 rooms), with all latest cross-sections from the July 27, 2026 observation. Pricing (estimated settled ADR) comes from the same firm’s monthly area aggregation, covering Osaka business hotels N=487–503 properties and Osaka city hotels N=89–96 properties. The Expo period follows the “Event Overview” page of the EXPO 2025 Osaka, Kansai, Japan official website.
■ Calculation assumptions
Estimated OCC is calculated as “100 − 100 × rooms remaining on OTA listings ÷ total rooms” and represents how inventory offered for sale on OTAs is being absorbed. It is defined differently from actual room occupancy and reads higher. Estimated settled ADR is the settled price level (tax-exclusive equivalent) estimated from OTA and other sales data (lowest-plan level × category-specific coefficients, ensembled across multiple channels); past months are confirmed values and the current and future months are estimates based on current sales conditions. The section on how many points of occupancy a discount needs substitutes only the two values stated in this article — estimated settled ADR of ¥9,169 and estimated OCC of 63.7% — into the identity RevPAR = ADR × occupancy, and the occupancy gains are placeholders used to show sensitivity. Year-on-year comparisons are restricted to confirmed values against confirmed values.
■ Limitations and caveats
Both estimated OCC and estimated settled ADR are snapshots at the time of observation, and sales conditions and inventory change daily. The median error of estimated settled ADR against published operating results is 6.6%, and a current estimate cannot be compared directly against a confirmed value to discuss an increase or decrease. On year-on-year comparisons, note that April 13 – October 13, 2025 fell within the Expo 2025 Osaka, Kansai period, making the comparison base unusually high. The sensitivity section does not incorporate rate dilution on existing bookings, distribution commissions, or the day-by-day mix of remaining rooms, so in actual decision-making it should be evaluated alongside your own property’s booking detail.