

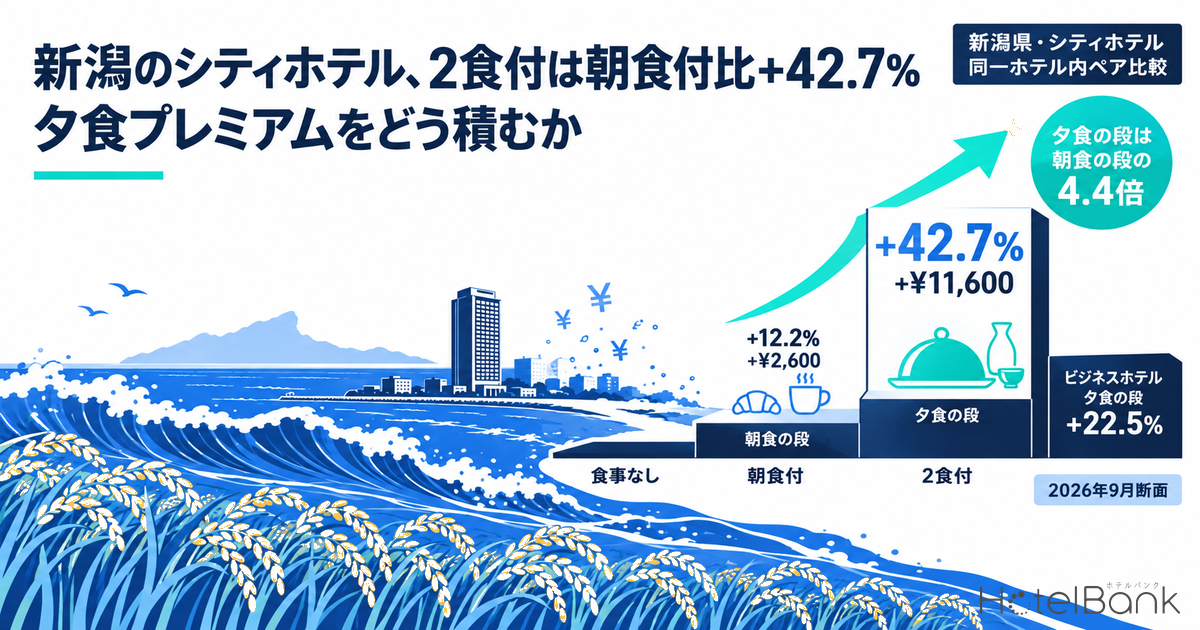
At city hotels in Niigata, properties that sell both a breakfast-included plan and a half-board plan (breakfast plus dinner) under the same roof (N=11) price the gap between them at +¥11,600 / +42.7%. Across the same property set, the gap between breakfast-included and room-only plans (N=16) stops at +¥2,600 / +12.2%. In other words, the dinner step is 4.4 times thicker than the breakfast step. Business hotels show the same shape — the dinner step is 4.9 times the breakfast step (+¥3,900 vs +¥800) — but in percentage terms the dinner step runs 42.7% at city hotels against 22.5% at business hotels, a 1.9-fold spread between segments. This article works through which step in the plan lineup still has room for rate, based on same-hotel paired comparisons in Niigata.
Coverage: hotels in Niigata Prefecture (meal premiums use paired comparisons restricted to properties selling both meal categories under the same roof; September 2026 snapshot; prefecture-wide N=99 properties / half-board pairs N=51 properties). Estimated settled ADR covers city hotels N=18 properties and business hotels N=126 properties (finalized August 2026). The price metric in this article is estimated settled ADR (a transaction-price level inferred from OTA and other sales data, tax-excluded equivalent), and meal premiums address only the differential between plans. Definitions appear at the end of the article. Data as of September 9, 2026.
- — +42.7% (N=11) — the dinner step (half-board minus breakfast-included) at city hotels in Niigata. That is 4.4 times the thickness of the breakfast step at +12.2% (N=16).
- — +22.5% (N=23) — the dinner step at business hotels. Roughly half the city-hotel figure, but 4.9 times their own breakfast step of +5.4% (N=66).
- — Steady across five months — the dinner step stays within 36.8–45.9% at city hotels and 20.3–24.7% at business hotels. The business-hotel breakfast step, by contrast, narrows from +12.5% in May to +3.3% in August.
- — +0.5% (N=28) — the breakfast step at business hotels in Chuo Ward, Niigata City (新潟市中央区). That stands in contrast to Nagaoka City +9.2%, Joetsu City +10.9% and Sanjo City +10.0%: the vanishing step is a central-district phenomenon.
- — 4th of 22 prefectures — as a city-hotel dinner step, Niigata’s +42.7% sits 6.7 points above the +36.0% median (22 prefectures with 8 or more pairs, September 2026 snapshot).
Breakfast and dinner steps differ in thickness, even though both count as “meals included”
The most common error in measuring a meal premium is to subtract the average of properties selling room-only plans from the average of properties selling breakfast-included plans. That subtraction measures the difference in property grade, not the value of the meal. What is used here is the average, per property, of the gap between the two meal categories, taken only from properties that actually sell both under the same roof. The figures below therefore show not a level (what price something sells at) but a differential (how much is added when the meal category moves up one step). The denominator (N) is the number of properties for which a pair exists, and because that population changes from pair to pair, N is always stated alongside.
For Niigata, the September 2026 snapshot reads as follows.
Source: MetroEngines Research; compiled by the HotelBank Editorial Team
At city hotels, the breakfast step is +¥2,600 (+12.2%, N=16) and the dinner step is +¥11,600 (+42.7%, N=11). Going all the way from room-only to half-board in one move is +¥14,300 (+58.5%, N=11). At business hotels the breakfast step is thin at +¥800 (+5.4%, N=66), the dinner step is +¥3,900 (+22.5%, N=23), and room-only to half-board comes to +¥4,900 (+29.7%, N=22). In both segments, most of the increment arises at the dinner step, not at breakfast.
Prefecture-wide (N=99), the breakfast step is almost flat at +¥300 (+1.7%), while the dinner step is +¥7,700 (+30.8%, N=51). The flat prefecture-wide breakfast step reflects, as discussed below, a high share of business hotels combined with resort-hotel pairs sitting in negative territory — which makes it hard to read an appropriate step for your own property off a prefecture average that mixes segments together. This is a metric to read by segment.
| Segment | Breakfast step (breakfast-incl. − room-only) |
Dinner step (half-board − breakfast-incl.) |
Two-step total (half-board − room-only) |
|---|---|---|---|
| City hotels | +¥2,621 / +12.2% N=16 | +¥11,575 / +42.7% N=11 | +¥14,264 / +58.5% N=11 |
| Business hotels | +¥800 / +5.4% N=66 | +¥3,904 / +22.5% N=23 | +¥4,920 / +29.7% N=22 |
| Resort hotels | −¥4,365 / −10.0% N=12 (see note below) | +¥9,724 / +25.5% N=13 | +¥4,874 / +11.2% N=12 |
| Prefecture total | +¥334 / +1.7% N=99 | +¥7,729 / +30.8% N=51 | +¥7,369 / +28.9% N=50 |
Niigata Prefecture, September 2026 snapshot. Paired comparison restricted to properties selling both meal categories under the same roof. Ryokan are excluded from this tabulation because their rate design assumes meals are built in. Source: MetroEngines Research; compiled by the HotelBank Editorial Team
The negative breakfast step at resort hotels (−¥4,400 / −10.0%, N=12) should not be read straight as “breakfast has no value.” Even within a same-hotel pair, the mix of room types and selling periods covered by a breakfast-included plan and a room-only plan may not line up, so selection bias remains. At resorts, room-only plans are in some cases set up for larger rooms or multi-night stays, and that compositional difference rides along in the gap. Since the dinner step in the same segment is positive at +¥9,700 (+25.5%, N=13), it is reasonable to treat the resort figure as an illustration that breakfast-step measurement is vulnerable to compositional differences, and to refrain from a categorical interpretation. Ryokan, meanwhile, are outside the scope of this theme: their rate design assumes meals are included, so the very concept of a step between meal categories does not apply.
The dinner step holds steady for five months; the breakfast step narrows in peak months
A single-month snapshot cannot tell you whether this gap is structural or temporary. Tracking the most recent five months for which tabulation is possible (May to September 2026), the dinner step proved remarkably stable within each segment.
Source: MetroEngines Research; compiled by the HotelBank Editorial Team
The city-hotel dinner step falls within 36.8%–45.9% (N=11 held constant across five months), business hotels within 20.3%–24.7% (N=23 held constant), and resort hotels within 22.4%–27.3% (N=11–14). Across all five months, the relationship in which the city-hotel dinner step is roughly twice the business-hotel figure never breaks down. Because the same paired property set is being tracked, this gap reflects not turnover in the sample but the design of the dinner product itself in each segment. The range into which business-hotel dinner steps fall nationwide is compared prefecture by prefecture in separate HotelBank coverage, which puts the national median at +28.3% / ¥4,451.
The breakfast step moved in the opposite way. At business hotels (N=65–66) it ran +12.5% in May, +10.4% in June and +9.7% in July, then narrowed to +3.3% in August and +5.4% in September. At city hotels (N=16), by contrast, it was close to constant: +10.2% in May, +11.1% in June, +11.5% in July, +10.2% in August and +12.2% in September. A pattern in which only the business-hotel gap compresses during the summer peak is consistent with room-only rates being raised on busy dates, which narrows the gap in relative terms. What these five months of observation suggest is a difference in kind: the breakfast step is the one that gets “eaten” in periods of demand, while the dinner step is maintained through the seasons.
| Month | City: breakfast step | City: dinner step | Business: breakfast step | Business: dinner step |
|---|---|---|---|---|
| May 2026 | +10.2% (N=16) | +40.7% (N=11) | +12.5% (N=66) | +20.5% (N=23) |
| June 2026 | +11.1% (N=16) | +45.9% (N=11) | +10.4% (N=66) | +24.7% (N=23) |
| July 2026 | +11.5% (N=16) | +43.1% (N=11) | +9.7% (N=65) | +22.3% (N=23) |
| August 2026 | +10.2% (N=16) | +36.8% (N=11) | +3.3% (N=66) | +20.3% (N=23) |
| September 2026 | +12.2% (N=16) | +42.7% (N=11) | +5.4% (N=66) | +22.5% (N=23) |
Niigata Prefecture, same-hotel paired comparison. Breakfast step = breakfast-included minus room-only; dinner step = half-board minus breakfast-included. Source: MetroEngines Research; compiled by the HotelBank Editorial Team
The breakfast step splits by location — close to zero at business hotels in Chuo Ward, Niigata City
Break the breakfast step down further by municipality and the prefecture divides cleanly. Limiting the view to municipalities with five or more pairs, the September 2026 snapshot reads as follows.
| Municipality | Segment | Breakfast step (¥) | Breakfast step (%) | N |
|---|---|---|---|---|
| Chuo Ward, Niigata City | City hotels | +¥3,944 | +15.8% | 7 |
| Chuo Ward, Niigata City | Business hotels | +¥73 | +0.5% | 28 |
| Joetsu City | Business hotels | +¥1,650 | +10.9% | 5 |
| Sanjo City | Business hotels | +¥1,212 | +10.0% | 6 |
| Nagaoka City | Business hotels | +¥1,520 | +9.2% | 9 |
| Chuo Ward, Niigata City | All segments | +¥847 | +5.1% | 35 |
Niigata Prefecture, September 2026 snapshot. Municipalities with fewer than five pairs are not shown. Source: MetroEngines Research; compiled by the HotelBank Editorial Team
What stands out most is that at business hotels in Chuo Ward, Niigata City, the breakfast step has all but disappeared, at +¥73 (+0.5%, N=28). In the very same ward, city hotels hold a step of +15.8% (N=7) — an entirely different picture by segment. Other cities in the prefecture (Joetsu City +10.9%, N=5; Sanjo City +10.0%, N=6; Nagaoka City +9.2%, N=9) all retain a step in the +9% to +11% band, so it can be isolated as “the vanishing breakfast step is not a Niigata-wide business-hotel story but a phenomenon of the densely supplied central district”. Where the practice of offering breakfast free or at a low price spreads in a central district, neighbouring properties find it harder to maintain a step of their own. The more a property leans on breakfast as its main rate battleground, the more it is worth watching this municipality-level breakdown on a fixed schedule. As a cross-prefecture benchmark for breakfast-step levels, HotelBank’s nationwide 47-prefecture tabulation puts the segment medians at 9.9% for business hotels and 14.45% for city hotels, which serves as a yardstick for locating your own property.
The underlying rate trend — city hotels below last year, business hotels above
How to use the meal steps depends on which way the base rate is pointing. Looking at estimated settled ADR (finalized figures) for Niigata year over year, city hotels (N=18 properties) came in at ¥10,400 in August 2026 against ¥11,800 in the same month last year, or −11.9%. With April at −10.0%, June at −7.6% and July at −5.3%, the months below last year have continued since spring.
Source: MetroEngines Research; compiled by the HotelBank Editorial Team
Business hotels (N=126 properties), on the other hand, recorded ¥8,400 in August 2026 against ¥8,000 a year earlier, or +5.4%, and with January +4.9%, February +4.7%, March +4.0% and June +10.8%, most finalized months came in above last year. Within the same prefecture, in other words, the trend points in opposite directions by segment. How this divergence between segments took shape over the first half of the year is tracked month by month on finalized figures in Niigata Settled ADR H1 2026: Business +10.8% in June, City −7.6%.
Layer the steps back on top of that and the implication is clear. For city hotels, whose rates are running below last year, there is more practical room to build up the dinner step (+42.7%), which has not wavered across five months, than to raise prices head-on in the room-only and breakfast-included range. Conversely, for business hotels tracking above last year at the base, the design that fits is to take account of how the breakfast step compresses in peak months (+3.3% in August) and, rather than placing breakfast at the centre of rate strategy, simply lift the room-only side on busy dates.
Note that estimated settled ADR from September 2026 onward is “an estimate based on current selling conditions,” which rests on a different basis from finalized figures. The two cannot be placed side by side to discuss increases or decreases, so the chart above plots finalized months only, and months from September onward are not used as evidence in this article.
Benchmarking step thickness against other prefectures, and sizing the uplift when you build it in
So far the view has been confined to the inside of Niigata Prefecture. Before deciding to move your own step, two things are worth confirming. One is where this +42.7% thickness sits nationally; the other is how much the rate per room-night actually moves when you shift the half-board mix.
Niigata’s city-hotel 42.7% is the 4th thickest among the 22 prefectures with enough pairs
Applying the same method nationwide (paired comparison restricted to properties selling both half-board and breakfast-included plans under the same roof) and lining up the prefectures where city hotels produced eight or more pairs, 22 prefectures qualify in the September 2026 snapshot. Their median is +36.0%, with the range running from Osaka at +19.4% (N=20) to Shiga at +48.5% (N=10).
| Prefecture | Dinner step (%) | Dinner step (¥) | N |
|---|---|---|---|
| Shiga | +48.5% | +¥13,943 | 10 |
| Shizuoka | +46.6% | +¥17,274 | 16 |
| Hyogo | +45.5% | +¥15,988 | 25 |
| Niigata | +42.7% | +¥11,575 | 11 |
| Kyoto | +41.1% | +¥17,758 | 22 |
| Nagano | +39.7% | +¥12,839 | 9 |
| Kanagawa | +39.4% | +¥16,330 | 16 |
| Okayama | +35.3% | +¥11,319 | 11 |
| Tokyo | +32.2% | +¥17,332 | 24 |
| Chiba | +32.0% | +¥10,250 | 21 |
| Fukuoka | +22.7% | +¥9,495 | 17 |
| Osaka | +19.4% | +¥7,551 | 20 |
September 2026 snapshot. City hotels, half-board minus breakfast-included. Prefectures with fewer than eight pairs are out of scope (median across the 22 in scope: +36.0%). A selection from all 22 prefectures is shown. Source: MetroEngines Research; compiled by the HotelBank Editorial Team
Niigata’s +42.7% (N=11) ranks 4th of the 22 prefectures, 6.7 points above the median. While it lands high on percentage, in absolute terms it is +¥11,575 — a gap from similarly high-ranking Shizuoka at +¥17,274 (+46.6%, N=16) and Kyoto at +¥17,758 (+41.1%, N=22). A high percentage paired with a mid-table absolute amount reflects the fact that breakfast-included rates at Niigata’s city hotels are not as high as in the top prefectures, which means thickness measured in percent and the amount you can add per night have to be read as two separate metrics. Tokyo shows the reverse: mid-table or lower on percentage at +32.2% (N=24), but large in absolute terms at +¥17,332. Locating your own property calls for a two-step approach — use the percentage to see how far you deviate from the segment range, and the absolute amount to see how much you can add.
How much does the per-room-night uplift move when the half-board mix shifts?
The step itself is a question of product design, but what actually feeds through to rate is the step multiplied by the share of mix that step sells at. Taking the range of dinner steps observed over the past five months and translating it into three levels — low, mid and high — gives the following sensitivity. For city hotels (N=11, pairs held constant across five months) the low is May 2026 at +¥10,416 (+40.7%), the mid is July at +¥11,196 (+43.1%) and the high is June at +¥11,725 (+45.9%). For business hotels (N=23) the same order gives +¥3,504 (+20.5%), +¥3,654 (+22.3%) and +¥4,022 (+24.7%).
| Share shifting from breakfast-included to half-board |
City hotels (N=11) | Business hotels (N=23) | ||||
|---|---|---|---|---|---|---|
| Low +¥10,416 |
Mid +¥11,196 |
High +¥11,725 |
Low +¥3,504 |
Mid +¥3,654 |
High +¥4,022 |
|
| 5% | +¥520 | +¥560 | +¥590 | +¥180 | +¥180 | +¥200 |
| 10% | +¥1,040 | +¥1,120 | +¥1,170 | +¥350 | +¥370 | +¥400 |
| 15% | +¥1,560 | +¥1,680 | +¥1,760 | +¥530 | +¥550 | +¥600 |
| 20% | +¥2,080 | +¥2,240 | +¥2,340 | +¥700 | +¥730 | +¥800 |
| 25% | +¥2,600 | +¥2,800 | +¥2,930 | +¥880 | +¥910 | +¥1,010 |
Uplift = dinner step x mix share. Low, mid and high are the minimum, median and maximum dinner steps observed from May to September 2026 (city: May / July / June; business: May / July / June). Rounded to the nearest ¥10. Source: MetroEngines Research; compiled by the HotelBank Editorial Team
Reading it is straightforward. At a city hotel, if one night in every ten that had been selling as breakfast-included shifts to half-board (a 10% mix share), the average rate per room-night rises by +¥1,040 to +¥1,170. Stretch that share to 20% and it becomes +¥2,080 to +¥2,340. As the previous section showed, estimated settled ADR at city hotels was −11.9% year on year in August 2026 (N=18 properties), so it is clear that the mix share required to claw that shortfall back through the step alone is by no means small. At business hotels the step itself is thin, so the same 10% share stops at +¥350 to +¥400 — consistent with the earlier point that their main rate battleground is neither breakfast nor dinner but the pricing of the room-only side.
This table is, however, not a forecast but a mechanical calculation using observed steps. It computes the case where only the mix changes, with room count and occupancy held the same, and it factors in neither demand creation from introducing half-board nor simple migration (cannibalization) away from breakfast-included plans. Dinner food cost, restaurant seating capacity and staffing are likewise excluded. The table is therefore best used not as a promise that “building it in will yield this much,” but as a rough guide to how far the mix has to move before the amount is worth discussing. Recalculate the absolute figures by substituting your own property’s step.
For revenue managers running city and business hotels in Niigata — implications and action plan
(1) “Strengthen the meal plans” is too coarse. The step to strengthen is dinner. At city hotels in Niigata the breakfast step is +12.2% (N=16) against a dinner step of +42.7% (N=11); at business hotels it is +5.4% (N=66) against +22.5% (N=23). When reviewing your plan lineup, rather than spending time debating whether to move the breakfast-included price by a few hundred yen, first check whether a half-board slot exists in the lineup at all — and, if it does, whether it sits somewhere visible in search results.
(2) Use the segment range as the yardstick for your own step. Look at how far the gap between your half-board and breakfast-included plans sits from the market range — broadly around +40% for city hotels and in the +20s for business hotels. If it falls well short, the setting may not be recovering dinner food cost. If it runs well above, check alongside whether bookings are actually converting, and treat it as a question of volume sold rather than of the step itself.
(3) Treat the breakfast step as a step that can disappear, not one to defend. The business-hotel breakfast step narrowed from +12.5% in May to +3.3% in August; in Chuo Ward, Niigata City it stands at +0.5% (N=28). In a central-district location, a design that depends on this step for rate is least likely to work precisely when demand is strong. Outside Chuo Ward (Nagaoka City +9.2%, Joetsu City +10.9%, Sanjo City +10.0%) the step persists, so it is natural to split the approach by location.
(4) Match the step you use to the trend in base rate. Finalized ADR at city hotels was −11.9% in August 2026 and continues to run below last year, while business hotels were +5.4%, above it. The weaker the base trend in a segment, the more room there is to pivot toward building rate on a different axis — the dinner step. That said, the dinner step is constrained by restaurant seating and staffing, so it cannot be decided by revenue management alone. The table below sets out a way forward that takes those constraints as given.
| Horizon | Measure | Decision trigger (figures from this article) | Purpose |
|---|---|---|---|
| Today–this week | Lay out your own lineup in three steps — room-only, breakfast-included, half-board — and write out the gap at each step in both absolute and percentage terms | There is no half-board slot in the lineup, or its gap from breakfast-included falls well short of +42.7% (city) / +22.5% (business) | Establish as fact whether the room to build sits on the breakfast or the dinner side |
| Today–this week | Audit your dependence on the breakfast step by location | You are located in Chuo Ward, Niigata City and breakfast-included is the main vehicle for rate uplift (the breakfast step for business hotels in that area is +0.5%, N=28) | Revisit early any design that leans on a step that is not working |
| Within two weeks | Align with the restaurant team on the ceiling for dinner covers available by day of week | You are adopting a policy of building up the dinner step (the city-hotel step has been stable at 36.8–45.9% over the past five months) | Fix the number of sellable slots first, and establish the capacity to back the volume you sell |
| Within two weeks | Design the display logic so half-board is shown first on busy dates and room-only exposure returns on soft dates | You can confirm at your own property the pattern in which the breakfast step compresses in peak months (the business-hotel prefecture average was +3.3% in August) | Split the roles — the thicker step on strong-demand days, volume protection on weak ones |
| Looking to next month | Put a monthly “step review date” on the rate-revision calendar | Your step has sat outside the segment range for two consecutive months | Run the rate conversation on the step axis, not just on levels |
| Looking to next month | Re-decide your main battleground according to the trend in base rate | City-hotel rates keep running below last year (finalized August 2026: −11.9%, N=18 properties) | Secure a way to build rate that does not rely on head-on price increases |
Source: MetroEngines Research; compiled by the HotelBank Editorial Team
None of these guarantees an outcome; suitability varies with your own product mix and restaurant operating structure. The dinner step in particular depends heavily on seating, staffing and food cost — conditions that cannot be controlled from the rooms side — so step design should always proceed with the agreement of the kitchen and restaurant departments.
Conclusion — three yardsticks
Three reusable yardsticks emerge from these same-hotel paired comparisons in Niigata.
First, the ratio between the steps. Against the breakfast step, the dinner step runs 4.4 times at city hotels and 4.9 times at business hotels. When considering how to strengthen meal plans, the impact differs by an order of magnitude depending on which step you touch.
Second, the segment range. The dinner step is +42.7% at city hotels (N=11) and +22.5% at business hotels (N=23), and across all five recent months city hotels hold roughly twice the business-hotel figure. Set your own step against that range and check the direction in which it deviates.
Third, the stability of the step. The dinner step is maintained through the seasons, while the breakfast step narrows in peak months and in central-district locations (business-hotel prefecture average +3.3% in August; Chuo Ward, Niigata City +0.5%, N=28). Which step to build rate around should be decided with that difference in stability in mind.
The meal premium is one of the few shared languages where room pricing and restaurant operations meet. Auditing the lineup in terms of differentials brings into view, segment by segment and location by location, room that never shows up when you stare at a rate sheet alone.
About the Data
■ Data sources
・Meal premiums: tabulated from accommodation rate data collected by MetroEngines Research, covering selling prices by meal category at lodging properties in Niigata Prefecture. Months covered: May to September 2026 (the range for which tabulation is possible). The prefecture comparison (Table 4) applies the identical method nationwide and covers the 22 prefectures where city hotels produced eight or more pairs.
・Definition of estimated settled ADR: a transaction-price level (tax-excluded equivalent) inferred from OTA and other sales data (lowest-plan level x segment coefficient, ensembled across multiple channels). Past months are finalized figures; current and future months are estimates based on current selling conditions.
・Breakdown of N: for meal premiums, Niigata Prefecture overall N=99 properties (breakfast step) / N=51 properties (dinner step); city hotels N=16 / 11; business hotels N=66 / 23; resort hotels N=12 / 13. For estimated settled ADR, city hotels N=18 properties and business hotels N=126 properties (both finalized August 2026).
・Data as of: September 9, 2026.
■ Calculation assumptions
・How meal premiums are calculated: only properties selling both of the two meal categories being compared (room-only / breakfast-included / half-board) under the same roof are extracted, and the per-property gap is averaged. Properties selling only one of the two meal categories are excluded, so what is measured is the differential of the meal category itself, not a difference in property grade. N is the number of properties for which a pair exists, and because that population changes from pair to pair it is stated alongside each figure. This article does not address levels (the prices of each meal category themselves), presenting only differentials in yen and percent.
・Ryokan are outside the scope of this tabulation: their rate design assumes meals are included, so the comparative axis of a step between meal categories does not apply.
・Uplift in Table 5: a mechanical product of the dinner step x mix share, calculated as the change in average rate per room-night if part of what had been selling as breakfast-included shifted to half-board, with room count and occupancy held the same. Low, mid and high use the minimum, median and maximum dinner steps observed from May to September 2026, rounded to the nearest ¥10. Demand-creation effects, cannibalization, dinner food cost, and restaurant seating and staffing are not factored in. This is a sensitivity guide, not a forecast.
・Year-on-year comparisons are calculated between finalized months only.
■ Limitations and caveats
・The September 2026 meal premium is a snapshot based on current selling conditions and may move as selling conditions change. Estimated settled ADR from September 2026 onward rests on a different basis from finalized figures and is therefore not used as evidence in this article.
・Even within a same-hotel pair, the mix of room types and selling periods covered may not line up across meal categories, so selection bias remains (the resort-hotel breakfast step discussed in the body is one example).
・Estimated settled ADR shows a median error of 6.6% when reconciled against published operating results.
・Categories with fewer than five pairs are not cited. The prefecture comparison (Table 4) excludes prefectures with fewer than eight pairs.
・This article does not address occupancy (estimated OCC) or booking curves.
・Selling conditions and inventory move daily, so the figures in this article are a snapshot as of the time of collection.