

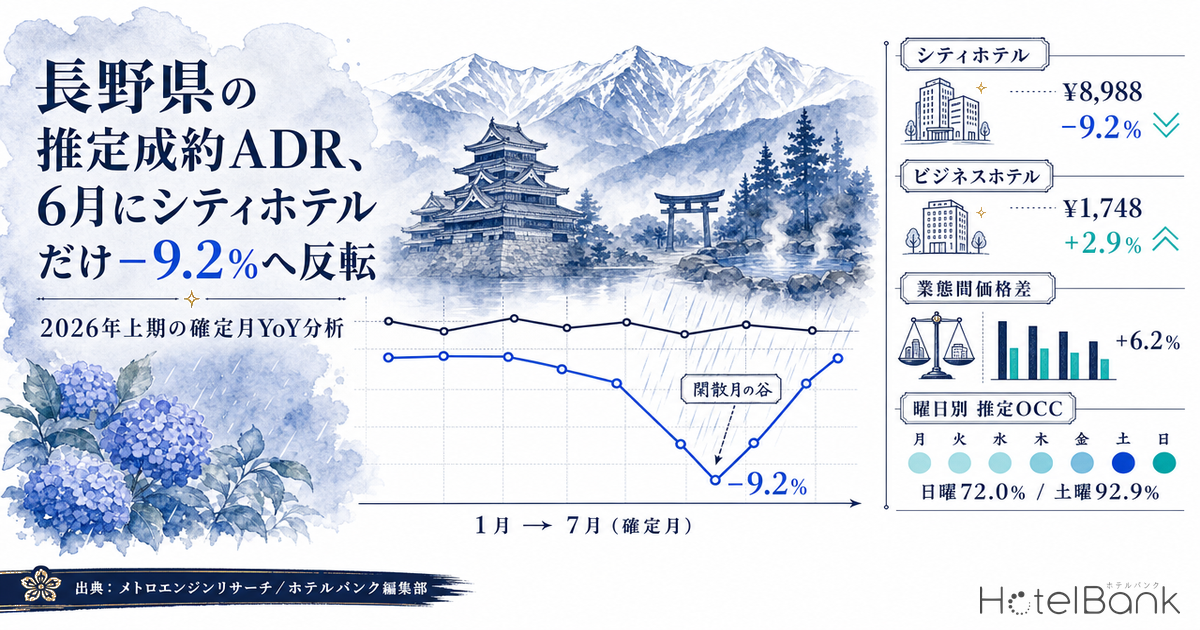
Line up Nagano’s H1 2026 (January–July) settled ADR estimates as confirmed-month year-on-year comparisons and the shape differs sharply by segment. Business hotels held positive ground for seven consecutive months, from +10.4% in January to +5.6% in July. City hotels, by contrast, opened strongly at +25.4% in January but flipped to −9.2% in June (¥8,988, N=16 properties) and stayed below the line in July at −2.1% (¥10,564). In that same month of June, business hotels kept their gains at +2.9% (¥7,240, N=166 properties). Averaged across the half year, both segments sit around +6% versus the prior year, so there is almost no gap in full-period performance. What separated them was a single question: how each segment handled the low season. This article matches confirmed-month data for Nagano’s city and business hotels and translates the findings into revenue-management practice for demand creation and rate discipline in slow months.
About the data in this article
Scope: Nagano Prefecture, city hotels N=16 properties / business hotels N=161–173 properties. The price metric in this article is settled ADR estimate (the transaction-price level estimated from OTA and other sales data, tax-excluded equivalent); occupancy is an estimate based on OTA-listed inventory. Definitions for both appear at the end of the article. Data as of September 2, 2026.
- — Nagano’s settled ADR estimate saw only city hotels flip to −9.2% in June 2026 (¥8,988, N=16 properties). Business hotels stayed positive the same month at +2.9% (¥7,240, N=166 properties).
- — Across H1 (January–July) the averages are near-identical: city +6.2%, business +6.0%. The gap is invisible in the full-period figure and appears only in the single low-season month.
- — The price gap between segments narrowed to ¥1,748 in June (¥2,856 in the same month a year earlier). City hotel rates moved toward the business hotel band more forcefully than in the prior year.
- — June estimated OCC shows city hotels at 72.0% on Sunday versus 92.9% on Saturday, a 20.9-point spread. Business hotels stayed within 12.2 points, so the days that need filling differ by segment.
- — The same “city-only reversal” pattern appears in Niigata (−18.4 points between segments). It can be treated as structurally distinct from Kyoto’s all-segment decline.
Seven confirmed months — a shared strong start, then diverging paths in June
First, the premises. The settled ADR estimates here compare only past months that have been confirmed on a monthly basis against the same month a year earlier. Months from August 2026 onward are pre-confirmation estimates and are excluded from the year-on-year calculation. Nagano’s city hotels cover 16 properties and business hotels 161–173 properties; because the number of properties with confirmed listings varies month to month, N= is shown for each month.
In January 2026, the city hotel settled ADR estimate was ¥11,810 against ¥9,416 a year earlier, or +25.4%. Business hotels came in at ¥7,429, up 10.4%, so both segments started the year with strong growth. City hotels sustained that through the following months — +9.9% (¥10,538) in February, +8.8% (¥9,717) in March, +3.5% (¥11,151) in April and +8.9% (¥12,084) in May, with May’s ¥12,084 the highest level of the half year. Business hotels moved in the same direction at a different level: +5.7% in February, +4.0% in March, +3.8% in April and +9.5% (¥8,342) in May.
The change came in June. The city hotel settled ADR estimate was ¥8,988, 9.2% below the ¥9,894 recorded a year earlier — the only near-double-digit decline of the half year. Business hotels in the same month were at ¥7,240 versus ¥7,038, or +2.9%: the smallest gain of the half year, but still positive. In July, city hotels narrowed the decline to −2.1% at ¥10,564 while business hotels recovered to +5.6% at ¥8,072. June, in other words, was the month when year-on-year growth was thinnest for both segments, and the month in which only city hotels sank below the waterline. Note that Nagano’s accommodation tax took effect on June 1, 2026; the pass-through scenarios and the assumed impact on rates are examined in our analysis of the June 1 Nagano accommodation tax.
Source: MetroEngines Research; compiled by the HotelBank Editorial Team
Overlaying the two years shows that June was also the H1 trough for Nagano’s city hotels last year (June 2025: ¥9,894). The existence of the trough is normal. The issue is its depth: June 2026 landed more than ¥900 below the prior-year trough. Business hotels, meanwhile, held June 2026 at ¥7,240 — above their own prior-year trough (June 2025: ¥7,038). Under the same market and the same seasonal factors, one segment lowered the floor of the trough and the other raised it.
Year-on-year trajectory — equal H1 averages, different monthly volatility
Placed side by side, the monthly year-on-year figures make the city hotels’ volatility stand out. From +25.4% in January to −9.2% in June, the spread reaches 34.6 points. Business hotels stayed within a 7.5-point band, from a high of +10.4% (January) to a low of +2.9% (June), with much smaller month-to-month movement.
Yet totalled across the seven months of H1, the average settled ADR estimate for city hotels is ¥10,693 (¥10,070 a year earlier, +6.2%) and for business hotels ¥7,597 (¥7,168, +6.0%) — growth rates that are essentially level. It is not the case that rate increases failed to work over the full period. City hotels are drawn from a small base of 16 properties and carry a higher absolute room rate, so rate moves made in thin-demand months show up readily in the average. The size of the swing should be read not as proof of weakness but as evidence that monthly decisions translate directly into results.
Source: MetroEngines Research; compiled by the HotelBank Editorial Team
One further point is instructive: the trajectory of the price gap between the two segments. The difference in settled ADR estimate between city and business hotels stood at ¥4,381 in January 2026. By June it had narrowed to ¥1,748. Since the gap in June a year earlier was ¥2,856, the June segment spread contracted by more than ¥1,100 year on year. July recovered to ¥2,492, still short of the ¥3,150 recorded in July 2025. June 2026 was the month in which the low-season drift of city hotel rates toward the business hotel band showed up more strongly than in the prior year.
| Stay month | City 2025 | City 2026 | YoY | Business 2025 | Business 2026 | YoY | Segment gap 2026 |
|---|---|---|---|---|---|---|---|
| January | ¥9,416 | ¥11,810 | +25.4% | ¥6,727 | ¥7,429 | +10.4% | ¥4,381 |
| February | ¥9,589 | ¥10,538 | +9.9% | ¥6,820 | ¥7,212 | +5.7% | ¥3,326 |
| March | ¥8,929 | ¥9,717 | +8.8% | ¥6,938 | ¥7,213 | +4.0% | ¥2,504 |
| April | ¥10,778 | ¥11,151 | +3.5% | ¥7,390 | ¥7,672 | +3.8% | ¥3,479 |
| May | ¥11,092 | ¥12,084 | +8.9% | ¥7,619 | ¥8,342 | +9.5% | ¥3,742 |
| June | ¥9,894 | ¥8,988 | −9.2% | ¥7,038 | ¥7,240 | +2.9% | ¥1,748 |
| July | ¥10,794 | ¥10,564 | −2.1% | ¥7,644 | ¥8,072 | +5.6% | ¥2,492 |
| Jan–Jul average | ¥10,070 | ¥10,693 | +6.2% | ¥7,168 | ¥7,597 | +6.0% | ¥3,096 |
Settled ADR estimate (tax-excluded equivalent). City hotels N=16 properties, business hotels N=161–173 properties (varies by month). All comparisons are between confirmed months. Source: MetroEngines Research; compiled by the HotelBank Editorial Team
Months from August 2026 onward are pre-confirmation estimates. For reference, September 2026 for city hotels is calculated at ¥13,102 (N=16 properties, estimated from current sales conditions), but this figure can move with future sales and a simple comparison against the prior-year confirmed value has to wait for month-end confirmation. Every year-on-year figure in this article is restricted to confirmed months.
The shape of June demand — what day-of-week estimated OCC shows
To see what happened to city hotels in June from the demand side, consider that month’s estimated OCC (based on OTA-listed inventory). In June 2026, the Nagano monthly average was 83.7% for city hotels and 88.6% for business hotels. On the same metric, May was 88.9% for city and 91.5% for business, and July was 88.6% and 92.2% — confirming that June is a month when inventory absorption loosens for both segments, and that the loosening is greater for city hotels. Note that this metric is an estimate based on how inventory listed on OTAs is absorbed; it is defined differently from actual room occupancy and reads higher.
Breaking the month down by day of week makes the skew in June demand clearer still. City hotels peak on Saturday at 92.9%, followed by Friday at 89.3% and Thursday at 88.5%, while Sunday falls to 72.0%. The spread between the highest day (Saturday) and the lowest (Sunday) is 20.9 points. Business hotels, by contrast, peak on Thursday at 92.2% and Saturday at 92.7%, and even their lowest day, Sunday, holds at 80.5% — a spread of 12.2 points, a little over half that of city hotels. How Nagano’s day-of-week trough moved in later months is tracked in Nagano in September: Wednesday 58.7% versus 93.0% on the first day of the holiday weekend.
June 2026, Nagano Prefecture. Estimated OCC (based on OTA-listed inventory). Source: MetroEngines Research; compiled by the HotelBank Editorial Team
Business hotels hold firm on weekdays (Monday–Friday) in a range of 85.6–92.2%, accumulating demand across most of the week. City hotels concentrate demand on Saturday, with Sunday and Monday (78.8%) thin. In a low-season month, the number and the distribution of the days that must be filled are completely different between the two segments. When two days of the week are thin and rates are moved to fill them, the monthly average settled ADR estimate is pulled down by exactly that much. June’s −9.2% for city hotels can be read as the consequence of this structure.
Is the June reversal unique to Nagano? A four-prefecture comparison
So far the view has been confined to Nagano. Applying the same yardstick to other prefectures reveals whether the June reversal is a local circumstance or a pattern that occurred simultaneously across several markets. The table below places June 2026 for Nagano alongside Kyoto, Niigata, Chiba and Iwate, using our own aggregation of the identical metric (settled ADR estimate, year-on-year between confirmed months).
| Prefecture | City June YoY | N | Business June YoY | N | Gap between segments | City H1 average | Business H1 average |
|---|---|---|---|---|---|---|---|
| Nagano | −9.2% | 16 | +2.9% | 166 | −12.1pt | +6.2% | +6.0% |
| Kyoto | −14.6% | 57 | −9.8% | 324 | −4.8pt | −5.8% | −0.5% |
| Niigata | −7.6% | 18 | +10.8% | 125 | −18.4pt | −3.4% | +4.0% |
| Chiba | +0.3% | 52 | +0.1% | 162 | +0.2pt | +3.4% | +4.4% |
| Iwate | +4.3% | 18 | −3.2% | 86 | +7.5pt | +2.3% | +4.3% |
Source: MetroEngines Research; compiled by the HotelBank Editorial Team
Three patterns emerge. The first is the “city-only reversal” of Nagano and Niigata. Nagano’s June reads city −9.2% against business +2.9%, a segment gap of −12.1 points; Niigata reads city −7.6% against business +10.8%, or −18.4 points. These are the two widest gaps among the five prefectures. In both, business hotels held positive H1 averages (Nagano +6.0%, Niigata +4.0%), so the segments diverge only in the single low-season month.
The second is Kyoto’s “whole market declines” pattern. June was negative for both segments — city −14.6% and business −9.8% — and the H1 average for city hotels was −5.8%, below the prior year across the period. That is an adjustment in the level itself rather than a single-month trough, and it is a different shape from Nagano. The third is the “segments aligned or inverted” pattern of Chiba and Iwate: Chiba was essentially flat for both segments in June (a 0.2-point gap), while Iwate posted city +4.3% against business −3.2%, opening in the opposite direction from Nagano.
June in Nagano therefore belongs not to the Kyoto pattern of a market-wide sink but to the pattern in which only the city hotel price band moves downward in a low-season month. Seen together with Niigata, which shares the pattern, this is better treated in practice as a structure that can recur in prefectures where low-season tourism demand is thin, rather than as a pricing error at particular properties. When assessing your own June, the closest comparison is the same month for the same segment in prefectures that belong to the same pattern — not the national average or a neighbouring prefecture’s full-year figure.
Note that accommodation tax has been levied in Nagano since June 1, 2026 (the prefectural tax is ¥200 per person per night, or ¥100 in Matsumoto City, Karuizawa Town, Achi Village, Hakuba Village and Nozawaonsen Village; room-only stays under ¥6,000 per person per night, before tax, are exempt). See Nagano Prefecture, “About the Accommodation Tax”. However, the settled ADR estimate in this article is per room and tax-excluded equivalent, whereas the tax exemption threshold is per person per night, room-only and before tax — different bases that cannot be compared directly. The point here is limited to recording that a regulatory change occurred in the same month; no causal judgment is made regarding June’s −9.2%.
For revenue managers running city and business hotels in Nagano — implications and an action plan
(1) The annual rate increase is working. What is not working is the low season alone. H1 averages of +6.2% for city and +6.0% for business show that rate levels across the Nagano market ran above the prior year. Even if your own annual average is growing in line with the market, a single month in which the market swung to −9.2% — as June did — remains a leak in annual RevPAR. Rather than judging performance “on track” from the annual figure alone, line up the monthly year-on-year figures and check how your property behaved in the months when the market turned negative.
(2) Make the “floor of the trough” an annual management metric. City hotels took a prior-year trough of ¥9,894 (June 2025) down to ¥8,988 in June 2026. Business hotels did the reverse, lifting their prior-year trough of ¥7,038 to ¥7,240. Low-season ADR is close to the sum of the floor rates set for that month. If your June result is below your own June a year earlier, there is room to question the placement of the floor before blaming demand.
(3) A narrowing price gap between segments is a warning signal for city hotels. The June segment gap was ¥1,748, sharply narrower than ¥2,856 in June a year earlier. The closer the city hotel price band moves to the business hotel band, the less the differentiating attributes of the property (room size, in-house facilities, breakfast and so on) are reflected in price. A price band once lowered becomes the comparison base for the following year, so it is worth remembering that low-season pricing creates next year’s year-on-year figure. How much of the breakfast attribute is priced in by segment is quantified in Nagano’s breakfast premium: a threefold gap between segments.
(4) The days that need filling are determined by day of week. In June, city hotels were thin on Sunday (72.0%) and Monday (78.8%) and thick on Saturday (92.9%). Rather than an across-the-board discount, there is room to consider demand creation targeted at those two thin days (incentives to extend the stay, reasons to be in the area, value framing for consecutive nights). Pulling the strong Saturday into a discount lowers only the monthly average ADR.
The following places the above on a practical timeline. None of these guarantee results; select among them in light of your own property’s demand structure.
| Timeline | Action | Decision trigger | Objective |
|---|---|---|---|
| Today–this week | Line up your monthly ADR for January–July 2026 against the same months a year earlier and overlay the market trajectory (city +25.4% → −9.2%, business +10.4% → +2.9%) | Whether your property moved in the same direction in June, when the market turned negative | Separating market factors from property factors |
| Today–this week | Break your June results down by day of week and identify the thin days | The market is thin on Sunday (72.0%) and Monday (78.8%) for city hotels. Is your trough on the same days? | Limiting which days are discounted |
| Within two weeks | Reset low-season floor rates and review, by day of week, the range in which automated discounting may break the floor | If your June ADR remains below the market’s ¥8,988 (city) / ¥7,240 (business) | Stopping the floor of the trough from being lowered |
| Within two weeks | Revisit the design of consecutive-night and extended-stay products to carry demand from the strong Saturday into the thin Sunday | If your Saturday–Sunday estimated OCC gap is at or above the market level (20.9 points) | Adding occupancy without lowering rate |
| Looking to next month | Build the low-season floor and review dates into the June 2027 rate-revision calendar in advance | If June 2026 came in below June 2025, factor in that next year’s comparison base is lower | Not creating next year’s year-on-year figure yourself |
| Looking to next month | Add the segment gap (your ADR minus the market business hotel level) to your monthly monitoring metrics | Investigate the cause in any month where the gap narrows to the market’s June level (¥1,748) | Early detection of downward drift in the price band |
Source: MetroEngines Research; compiled by the HotelBank Editorial Team
Conclusion — three yardsticks for measuring the low season
Across H1 2026, Nagano posted healthy figures of roughly +6% year on year for both segments, yet in the single month of June only city hotels sank to −9.2%. From that fact, three reusable yardsticks emerge for measuring low-season operations.
First, compare the “floor of the trough” against the prior year, not the annual total. An H1 average of +6.2% conceals June’s −9.2%. Whether low-season ADR exceeds the same low-season month a year earlier is the most direct indicator of whether floor-rate management is working.
Second, watch the price gap between segments. The city–business gap, narrowed to ¥1,748 in June, retreated sharply from ¥2,856 in the same month a year earlier. Whether your price band is drifting toward the band one segment below is invisible in absolute ADR alone.
Third, low-season softness in occupancy is skewed by day of week. In June, city hotels had troughs on specific days — Sunday at 72.0% and Monday at 78.8% — while Saturday built up to 92.9%. Extending a price response across the whole month without identifying the days that need filling also cuts the rate on days that were already full.
The low season is not a month for discounting to fill rooms; it is a month for deciding where not to discount. Nagano’s June 2026 data shows that the difference in that judgment appears as a year-on-year gap of more than ¥1,100 between the segments.
About the Data
■ Data sources
The price metric is a monthly aggregation by segment (city hotels / business hotels) for Nagano Prefecture based on accommodation sales data collected and compiled in-house; the demand metric is a monthly and daily aggregation of listed-inventory absorption for the same population. The comparison prefectures (Kyoto, Niigata, Chiba, Iwate) use the identical metric and the identical aggregation method. Regulatory information is drawn from the Nagano Prefecture official page “About the Accommodation Tax.”
■ Calculation assumptions
All year-on-year figures are calculated between confirmed months (confirmed values for past months); months from August 2026 onward, which are pre-confirmation estimates, are excluded from the comparison. H1 averages use the simple average of January–July for 2025 and 2026 respectively, with the change derived from the difference. The segment gap is the difference in settled ADR estimate between city and business hotels in the same month and prefecture. Day-of-week estimated OCC is the simple average of daily values for June 2026 by day of week. All monetary figures are per room and tax-excluded equivalent; no conversion to a per-person basis has been made.
■ Limitations and caveats
The settled ADR estimate is an estimate and carries a median error of 6.6% when checked against published operating results. Nagano’s city hotels have a small base of N=16 properties, so a pricing change at a particular property readily moves the prefectural average. Estimated OCC is based on the absorption of listed inventory and therefore reads higher than actual room occupancy. This article presents observed year-on-year results; it does not test causality between June’s movement and any factor, including the introduction of the accommodation tax. The prefecture comparison covers a sample of five prefectures and is not representative of the country as a whole.
- Definition of estimated OCC (based on OTA-listed inventory): OTA-listed-inventory occupancy = 100 − 100 × OTA-listed remaining rooms ÷ total rooms. It is an estimate based on the absorption of inventory sold on OTAs and is defined differently from actual room occupancy (it reads higher). This article covers May–July 2026 (Nagano Prefecture).
- Booking curve: based on observations from 45 days before the stay date up to the present.
- Definition of settled ADR estimate: the transaction-price level (tax-excluded equivalent) estimated from OTA and other sales data (lowest-plan level × segment coefficient, ensembled across multiple channels). Past months are confirmed values; the current and future months are estimates based on present sales conditions. Median error of 6.6% when checked against published operating results. All year-on-year figures in this article compare confirmed values only; pre-confirmation estimates are not used in comparisons.
- Breakdown of N: Nagano city hotels N=16 properties (all months from January 2025 to July 2026); Nagano business hotels N=161–173 properties (varies by month; June 2026 N=166, July 2026 N=167). For estimated OCC, the population is all listed properties in the relevant category within Nagano Prefecture.
- Data as of: September 2, 2026. Sales conditions and inventory change daily, so the figures in this article are a snapshot as of the time of retrieval.
Related reading
- Nagano Breakfast Premium: City +11.1% vs Resort +3.2% — 3x Segment Gap
- Nagano September: Wed 58.7% vs Holiday Sat 93.0%, 34pt Gap Holds
- Nagano Late-Summer Booking Curve 2026: Ryokan −11.8pt at 45 Days Out
- Nagano Accommodation Tax June 1: 2nd Prefecture, ADR Impact & Pass-Through Scenarios
- Matsumoto ADR ¥13,400 vs ¥18,300 Ceiling: Absorbing 222 New Rooms
- Iwate Settled ADR H1 2026: Business −3.2% in June, City +4.3%