

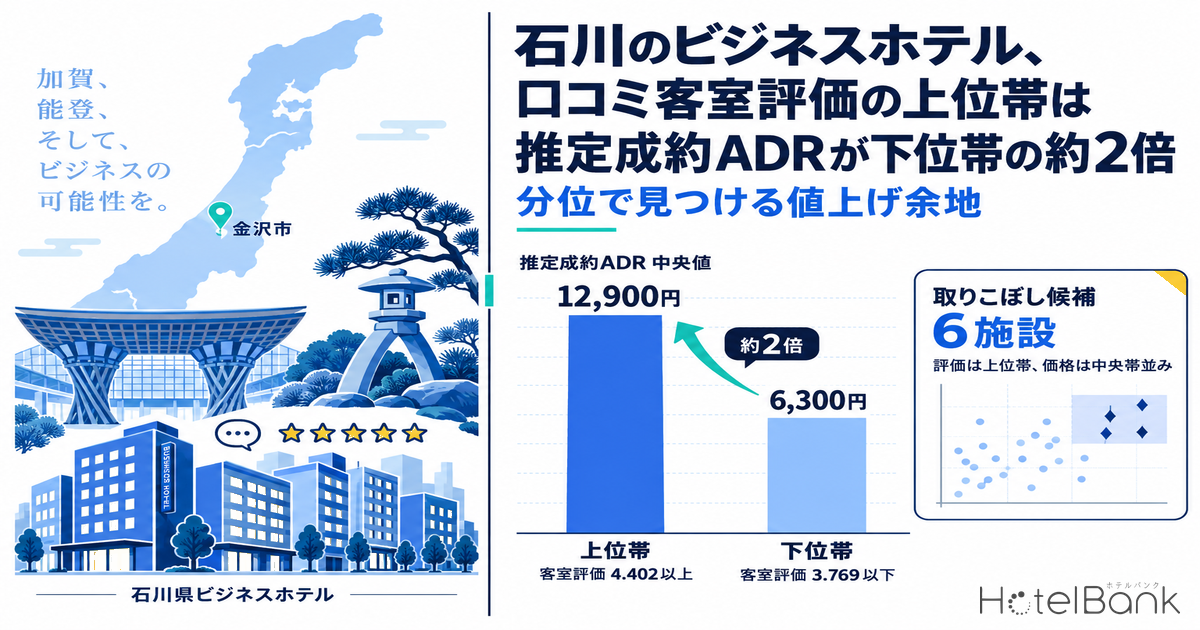
We split business hotels in Ishikawa Prefecture into three tiers by guest-review score quartiles and lined up each property’s settled ADR. The top tier — properties whose room score is at or above the prefecture’s top-quartile line (4.402), N=34 properties — posted a median settled ADR of ¥12,900 for February–August 2026. The bottom tier — at or below the bottom-quartile line (3.769), N=14 properties — came in at ¥6,300, a gap of roughly 2.0x. Ratings and prices broadly move together. Yet 6 of the 34 top-tier properties had a settled ADR at or below the middle tier’s top-quartile line (¥8,680). Three of those six also posted an estimated OCC at or above the middle tier’s median (83.3%). This article walks through a procedure that uses review quartiles to spot properties whose “price is not keeping up with their rating,” alongside the movement of prefecture-wide closed-month figures.
Scope: Ishikawa Prefecture business hotels, N=110 properties (prefecture-wide settled ADR, August 2026 closed figure); property-level matching N=90 properties, 11,763 rooms. The price metric in this article is settled ADR (the transacted price level estimated from OTA and other sales data, tax-excluded equivalent); occupancy is an estimate based on OTA-listed inventory. Definitions for both are at the end of the article. Data as of September 27, 2026.
• ADR (average daily rate) = an estimated transacted rate (tax-excluded equivalent), calculated by applying a segment-specific adjustment factor to the lowest-plan level each property publishes on OTAs (per-room rate for 2 guests per room, tax included). Checked against published operating results, the median error is 6.6%. These are estimates and differ from each property’s actual transacted prices and accounting figures.
• Area-level ADR (prefecture, city) is the median of the estimated transacted rates of the properties covered (the level of a typical property in the area).
• Where listed prices are mentioned, they are per-room rates for 2 guests per room (tax included).
• OCC (occupancy) = the share of rooms sold relative to total rooms in the area (an estimate based on OTA sales inventory). Estimated OCC by tier in this article is calculated at the property level on a monthly basis using the same approach and shown as the median for each tier (individual property values are not published).
• Prices in the body text are rounded to the nearest ¥100 (except the ¥8,680 classification boundary). Tables and charts show values in yen.
• Source: MetroEngines Research (continuous tracking data of OTA public prices)
- — Settled ADR for Ishikawa business hotels was ¥8,100 for August 2026 (closed figure, N=110 properties), −4.9% YoY. June through August came in below the same month of the prior year three months in a row.
- — The top room-score tier (4.402 or higher, N=34 properties) had a median settled ADR of ¥12,900, about 2.0x the bottom tier’s ¥6,300 (3.769 or lower, N=14 properties) for February–August 2026. Median estimated OCC differed by only a few points, ranging from 81.3% to 87.1%.
- — Of the 34 top-tier properties, 6 were priced at or below the middle tier’s top-quartile line (¥8,680). Of those, 3 also had estimated OCC at or above the middle tier’s median (83.3%) — the group whose pricing deserves review first.
Prefecture-wide Settled ADR — ¥8,100 in August 2026, −4.9% YoY
First, we check the market-wide price level using closed months. The settled ADR (area median) for Ishikawa business hotels was ¥8,100 for August 2026 (closed figure, N=110 properties). The closed figure for August of the prior year was ¥8,500 (N=110 properties), putting the YoY change at −4.9%. Comparing 2026’s closed months with the same months a year earlier, April (¥8,300, +3.9%) and May (¥8,800, +2.8%) were above the prior year. June (¥7,000, −4.7%), July (¥7,200, −6.8%) and August, however, fell below it.
The seasonal shape is the same every year: spring (March–May) and autumn (October–November) are high, while winter (December–February) and the rainy season (June) are low. In 2025 the peak was ¥9,500 in November and the trough ¥6,800 in December. Narrowing to Kanazawa City, the August 2026 closed figure was ¥9,400 (N=81 properties), −3.9% against ¥9,800 in August of the prior year (N=84 properties) — a higher level than the prefecture as a whole, with a slightly smaller YoY decline. How city and business hotels moved in opposite directions YoY in the first half of 2026 is analyzed in detail in Ishikawa ADR H1 2026: City +3.6%, Business −1.3%.
Source: Compiled by HotelBank Editorial Team from MetroEngines Research (Ishikawa business hotels, settled ADR, closed months only. 2024: N=106–118 properties; 2025: N=107–111 properties; 2026: N=109–110 properties)
When market-wide prices keep running below the prior year, hotels face the question of whether to “cut prices in line with the market.” But even within the same market, price gaps between individual properties are substantial, and much of that gap moves with guest ratings. In the next section we break this gap down using review-score quartiles as the yardstick.
Prefecture Benchmarks for Review Scores — Room Median 4.07, Location 4.25
These are the prefecture benchmarks for Ishikawa business hotels, compiled from guest reviews over the most recent 24 months by rating category. All are on a 5-point scale and show the bottom-quartile line, median and top-quartile line when each property’s average score is ranked. The room score had a median of 4.07 (bottom quartile 3.769, top quartile 4.402; N=76 properties, 20,089 reviews). Location had a median of 4.25 (N=72 properties), breakfast 4.087 (N=48 properties) and staff 4.269 (N=61 properties).
| Rating category | Properties | Reviews | Bottom-quartile line | Median | Top-quartile line |
|---|---|---|---|---|---|
| Room | N=76 | 20,089 | 3.769 | 4.070 | 4.402 |
| Service | N=73 | 17,380 | 3.819 | 4.000 | 4.217 |
| Location | N=72 | 13,255 | 4.010 | 4.250 | 4.514 |
| Bathroom | N=60 | 11,590 | 3.402 | 3.750 | 4.175 |
| Cleanliness | N=66 | 10,204 | 3.865 | 4.156 | 4.374 |
| Facilities | N=53 | 5,603 | 3.691 | 3.962 | 4.252 |
| Staff | N=61 | 5,399 | 4.054 | 4.269 | 4.550 |
| Breakfast | N=48 | 5,164 | 3.888 | 4.087 | 4.375 |
| Meals | N=40 | 2,342 | 3.832 | 4.115 | 4.451 |
| Amenities | N=30 | 900 | 3.912 | 4.251 | 4.454 |
Source: Compiled by HotelBank Editorial Team from MetroEngines Research (guest reviews, most recent 24 months, prefecture benchmarks)
This table works as a yardstick for gauging where your property stands. For example, a room score of 4.3 beats the prefecture median (4.07) but falls short of the top-quartile line (4.402), placing the property in the “middle tier.” A score of 4.45 puts it in the “top tier.” Location and staff both have medians in the 4.2 range; because the prefecture-wide level for these two categories is already high, the bar for reaching the top tier is higher too.
Settled ADR by Quartile Tier — Top Room-Score Tier at ¥12,900, About 2.0x the Bottom Tier
Next, we match each property’s review scores with its settled ADR. The sample covers 90 properties with 11,763 rooms (37,899 room-score reviews): properties with at least 20 room-score reviews in the most recent 24 months and a property-level settled ADR for all seven months from February to August 2026 (excluding 2 properties with a month of fewer than 10 observed days). For each property we averaged the seven monthly settled ADRs, then split the properties into three tiers using the prefecture benchmark’s bottom- and top-quartile lines.
| Room-score tier | Properties / rooms | Settled ADR median | Settled ADR bottom–top quartile | Estimated OCC median | Estimated RevPAR median |
|---|---|---|---|---|---|
| Top tier (4.402 or higher) | N=34 / 3,907 rooms | ¥12,914 | ¥9,411–¥20,520 | 81.3% (N=33) | ¥9,512 |
| Middle tier (above 3.769 to below 4.402) | N=42 / 6,921 rooms | ¥7,501 | ¥6,518–¥8,680 | 83.3% (N=41) | ¥6,028 |
| Bottom tier (3.769 or lower) | N=14 / 935 rooms | ¥6,348 | ¥6,063–¥6,651 | 87.1% (N=14) | ¥5,344 |
| All properties | N=90 / 11,763 rooms | ¥8,366 | — | 83.8% (N=88) | — |
Source: Compiled by HotelBank Editorial Team from MetroEngines Research (period: closed months February–August 2026. Estimated OCC is the average of property-level monthly estimates, limited to properties with at least six months of 80%+ observation coverage. Estimated RevPAR is the median of each property’s estimated OCC × settled ADR)
Between the top and bottom room-score tiers, median settled ADR differs by about 2.0x. Median estimated OCC was 81.3% for the top tier, 83.3% for the middle tier and 87.1% for the bottom tier. The occupancy difference between tiers is only a few points, while the price difference is far larger. As a result, median estimated RevPAR also diverged widely: ¥9,500 for the top tier versus ¥5,300 for the bottom tier. The average picture across the prefecture is that highly rated properties sell at higher prices without giving up much occupancy.
That said, prices vary widely even within the top tier: its bottom-quartile line is ¥9,400 and its top-quartile line ¥20,500. Of the 34 top-tier properties, 32 are located in Kanazawa City, and all 34 also score at or above the prefecture median (4.25) for location. Because “properties with high room scores also tend to have good locations,” the price gap cannot be explained by room scores alone. With this in mind, the next section singles out properties that meet both the rating and location conditions yet remain priced at middle-tier levels, and labels them “missed-revenue candidates.”
Source: Compiled by HotelBank Editorial Team from MetroEngines Research (N=90 properties; 1 dot = 1 property; property names not shown. Vertical axis is the average settled ADR for February–August 2026)
The same tendency shows up in other rating categories. The ratio of median settled ADR between the top and bottom tiers was about 2.05x for cleanliness (N=83 properties) and about 1.95x for location (N=87 properties). Breakfast was about 1.72x (N=68 properties), service about 1.73x (N=90 properties) and staff about 1.78x (N=72 properties). Rank correlation coefficients between score and price were 0.73 for room and cleanliness, 0.70 for service, 0.67 for location, and 0.64 for breakfast and staff. The ratings most strongly linked to price are those about “the room itself” — room and cleanliness. Breakfast and staff are notable for the small price gap between the middle and bottom tiers (breakfast: ¥7,700 vs ¥7,200; staff: ¥8,300 vs ¥7,300); the price gap only opens up once scores cross the top-quartile line.
Source: Compiled by HotelBank Editorial Team from MetroEngines Research (properties covered per rating category: room 90, cleanliness 83, location 87, service 90, breakfast 68, staff 72. Tiers are split at each category’s prefecture-benchmark bottom- and top-quartile lines)
Spotting “Missed-Revenue Candidates” — 6 of 34 Top-Tier Properties Priced in the Middle-Tier Range
In this article, “missed-revenue candidates” are defined by the following three conditions.
| Step | Condition | Matching properties |
|---|---|---|
| 1. Rating | Room score at or above the prefecture benchmark’s top-quartile line (4.402) | 34 properties (of which location also at or above prefecture median: 34) |
| 2. Price | Settled ADR at or below the middle tier’s top-quartile line (¥8,680) | 6 properties (of which below the middle tier’s median of ¥7,501: 2) |
| 3. Occupancy | Estimated OCC at or above the middle tier’s median (83.3%) | 3 properties |
Source: Compiled by HotelBank Editorial Team from MetroEngines Research (N=90 properties, February–August 2026)
The six properties meeting both conditions 1 and 2 (about 18% of the top tier) receive top-quartile ratings from guests, yet are priced at the same level as the middle tier. Five of the six are in Kanazawa City. Adding condition 3 leaves three properties. These three are highly rated and running occupancy at or above middle-tier levels, yet their prices sit at middle-tier levels. This is the group where the first check should be whether there is room to raise prices relative to demand.
By contrast, for the remaining three properties that meet conditions 1 and 2 but have estimated OCC below the middle tier’s median, the issue may lie in sales channels, visibility or room-type mix rather than price. The priority here is the demand-generation side: checking whether the high ratings are actually coming across on booking sites. Deciding whether to raise prices or increase visibility can go wrong unless rating, price and occupancy are looked at together.
It is also worth checking the opposite case. Among the 14 properties in the bottom room-score tier, the top-quartile line for settled ADR is ¥6,700, and the price range within the tier is narrow. Their median estimated OCC of 87.1% is the highest of the three tiers — a group securing occupancy at an affordable price point. For this tier, lifting the rating itself into the middle tier would create room to move up a price band.
For Revenue Managers at Ishikawa Business Hotels — Implications and Action Plan
Operational insights
1. Separate the market ADR decline from your own pricing decision. Prefecture-wide settled ADR was −4.9% YoY in August 2026, and June through August were below the prior year three months running. But this figure is an area median. In our matching, the top and bottom room-score tiers within the same market showed a price gap of about 2.0x. Before cutting prices across the board because the overall market is down, check which rating tier your property is in and where it sits within that tier’s price range.
2. Your position is determined by the combination of “rating tier” and “price tier.” A room score of 4.402 or higher puts you in the top tier. The top tier’s median settled ADR was ¥12,900, with a bottom-quartile line of ¥9,400. If you are in the top tier but your price stays at or below the middle tier’s top-quartile line (¥8,680), it is worth checking whether your rating is failing to show up in your price.
3. Check occupancy before raising prices. Of the six missed-revenue candidates, three had estimated OCC at or above the middle tier’s median (83.3%). One sensible sequence: if occupancy is at or above middle-tier levels, review pricing; if it is below, review visibility and sales channels first.
4. Which rating category you improve changes how much it affects price. Room and cleanliness had the strongest link to price (rank correlation 0.73). For breakfast and staff, the price gap between the middle and bottom tiers is small and only opens up above the top-quartile line. When setting priorities for improvement investment, one approach is to see which categories are closest to the top tier and start with those that are just one step away.
Action plan
| Timing | Measure | Decision trigger (figures from this article) | Aim |
|---|---|---|---|
| This week | Tally your property’s reviews for the most recent 24 months by category and place them against the prefecture benchmark table to determine your tier | Room 4.402 or higher / 3.769 or lower; cleanliness 4.374 or higher; location 4.514 or higher, etc. | Understand your position by rating tier |
| This week | Average your property’s actual ADR (tax excluded) for February–August 2026 and compare it with the price range of your tier | Top tier: ¥9,411–¥20,520; middle tier: ¥6,518–¥8,680 | Understand your price position within the tier |
| Within 2 weeks | If you are in the top tier but priced at ¥8,680 or below, check your occupancy for the same period | Whether occupancy is at or above the middle tier’s median estimated OCC of 83.3% | Decide whether to review pricing or strengthen demand generation first |
| Within 2 weeks | Review prices step by step, starting with high-occupancy dates, and monitor changes in booking pace | Gap to the top tier’s median settled ADR of ¥12,914 | Move gradually toward a price band that matches your rating |
| Toward next month | Top-tier properties with low occupancy should foreground highly rated room and cleanliness elements in booking-site photos and room descriptions | Estimated OCC below 83.3% | Communicate high ratings before the booking stage |
| Toward next month | Middle- and bottom-tier properties should pick the category closest to the top-quartile line and draw up an improvement plan | Price gap of about 2.0x between top and bottom tiers for room and cleanliness | Raise the rating tier to lay the groundwork for a higher price band |
The tiers and price ranges shown here are guidelines based on the prefecture-wide distribution. The appropriate level varies with your room types, location and main guest segments. Price reviews are best carried out step by step while monitoring the impact on booking pace. It is also worth tracking when weekend occupancy at Ishikawa business hotels builds up — working back from roughly 45 days before the stay date — to time these price changes.
Summary — Position Your Property on Rating, Price and Occupancy
In the Ishikawa business hotel market, settled ADR for June–August 2026 fell below the same month of the prior year three months in a row (August: ¥8,100, −4.9%). At the property level, however, review scores and prices are clearly linked: the top room-score tier (N=34 properties) sells at about 2.0x the price of the bottom tier (N=14 properties). Three yardsticks can be used in this market.
| Yardstick | What to look at | Guideline for Ishikawa business hotels |
|---|---|---|
| 1. Rating tier | Your position relative to the prefecture benchmark for room score | Bottom quartile 3.769 / median 4.07 / top quartile 4.402 |
| 2. Price tier | Your position within the settled ADR range of the same rating tier | Top tier ¥9,411–¥20,520 / middle tier ¥6,518–¥8,680 |
| 3. Occupancy check | Strength of demand before reviewing prices | Middle tier’s median estimated OCC of 83.3% |
If you are in the top tier on yardstick 1, in the middle-tier price range on yardstick 2, and at or above middle-tier occupancy on yardstick 3, your rating may not be reflected in your price — a possible “missed revenue” case. In the Ishikawa matching, 3 of 90 properties met all three conditions. We recommend checking every quarter whether your property falls into this group.
About the Data
| Estimated OCC | Occupancy based on OTA-listed inventory = 100 − 100 × OTA-listed remaining rooms ÷ total rooms. In this article it is calculated per property and limited to properties with at least six months of 80%+ observation coverage (88 of the 90 properties in the room-score matching). It is an estimate based on how OTA-sold inventory is absorbed and differs in definition from actual room occupancy (it tends to run high because rooms not listed are counted as sold). Estimated OCC in this article is a property-level monthly value (calculated from listed inventory just before the stay date) for February–August 2026. |
| Booking curve | Based on observations from 45 days before the stay date up to the most recent point. This article does not cover booking-pace trends. |
| Settled ADR | The transacted price level (tax-excluded equivalent) estimated from OTA and other sales data (lowest-plan level × segment-specific factor, ensemble of multiple channels). Past months are closed figures; current and future months are estimates based on current sales. Checked against published operating results, the median error is 6.6%. Only closed months are used in this article. Prefecture-wide values are area medians; property-level values are each property’s monthly estimates averaged over February–August 2026. |
| Review scores | Guest reviews (most recent 24 months, 5-point scale) compiled by rating category. Prefecture benchmarks are the bottom quartile, median and top quartile of property average scores. Property-level matching covers properties with at least 20 reviews in each category. |
| Breakdown of N | Prefecture-wide settled ADR: Ishikawa business hotels N=110 properties (August 2026). Prefecture benchmark (room): N=76 properties, 20,089 reviews. Property-level matching: room 90 properties / 11,763 rooms (of which 67 in Kanazawa City), cleanliness 83, location 87, service 90, breakfast 68, staff 72 properties. Estimated OCC: 88 of the 90 room-score properties. |
| Data as of | Data as of September 27, 2026. Sales conditions and inventory change daily, so figures in this article are a snapshot at the time of retrieval. |
Source: Compiled by HotelBank Editorial Team from MetroEngines Research