

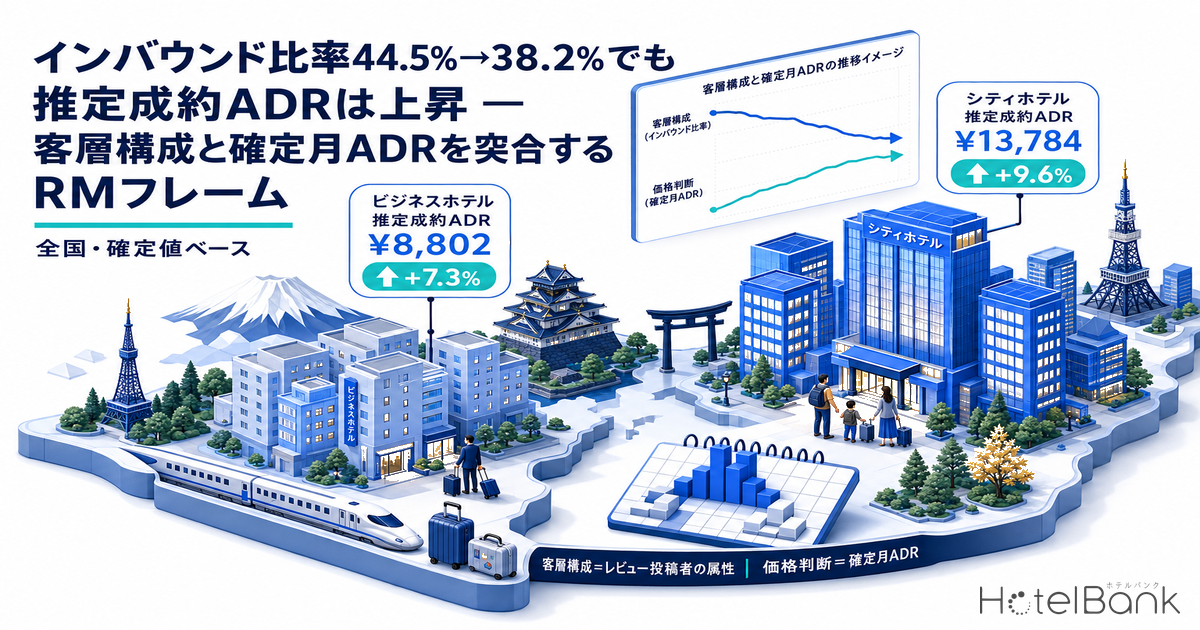
Aggregating publicly posted OTA reviews nationwide, the share of reviewers identified as inbound guests peaked at 44.5% in 2024 (n=4,915,858 reviews) and fell to 38.2% in 2025 (n=4,278,974 reviews). Over the very same period, however, settled ADR (tax-excluded equivalent, confirmed values) aggregated across all 47 prefectures rose in both segments: business hotels from ¥8,200 for full-year 2024 to ¥8,802 for full-year 2025 (+7.3%), and city hotels from ¥12,574 to ¥13,784 (+9.6%). The “share” of guest mix and the “level” of price do not necessarily move in the same direction. This article sets out, using nationwide actual data, what to look at — and what not to look at — when bringing guest-mix data into a pricing decision.
Scope: settled ADR for business hotels (N≈7,400 properties per month) and city hotels (N≈1,100 properties per month) across all 47 prefectures, plus a nationwide aggregation of publicly posted OTA reviews. The only price metric used in this article is settled ADR (an estimated transacted price level, tax-excluded equivalent, derived from OTA and similar sales data); no occupancy metric is used. Definitions appear at the end of the article. Data as of September 6, 2026.
• Settled ADR = an estimated transacted room rate (tax-excluded equivalent) calculated by applying a segment-specific adjustment coefficient to the lowest published plan rate each property lists on OTAs and similar channels (double occupancy, per-room rate). Past months are confirmed values; the current and future months are estimates based on present sales conditions, and only confirmed values are used for the comparisons in this article. Median error versus published operating results is 6.6%. These are estimates and differ from each property’s actual transacted rates and accounting figures.
• Area (prefecture) ADR is calculated from the estimated transacted rates of the covered properties, and the national figure is a weighted average of prefecture values by property count.
• Guest mix is the attribute composition of review posters, aggregated from publicly posted OTA reviews; it is not the actual share of lodging demand.
• This article covers only a price metric (settled ADR) and guest mix; no occupancy (OCC) metric is used.
• Source: MetroEngines Research (continuous tracking of published OTA rates for approximately 168,000 properties in Japan, of which approximately 27,000 are occupancy-verified)
- — The inbound share fell from 44.5% in 2024 to 38.2% in 2025, yet international visitor arrivals in 2025 reached 42,683,600, up 15.8% year on year. A falling share does not mean falling demand.
- — Settled ADR rose over the same period. On a nationally weighted basis, business hotels went from ¥8,200 to ¥8,802 (+7.3%) and city hotels from ¥12,574 to ¥13,784 (+9.6%).
- — January–July 2026 shows a slowdown. Year-on-year growth for the same period was +1.4% for business hotels and +0.2% for city hotels, with both segments below the prior year in June and July (city hotels -9.7% in July).
- — The seasonal shape has not changed in three years. What moved was the level, not the position of the peaks and troughs — so a rate revision is a matter of repositioning each month, not rebuilding the skeleton.
- — Party composition has converged to 44.7% solo and 44.4% family. But solo occupancy within business-purpose stays held flat at 89.8%, so the shift in center of gravity is happening on the leisure side of inventory.
Guest mix reversed after peaking in 2024 — but these are “review poster attributes”
First, a premise worth nailing down. The guest-mix data used here is aggregated from publicly posted OTA reviews, and represents the attribute composition of the people who wrote reviews. It is neither the actual share of lodging demand nor the guest mix of the market as a whole. Review posting rates differ substantially by nationality, age group, and travel purpose, so the level of any share cannot be cited as “the reality of the market.” What is usable is the direction of the year-on-year movement when the same aggregation method is lined up over time.
On that basis, the nationality composition shows a clear step change. The inbound share sat low at 15.4% in 2021 and 14.8% in 2022, jumped to 41.2% in 2023, peaked at 44.5% in 2024, and fell to 38.2% in 2025. The important point is that this decline does not mean “fewer international visitors.” According to Japan National Tourism Organization (JNTO) estimates, international visitor arrivals for 2025 totaled 42,683,600, up 15.8% year on year — surpassing the previous record of 36,870,148 in 2024 and setting a new annual high. The phenomenon of a rising absolute count alongside a falling share is explained either by a relative increase in reviews posted by domestic guests, or by a change in posting behavior. A falling share does not equal falling demand — that translation step must always be inserted. For how much this share differs by property segment, City Hotels: 45.9% of Guest Nights Are Foreign — Ryokan +3.7% breaks it down segment by segment.
One more note: the partial-year 2026 figure (inbound share 7.7%, n=1,677,915 reviews) is not used in this article. Reviews are posted with a lag after the stay, and the length of that lag differs by poster attributes. A partial-year figure cut mid-year is pulled strongly toward the segments that post early, so it cannot be placed on the same footing as prior full years. The 2026 figure is treated as out of scope for reference, and only completed years through 2025 are used for comparison.
| Year | Inbound share | Leisure purpose | Business purpose | Solo stays | Family stays |
|---|---|---|---|---|---|
| 2021 | 15.4% | 69.7% | 22.5% | 46.5% | 38.6% |
| 2022 | 14.8% | 73.2% | 21.0% | 46.3% | 40.7% |
| 2023 | 41.2% | 75.2% | 19.7% | 43.8% | 43.6% |
| 2024 | 44.5% | 73.1% | 22.0% | 45.6% | 42.5% |
| 2025 | 38.2% | 74.7% | 20.5% | 44.7% | 44.4% |
n (review count) for nationality composition: 3,767,088 in 2021 / 4,822,539 in 2022 / 4,723,874 in 2023 / 4,915,858 in 2024 / 4,278,974 in 2025. Purpose and party composition are limited to reviews for which attributes are available, n = 488,357 in 2021 / 739,831 in 2022 / 632,996 in 2023 / 606,085 in 2024 / 407,874 in 2025. The partial-year 2026 figure is not shown because of posting lag.
Source: MetroEngines Research, compiled by the HotelBank Editorial Team
Source: MetroEngines Research, compiled by the HotelBank Editorial Team
Composition by purpose and by party size does not move as dramatically as nationality does. Leisure purpose oscillated within a one-to-two-point range — 75.2% in 2023, 73.1% in 2024, 74.7% in 2025 — and business purpose tracked 19.7% → 22.0% → 20.5%. What is quietly changing shape is party composition: solo stays moved from 46.5% in 2021 to 44.7% in 2025, family stays from 38.6% to 44.4%, and by 2025 the two were essentially level at 44.7% solo and 44.4% family. One reasonable reading is that the center of gravity is shifting from a “fill the room with one guest” premise toward a “assume two or more guests” premise. That said, this too is review-poster based and does not substitute for the actual party composition inside the property.
Restricted to business-purpose stays, party composition barely moves at all. Among business-purpose reviews in 2025, solo stays accounted for 89.8% (n=83,714 reviews), flat against 89.6% in 2024 (n=133,066 reviews). Business inventory still centers on single-guest demand, and the rise in the family share is happening on the leisure side — that separation can be made cleanly.
Guest mix reversed, yet settled ADR rose — 2024 to 2025 on confirmed months
From here the focus moves to price. The only price metric this article handles is settled ADR, and only year-on-year comparisons between confirmed values (past months) are used. August 2026 did not have a complete set of confirmed values as of the data-retrieval date (September 6, 2026), so it is excluded from the comparison.
Settled ADR weighted by property count across all 47 prefectures went from ¥8,200 for full-year 2024 (N≈7,250 properties per month) to ¥8,802 for full-year 2025 (N≈7,310 per month) for business hotels, a rise of +7.3%. City hotels went from ¥12,574 (N≈1,085 per month) to ¥13,784 (N≈1,089 per month), a rise of +9.6%. In a year when the inbound share fell 6.3 points from 44.5% to 38.2%, the price level rose in both segments. Month by month, business hotels in 2025 posted their heaviest year-on-year gains in the back half of the year — +11.7% in October, +9.4% in November, +9.9% in August. City hotels were stronger still, with a run of double-digit months: +14.4% in September, +12.6% in November, +12.4% in August.
Source: MetroEngines Research, compiled by the HotelBank Editorial Team
Source: MetroEngines Research, compiled by the HotelBank Editorial Team
Lined up year over year, the seasonal shape itself has barely changed. Business hotels have held a form with peaks in April–May and October–November and troughs in January and June for three years running, and city hotels repeat a form that builds peaks in August and November. Even in years when guest mix moved, the relative month-by-month shape (seasonality) has not been rearranged. What moved was the level, not the shape — that is the way to read 2024 into 2025.
The first half of 2026 slowed — June and July fell below the prior year
Comparing the confirmed months of January–July 2026 against the same period a year earlier changes the picture. Business hotels came in at ¥8,671 (N≈7,434 properties per month) against ¥8,554 for the same period last year, +1.4%; city hotels at ¥13,212 (N≈1,106 per month) against ¥13,187, +0.2%. Both narrowed to roughly flat. For the first half of the year at least, the near-double-digit increases seen in 2025 are not continuing.
Settled ADR is an estimate with a median error of 6.6% against published operating results. In phases where the year-on-year change sits within a few percentage points, it is more reliable to read the sign (above or below the prior year) and whether the same direction persists across several months than to read the size of the gap itself. The +1.4% and +0.2% for January–July 2026 are treated as evidence that “growth has stopped,” not as material for evaluating absolute differences in level.
The month-by-month breakdown varies widely. Business hotels grew early in the year — +8.0% in January, +4.0% in March — but fell below the prior year in June (-3.5%) and July (-3.7%). City hotels swing harder: after a strong start at +13.7% in January, they moved clearly below the prior year through the back half — -2.0% in April, -7.8% in June, -9.7% in July. Holding summer settings in place on the belief that “it is up when you look at the full year” now means entering a phase where the gap against the market level widens.
| Month | Business 2024 | Business 2025 | Business 2026 | City 2024 | City 2025 | City 2026 |
|---|---|---|---|---|---|---|
| January | ¥7,501 | ¥7,635 | ¥8,246 | ¥11,070 | ¥11,858 | ¥13,487 |
| February | ¥7,975 | ¥8,131 | ¥8,328 | ¥11,936 | ¥12,493 | ¥13,028 |
| March | ¥8,429 | ¥8,653 | ¥8,995 | ¥12,806 | ¥13,071 | ¥13,723 |
| April | ¥8,534 | ¥9,389 | ¥9,501 | ¥13,006 | ¥14,215 | ¥13,932 |
| May | ¥8,209 | ¥9,060 | ¥9,224 | ¥12,620 | ¥13,893 | ¥13,910 |
| June | ¥7,783 | ¥8,274 | ¥7,982 | ¥11,814 | ¥12,858 | ¥11,853 |
| July | ¥8,003 | ¥8,726 | ¥8,406 | ¥12,477 | ¥13,907 | ¥12,559 |
| August | ¥8,406 | ¥9,237 | — | ¥13,539 | ¥15,214 | — |
| September | ¥7,982 | ¥8,747 | — | ¥12,128 | ¥13,870 | — |
| October | ¥8,344 | ¥9,324 | — | ¥13,148 | ¥14,730 | — |
| November | ¥8,936 | ¥9,777 | — | ¥13,623 | ¥15,338 | — |
| December | ¥8,282 | ¥8,691 | — | ¥12,698 | ¥14,023 | — |
Settled ADR (tax-excluded equivalent, confirmed values) weighted by property count across all 47 prefectures. Business hotels N=7,141–7,483 properties per month; city hotels N=1,048–1,117 properties per month. August 2026 onward is not shown because confirmed values were not complete as of the data-retrieval date.
Source: MetroEngines Research, compiled by the HotelBank Editorial Team
Before rebuilding the mix — pin down the measured breakfast-inclusive vs room-only gap
If a rising family share prompts a question like “should we weight breakfast-inclusive plans more heavily?”, the first thing to check is the measured market gap. The gap used here is a paired comparison taken only from properties that sell both a room-only and a breakfast-inclusive plan, measuring the difference within the same property. Because it is not a simple average across properties, differences in class or location do not get mixed in. Ryokan are excluded because meals are integrated into the room rate there, making the metric structurally different. Note that this gap is a separate metric from settled ADR and is not used for comparing price levels.
| Segment / party size | Breakfast-inclusive minus room-only | Gap rate | Paired properties |
|---|---|---|---|
| Business hotel / 1 guest | +¥771 | 6.0% | N=3,126 |
| Business hotel / 2 guests | +¥1,679 | 9.9% | N=3,019 |
| City hotel / 1 guest | +¥2,322 | 10.9% | N=745 |
| City hotel / 2 guests | +¥4,026 | 15.3% | N=749 |
As of September 2026. A national figure derived by aggregating, per prefecture, paired comparisons at properties that sell both a room-only and a breakfast-inclusive plan, then weighting by the number of paired properties (only prefectures with five or more paired properties are included). Ryokan excluded.
Source: MetroEngines Research, compiled by the HotelBank Editorial Team
Two things stand out. First, the gap roughly doubles with party size. Business hotels show +¥771 for one guest against +¥1,679 for two; city hotels +¥2,322 for one against +¥4,026 for two. The structure simply passes through the per-person food cost. Second, the level of the gap rate differs between segments. Against 6.0% for a business hotel single, a city hotel double is 15.3% — a 2.5-fold spread. A rising family share also means a rising weight of rooms where this “two-or-more gap” applies. Going after family demand while keeping a room-only-centric mix risks closing off the room to lift rates by one’s own hand.
For revenue managers running business and city hotels nationwide — implications and an action plan
1. Guest-mix share is material for reading direction, not grounds for pricing. In a year when the inbound share fell from 44.5% to 38.2%, settled ADR rose +7.3% for business hotels and +9.6% for city hotels. It was also a year when international visitor arrivals rose 15.8% in absolute terms. A decision to loosen your property’s rate floor on the grounds that a guest-mix share declined is not supported by the data for this period. Use share to see which segment’s composition is moving, and make judgments about price level on confirmed settled ADR — that division of roles is worth making explicit.
2. The shape of seasonality has not changed. Lined up across three years, business hotels maintain peaks in April–May and October–November with troughs in January and June, and city hotels maintain peaks in August and November. Even in a year when guest mix moved, there was no need to rebuild the skeleton of the rate-revision calendar; what needed changing was where each month’s level was set.
3. The first half of 2026 is a slowdown phase, and holding summer rates flat is the biggest risk. Year-on-year growth for January–July was +1.4% for business hotels and +0.2% for city hotels, and both segments fell below the prior year in June and July (city hotels -9.7% in July). Holding summer settings on the premise that “it is as strong as last year” puts your own rates out of step with the market level.
4. A rising family share is a signal to review single-guest-premised product design. Solo and family have come nearly level at 44.7% and 44.4%, yet within business-purpose stays solo occupancy is flat at 89.8%. In other words, the shift toward two or more guests is happening in leisure inventory. There is room to split product composition between leisure days and business days.
The following is a checklist for reviewing rate ranges and product composition when guest mix moves. Every figure is tied to the confirmed and measured values presented in this article.
| Review item | What to check | Direction of the rebuild |
|---|---|---|
| Rate range floor | Where your floor for the month sits relative to the market level for your segment (business hotels ¥8,671 / city hotels ¥13,212 for January–July 2026). Whether you have lowered the floor on the grounds of a falling guest-mix share. | Manage the floor against the trend in confirmed monthly ADR, not against guest-mix share. Consider an approach that moves the floor only in trough months (January and June for business hotels) and leaves peak-month floors untouched. |
| Rate range ceiling | Whether your ceiling was pinned in the months when the market grew in 2025 (city hotels +14.4% in September and +12.6% in November; business hotels +11.7% in October). | In months where the ceiling was pinned, there is room to raise the ceiling itself. Conversely, in months that fell below the prior year — as June–July 2026 did — consider a structure that prioritizes inventory control on the floor side over the ceiling. |
| Consecutive-night conditions | Solo stays within business-purpose demand are flat at 89.8%, while the family share on the leisure side has risen to 44.4%. Whether you can distinguish which of the two — weekday business or leisure stays — your multi-night discount is actually working on. | On the premise that character changes by day of week, there is room to narrow the applicable dates rather than applying multi-night conditions uniformly across all periods. Taking length of stay in trough months and tightening multi-night discount eligibility in peak months is one candidate structure. |
| Breakfast-inclusive vs room-only mix | Whether your own breakfast-inclusive versus room-only gap is understated relative to the market measurement (business hotels +¥771 for one guest and +¥1,679 for two; city hotels +¥2,322 for one and +¥4,026 for two). | Where the double-occupancy gap falls well short of the market measurement, there is room to revisit the gap setting by party size. The heavier the family weighting in a period, the more the breakfast-inclusive share can be increased. |
| Horizon | Action | Decision trigger | Objective |
|---|---|---|---|
| Today to this week | Line up your property’s ADR for the most recent confirmed months (June and July) against the market and check the sign of the gap | Whether your property held at or above the prior year in months when the market fell below it (business hotels -3.5% in June and -3.7% in July; city hotels -7.8% in June and -9.7% in July) | Establish your relative position in a slowdown phase |
| Today to this week | Take stock of your breakfast-inclusive versus room-only gap separately for one and two guests | Where the double-occupancy gap falls clearly below the market measurement (business hotels +¥1,679 / city hotels +¥4,026) | Close the leakage in rate as party size increases |
| Within two weeks | Redesign the applicable dates for multi-night conditions, split between leisure days and business days | The compositional divergence: solo stays within business-purpose demand flat at 89.8% while family stays have risen to 44.4% | Secure length of stay in trough months while holding rate in peak months |
| Within two weeks | Re-anchor the rate range floor to confirmed monthly ADR rather than guest-mix share | Where there is a history of loosening the floor on the grounds of the falling inbound share (44.5% → 38.2%) | Stop price from being whipsawed by share movements |
| Looking to next month | Set the ceiling for the autumn peak months in advance (October–November for business hotels; November for city hotels) | Where your ceiling was fixed even though the market grew close to double digits in the same months of 2025 (business hotels +11.7% in October and +9.4% in November; city hotels +12.6% in November) | Avoid leaving peak-month upside on the table |
| Looking to next month | Switch to an operating model that keeps the skeleton of the rate-revision calendar and swaps only the level for each month | The fact that the positions of seasonal peaks and troughs have not changed across three years (business hotels peak in April–May and October–November, trough in January and June) | Focus revision work on the debate about level rather than shape |
Summary — three yardsticks for bringing guest-mix data into pricing
Yardstick 1: Always separate share from absolute counts. The inbound share among review posters fell from 44.5% in 2024 to 38.2% in 2025, yet international visitor arrivals that year totaled 42,683,600, up 15.8%. Share is material about composition; absolute counts and price are confirmed with different metrics.
Yardstick 2: Judge price only between confirmed months. From full-year 2024 to full-year 2025, business hotels were +7.3% and city hotels +9.6%; for January–July 2026 the year-on-year figures were +1.4% and +0.2%. The moment an unconfirmed month is mixed in, it becomes impossible to tell growth from slowdown.
Yardstick 3: Separate a change in shape from a change in level. Across the three years in which guest mix moved, the monthly peaks and troughs were not rearranged. In practice, revision work is best split into separate reviews: one for the skeleton of the calendar (shape) and one for where each month is set (level).
Metric Definitions Used in This Article
- Settled ADR: an estimated transacted price level (tax-excluded equivalent) derived from OTA and similar sales data (lowest published plan rate × segment coefficient, ensembled across multiple channels). Past months are confirmed values; the current and future months are estimates based on present sales conditions. Median error versus published operating results is 6.6%. Only confirmed values are used for comparison in this article, and unconfirmed months are not shown.
- Coverage N: all 47 prefectures. Business hotels N=7,141–7,483 properties per month; city hotels N=1,048–1,117 properties per month. The national figure is calculated as a weighted average of each prefecture’s settled ADR by property count.
- Guest mix: aggregated from publicly posted OTA reviews; it is the attribute composition of review posters, not the actual share of lodging demand. n for nationality composition ranges from 3,767,088 reviews in 2021 to 4,278,974 in 2025. Purpose, party, and age composition are limited to reviews for which attributes are available, n=407,874 in 2025. Age composition skews toward the segments that write reviews, so it sits older than the actual age composition of guests. The partial-year 2026 figure is treated as out of scope for reference because of the strong influence of posting lag, and is not used in the comparisons in this article.
- Meal-plan gap: extracted only from properties that sell both a room-only and a breakfast-inclusive plan, comparing the difference within the same property as a pair. Aggregated by prefecture and weighted by the number of paired properties (only prefectures with five or more paired properties are used). Ryokan are excluded because meals are integrated into the room rate. As of September 2026. This is a gap metric on a separate basis from settled ADR and is not used for comparing price levels.
- This article covers only a price metric (settled ADR) and guest mix; no occupancy metric is used.
- Data as of September 6, 2026. Sales conditions and inventory change daily, so the figures in this article are a snapshot at the time of retrieval.
References and Sources
- Japan National Tourism Organization (JNTO), “Foreign Visitors to Japan (December 2025 estimate)” — 42,683,600 international visitor arrivals in 2025 (up 15.8% year on year); 36,870,148 in 2024
- Japan National Tourism Organization (JNTO), “Foreign Visitor Statistics”