

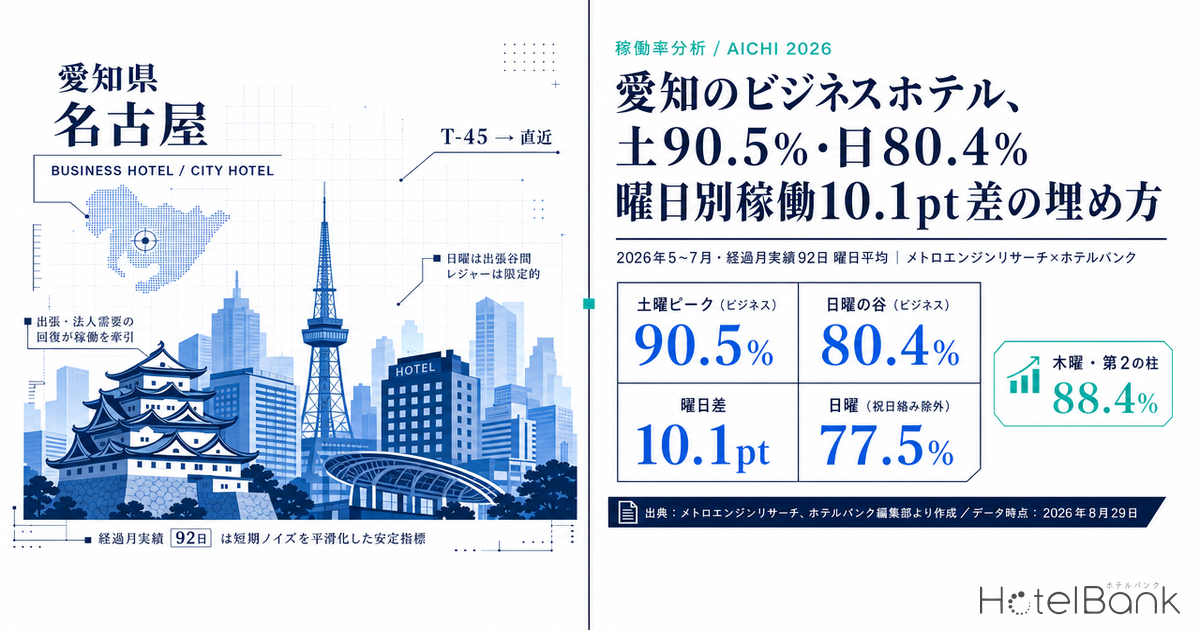
When the estimated occupancy of business hotels in Aichi (OTA-listed-inventory basis) is averaged by day of the week across the 92 month-to-date days from May to July 2026, Saturday comes in at 90.5% against 80.4% on Sunday — a gap of 10.1pt. City hotels show the same shape, at 89.6% on Saturday and 80.0% on Sunday, a 9.6pt spread. Re-aggregating after excluding the nine holiday-affected days pushes the business-hotel Sunday figure down to 77.5%, widening the gap versus Saturday to 12.2pt. Aichi’s weekly cycle is asymmetric — a Saturday peak and a Sunday trough — and left alone, that trough does not fill in even at the last minute. This article visualizes that structure with day-of-week occupancy data and sets out the practical steps for filling the Sunday trough.
Scope: business hotels in Aichi (daily N = 272–298 properties) and city hotels in Aichi (daily N = 28–30 properties). The price metric in this article is estimated settled ADR (the settled price level estimated from OTA and other sales data, tax-excluded equivalent); occupancy is an estimate on an OTA-listed-inventory basis. Definitions for both appear at the end of the article. Data as of August 29, 2026.
- — Sat 90.5% vs Sun 80.4%, a 10.1pt gap — Aichi business hotels peak on Saturday and trough on Sunday. City hotels show the same pattern at 89.6% vs 80.0%, a 9.6pt spread (May–July 2026, 92 days).
- — Excluding holidays, Sunday falls to 77.5% — Across the 83 days that remain after removing nine holiday-affected days, the business-hotel Sunday figure drops to 77.5% and the Saturday–Sunday gap widens to 12.2pt. A Sunday inside a long weekend and an ordinary Sunday are different products.
- — Thursday at 88.4% is the second weekday peak — It runs 4.9pt above Monday’s 83.5%, and the share of properties with no listed inventory observed reaches 20.5%. Treating all weekdays alike means leaving Thursday on the table.
- — Sunday’s landing point is set at T-45 — From 45 days out to the most recent observation, Saturday adds +6.5pt against Sunday’s +3.2pt. The trough cannot be filled by last-minute inventory adjustments.
Aichi’s weekly cycle — a Saturday peak, a Sunday trough, and Thursday as the second pillar
Start with the overall picture. For the 92 days from May 1 to July 31, 2026, we took a simple average of Aichi’s daily estimated OCC (OTA-listed-inventory basis) by day of the week. The period average is 86.1% for business hotels and 84.3% for city hotels.
By day of week, business hotels run Mon 83.5% / Tue 86.3% / Wed 86.7% / Thu 88.4% / Fri 87.1% / Sat 90.5% / Sun 80.4%. City hotels come in at Mon 81.8% / Tue 83.5% / Wed 83.4% / Thu 85.9% / Fri 85.6% / Sat 89.6% / Sun 80.0%. In both categories the peak falls on Saturday and the trough on Sunday.
Source: MetroEngines Research; compiled by the HotelBank Editorial Team
What deserves attention is that this shape is neither “weekend-led” nor “weekday-led.” Lodging demand in Aichi, centered on Nagoya, has a two-layer structure in which manufacturing-driven business demand overlaps with weekend leisure and event demand. The result is that while the occupancy peak stands on Saturday, the weekday side also forms a second pillar on Thursday at 88.4% for business hotels — second only to Saturday. Thursday runs 4.9pt above Monday. Build a calendar on the assumption that “weekdays are uniformly soft” and you end up carrying both missed Thursday demand and unsold Monday inventory at the same time. A Thursday peak is not unique to Aichi; the same shape has been observed in Hiroshima, another market driven by business-travel demand.
| Day | Business hotels Estimated OCC | City hotels Estimated OCC | Excl. holiday-affected (business hotels) | Share of properties with no listed inventory observed (business hotels, estimated) |
|---|---|---|---|---|
| Mon | 83.5% | 81.8% | 82.6% | 11.5% |
| Tue | 86.3% | 83.5% | 86.3% | 13.6% |
| Wed | 86.7% | 83.4% | 88.1% | 17.5% |
| Thu | 88.4% | 85.9% | 88.4% | 20.5% |
| Fri | 87.1% | 85.6% | 87.2% | 14.9% |
| Sat | 90.5% | 89.6% | 89.7% | 25.1% |
| Sun | 80.4% | 80.0% | 77.5% | 13.5% |
Day-of-week averages over the 92 month-to-date days from May to July 2026 (83 days for the holiday-excluded column). Source: MetroEngines Research; compiled by the HotelBank Editorial Team
The rightmost column shows the estimated share of properties whose listed inventory could no longer be observed on OTAs and similar channels for that date. It climbs to 25.1% on Saturday and 20.5% on Thursday, while Sunday stays at just 13.5%. In other words, Sunday looks less like a day when “the whole market is thin” and more like a day when many properties reach the arrival date still holding listed inventory. The depth of the trough and the number of properties failing to fill it point in the same direction.
Strip out the holidays and the trough is deeper — what sits behind Sunday’s 80.4%
The 80.4% Sunday average for business hotels is in fact propped up by public holidays. Of the 13 Sundays in the period, May 3 stands out at 97.8% and July 19 at 95.2%. Both are Sundays in the middle of a long weekend with a holiday the following day, and in character they sit closer to a Saturday. Re-aggregating over the 83 days that remain after excluding the nine holiday-affected days that include those two dates brings the business-hotel Sunday figure down to 77.5% and the city-hotel Sunday figure to 77.6%. The gap versus Saturday widens to 12.2pt for business hotels and 11.0pt for city hotels.
Put the other way round, a Sunday inside a long weekend and an ordinary Sunday are entirely different products. Across the 11 ordinary Sundays in the period, estimated OCC falls within a range of 73.4% to 83.0%, with the lowest reading on July 5 at 73.4%. Rather than writing rules that lump the day of the week together, making “is the next day a holiday or not?” the first switch follows Aichi’s actual data far more naturally. On how far a Sunday followed by a public holiday can spike, Aichi Day-of-Week OCC: Sunday 12.6pt Below Saturday on 92-Day Data cuts the same 92 days of data on a different exclusion basis (excluding public holidays and the days before them), and reading the two together makes the outline of the trough easier to grasp.
Source: MetroEngines Research; compiled by the HotelBank Editorial Team
Viewed month by month, the depth of the trough varies. The business-hotel Sunday figure runs 82.7% in May, 76.2% in June and 81.9% in July, with June the deepest. Thursday, by contrast, barely moves at 88.1% in May, 89.2% in June and 88.0% in July. The relationship is clear: the weaker the month’s demand, the more selectively Sunday alone gives way. The trough is not a case of “seasonal factors pulling every day of the week down evenly” — it concentrates on Sunday. Turned around, that also means that when monthly occupancy falls short of plan, the largest room for improvement sits on Sunday.
The Sunday trough will not fill at the last minute — asymmetry seen through the booking curve
To see when the day-of-week gap actually forms, we look at the cumulative build for each stay date (the booking curve). The chart below plots estimated OCC for business hotels in Aichi on Saturday, September 12 and Sunday, September 13, from 45 days before the stay date through to the most recent observation.
Source: MetroEngines Research; compiled by the HotelBank Editorial Team
At 45 days out, Saturday sits at 76.1% and Sunday at 74.6% — a gap of only 1.5pt. From there, however, Saturday builds to 82.6% by the most recent observation (17 days out), adding +6.5pt, while Sunday stops at 77.8%, adding just +3.2pt. Over the same 45 days Saturday picks up roughly twice as much as Sunday, and the gap consequently widens more than threefold, from 1.5pt to 4.8pt.
The same picture holds for a second pair of dates. Saturday, September 5 grew from 85.4% at 45 days out to 89.8% at the most recent observation (9 days out), a gain of +4.4pt, while Sunday, September 6 moved from 78.9% to 80.0%, up just +1.1pt. The Sunday curve is close to flat, carrying the level set 45 days out straight through to the arrival date.
This carries a very important implication for revenue management. A shortfall on Sunday cannot be recovered through last-minute inventory adjustments. Saturday builds over the final 45 days whether or not anyone intervenes, but for Sunday the bookings already on the books 45 days out are effectively the landing level. Sunday measures therefore need to be weighted toward “steps taken earlier than 45 days out, designed as an extension of Saturday” rather than “picking up demand on last-minute value pricing.” In a market where Saturday builds all the way to 90.5%, whether you have a design in place to capture the adjacent night is the dividing line.
The price backdrop — how estimated settled ADR moved in the confirmed months
Before turning to the day-of-week discussion, it is worth fixing the price backdrop on a monthly basis. Confirmed estimated settled ADR (tax-excluded equivalent) for business hotels in Aichi was ¥8,200 in May 2026, ¥7,300 in June and ¥7,500 in July (N = 328 / 324 / 323 properties), up 2.0% year on year in May, down 0.1% in June and down 1.2% in July. City hotels came in at ¥13,400 in May, ¥11,500 in June and ¥11,500 in July (N = 30 properties), up 11.8% year on year in May, down 2.0% in June and down 1.9% in July.
| Confirmed month | Business hotels Estimated settled ADR | YoY | City hotels Estimated settled ADR | YoY |
|---|---|---|---|---|
| May 2026 | ¥8,200 (N=328) | +2.0% | ¥13,400 (N=30) | +11.8% |
| June 2026 | ¥7,300 (N=324) | -0.1% | ¥11,500 (N=30) | -2.0% |
| July 2026 | ¥7,500 (N=323) | -1.2% | ¥11,500 (N=30) | -1.9% |
Year-on-year comparison between confirmed values (past months). Source: MetroEngines Research; compiled by the HotelBank Editorial Team
Business hotels are running roughly flat year on year, while city hotels, after a strong May, sit marginally below last year in June and July. With occupancy at a high 86.1% for business hotels and rates only flat year on year, the market as a whole looks close to a state of “volume is moving, but the headroom in rate is not being fully captured.” Note that estimated settled ADR uses the month as its canonical granularity, so day-of-week price levels are not covered in this article. Running the day-of-week discussion purely on the occupancy axis and tying price decisions to monthly levels is the use that fits the nature of the data.
For revenue managers running business and city hotels in Aichi — implications and an action plan
(1) Overlay your own day-of-week profile on the market’s “Sat 90.5% / Sun 80.4%.” Start by averaging your own occupancy over the past three months by day of week and comparing the shape with the market. Whether the gap opens on Saturday or on Sunday changes the response entirely. If you are losing to the market on Saturday, the issue is most likely how price and inventory are being released; if you are losing only on Sunday, it is better treated as a question of stay design (consecutive nights, check-out time, breakfast). Because the market’s Sunday falls to 77.5% once holiday-affected dates are removed, your own Sunday running in the 70s is not in itself immediate grounds for calling it weak — the benchmark should be the market level on the same basis.
(2) Stop counting Thursday at 88.4% as a “weekday.” In Aichi’s business-hotel market Thursday runs second only to Saturday, and the share of properties with no listed inventory observed reaches 20.5%, the highest of any weekday. Run it on the same price and the same minimum-length-of-stay rules as Monday at 83.5% and Thursday easily becomes missed demand. Simply splitting weekdays into two groups — “Mon–Tue” and “Wed–Fri” — sharpens the calendar considerably.
(3) For Sunday, the decisive window is 45 days out. As the booking curve shows, Sunday, September 13 built only +3.2pt, from 74.6% at 45 days out to 77.8% at the most recent observation. Saturday grew +6.5pt over the same window. Trying to move Sunday inventory at the last minute on value pricing yields limited volume, because the market as a whole is not moving at that point. Treat Sunday’s landing level as largely set at T-45, and there is room to bring the timing of your measures forward.
(4) The trough deepens in months when demand is weak. The business-hotel Sunday figure falls to 76.2% in June, while Thursday barely moves across May to July, holding between 88.0% and 89.2%. In the months most at risk of missing budget, the shortfall shows up concentrated on Sunday. When considering how to close a monthly occupancy gap, concentrating effort on Sunday fits the market structure better than spreading it thinly across every day of the week.
(5) Judge rate on a monthly basis. Confirmed estimated settled ADR for business hotels sits at ¥7,300 in June and ¥7,500 in July, roughly flat year on year. Rather than using day-of-week occupancy gaps directly as grounds for rate differentials, check where your property stands against the monthly market level first, and use the day of the week as the axis for inventory and stay rules.
The action plan below organizes the above by time horizon. All of it is presented as opportunity, not as a guarantee of results. Select from it in light of your own booking mix and location characteristics.
| Time horizon | Action | Decision trigger | Objective |
|---|---|---|---|
| Today to this week | Average your own occupancy over the past three months by day of week and line it up against the market’s Sat 90.5% / Sun 80.4% (business hotels) and Sat 89.6% / Sun 80.0% (city hotels) | If your own Saturday–Sunday gap exceeds the market’s 10.1pt (business hotels) | Separate whether the trough is a market factor or a property-specific one |
| Today to this week | Identify the dates where a minimum length of stay (MLOS) is set on Saturday, and consider lifting it for weeks in which Sunday is a trough | If Sunday in the same week is sitting near the bottom of the market’s ordinary-Sunday range (73.4–83.0%) | Capture single-night demand without leaking the Saturday peak |
| Within two weeks | Design the Saturday–Sunday consecutive-night plan as “two nights starting Saturday,” adding stay value such as an extended Sunday check-out time | In weeks where Saturday builds to around 90% while the following Sunday sits below 80% | Extend Saturday demand into the Sunday side |
| Within two weeks | Split the weekday calendar into “Mon–Tue” and “Wed–Fri,” and move Thursday to treatment comparable to Saturday | If your own Thursday runs well below the market’s 88.4% (business hotels) | Reduce missed demand at the second weekday peak |
| Toward next month (from T-45) | Classify Sundays through the month after next into “long-weekend Sundays” and “ordinary Sundays,” treating the former like Saturday and designing inventory and plans for the latter as an independent product | If, at 45 days before the target date, your own Sunday pickup is 10pt or more below your Saturday in the same month | Avoid running two Sundays of different character on the same rules |
| Toward next month (from T-45) | Bring forward the timing of Sunday-facing sales measures (consecutive-night incentives, segment-specific distribution) to earlier than T-45 | If your own Sunday curve is as flat as the market’s +3.2pt (45 days out to most recent) | Fill a trough that cannot be recovered late, before the landing level is set |
Source: MetroEngines Research; compiled by the HotelBank Editorial Team
Summary — three yardsticks for reading Aichi’s week
Yardstick 1: the trough is Sunday, the peak is Saturday, and the second pillar is Thursday. Aichi business hotels run Sat 90.5% / Sun 80.4%, a 10.1pt gap; city hotels run 89.6% / 80.0%, a 9.6pt gap. Thursday at 88.4% (business hotels) is second only to Saturday, and not lumping weekdays together is the first step. The position of the weekly peaks and troughs differs by market, and some markets are thickest from Tuesday to Thursday (Hokkaido Business Hotels Aren’t Weekend-Led).
Yardstick 2: an “ordinary” Sunday and a “long-weekend” Sunday are different things. Excluding the nine holiday-affected days brings the business-hotel Sunday figure down to 77.5% and widens the gap versus Saturday to 12.2pt. The 11 ordinary Sundays span a range of 73.4% to 83.0%. Make “is the next day a holiday?” the first switch.
Yardstick 3: Sunday’s landing point is set at T-45. From 45 days out to the most recent observation, Saturday adds +6.5pt against Sunday’s +3.2pt, and the gap widens from 1.5pt to 4.8pt. Sunday measures should be designed as groundwork laid earlier than 45 days out, not as last-minute action.
Aichi is a market with a high absolute level of occupancy. That is precisely why the fact that one day out of seven sits structurally 10pt lower carries weight that cannot be ignored against monthly RevPAR. Whether Sunday is accepted as a “weak day” or treated as “something to be redesigned as an extension of Saturday” changes where the month lands, even in the same market environment.
About the data
■ Data sources
• Breakdown of N: day-of-week estimated OCC covers business hotels in Aichi (daily N = 272–298 properties) and city hotels in Aichi (daily N = 28–30 properties) over the 92 month-to-date days from May 1 to July 31, 2026 (83 days for the holiday-excluded aggregation). Estimated settled ADR covers business hotels in Aichi at N = 323–328 properties and city hotels at N = 30 properties. The booking curve covers business hotels in Aichi for stay dates September 5, 6, 12 and 13, 2026.
■ Calculation assumptions
• Definition of estimated OCC: occupancy on an OTA-listed-inventory basis = 100 − 100 × rooms still listed on OTAs ÷ total rooms. It is an estimate based on how listed inventory is being sold down on OTAs, and its definition differs from actual room occupancy (it reads higher). This article labels it “estimated OCC (OTA-listed-inventory basis).”
• Definition of “share of properties with no listed inventory observed”: the estimated share of properties whose OTA listed inventory could no longer be observed on that date. It is a property-level listing-status metric and differs by definition from an actual sold-out or full-house rate.
• Booking curve: based on observations from 45 days before the stay date through to the most recent reading (to compare Saturday and Sunday on the same lead-time cross-section, both dates are aligned from 45 days out to 17 days out).
• Definition of estimated settled ADR: the settled price level (tax-excluded equivalent) estimated from OTA and other sales data (lowest-plan level × category-specific coefficient, ensembled across multiple channels). Past months are confirmed values; the current and future months are estimates based on sales conditions at the time. Median error against published operating results is 6.6%. Every figure cited in this article is a confirmed value (past month), and the year-on-year comparisons are between confirmed values.
• The nine days excluded as holiday-affected: May 1–6 and July 18–20, 2026.
■ Limitations and caveats
• Because estimated settled ADR uses the month as its canonical granularity, day-of-week price levels are not covered in this article. All day-of-week analysis runs on the occupancy (OCC) axis.
• Data as of August 29, 2026. Sales conditions and inventory change daily, so the figures in this article are a snapshot as of the retrieval date.
Frequently asked questions
Q. Which day of the week has the highest occupancy for business hotels in Aichi?
A. Averaging the 92 month-to-date days from May 1 to July 31, 2026 by day of week, estimated OCC (OTA-listed-inventory basis) is highest on Saturday at 90.5%, followed by Thursday at 88.4% and Friday at 87.1%. The period average is 86.1% (daily N = 272–298 properties).
Q. How much lower is Sunday occupancy?
A. Sunday runs 80.4%, a gap of 10.1pt versus Saturday. That average is, however, propped up by Sundays inside long weekends (May 3, 2026 at 97.8% and July 19 at 95.2%); re-aggregating over the 83 days that remain after excluding the nine holiday-affected days brings Sunday down to 77.5% and widens the gap versus Saturday to 12.2pt. The 11 ordinary Sundays span a range of 73.4% to 83.0%.
Q. Can Sunday vacancies be filled by last-minute selling?
A. In the booking curve for business hotels in Aichi, the build from 45 days before the stay date to the most recent observation is +6.5pt on Saturday (76.1% → 82.6%) against just +3.2pt on Sunday (74.6% → 77.8%), and the gap widens from 1.5pt to 4.8pt. Because Sunday’s landing level is largely set as of 45 days out, it is structurally hard to recover through last-minute inventory adjustments.
Q. Can Thursday be run the same way as other weekdays?
A. Thursday, at 88.4%, is the second peak after Saturday and runs 4.9pt above Monday’s 83.5%. The share of properties with no listed inventory observed on that date is also the highest of any weekday, at 20.5%. Simply splitting weekdays into two groups — “Mon–Tue” and “Wed–Fri” — raises the resolution of the calendar.
Q. Do city hotels show the same day-of-week shape?
A. City hotels also run Sat 89.6% / Sun 80.0%, a 9.6pt gap, with peaks and troughs in the same positions as business hotels. The period average is 84.3% (daily N = 28–30 properties). Across the 83 days excluding holiday-affected dates, Saturday is 88.6% and Sunday 77.6%, widening the gap to 11.0pt.
Q. What level is estimated settled ADR in Aichi?
A. Confirmed estimated settled ADR (tax-excluded equivalent) for business hotels was ¥8,200 in May 2026, ¥7,300 in June and ¥7,500 in July (N = 328 / 324 / 323 properties), up 2.0% / down 0.1% / down 1.2% year on year. City hotels came in at ¥13,400, ¥11,500 and ¥11,500 (N = 30 properties). Because estimated settled ADR uses the month as its canonical granularity, day-of-week price levels are not covered in this article.
Related reading
- Aichi Day-of-Week OCC: Sunday 12.6pt Below Saturday on 92-Day Data
- Asian Games 2026: Toyohashi +18.7pt, Kuwana +14.4pt Beyond Nagoya
- Hokkaido Business Hotels Aren’t Weekend-Led: Thu 95.4% Ties Sat 95.4%
- Saitama Business Hotels: Sat 77.2% vs Sun 70.1%, Gap Widens to 11pt
- Kyoto Day-of-Week OCC: Thursday 90.4% Edges Friday, May–Jul 2026
- Fukui Ryokan Sat 90.9% vs Mon 76.3%: Business Hotels Dip on Sunday