

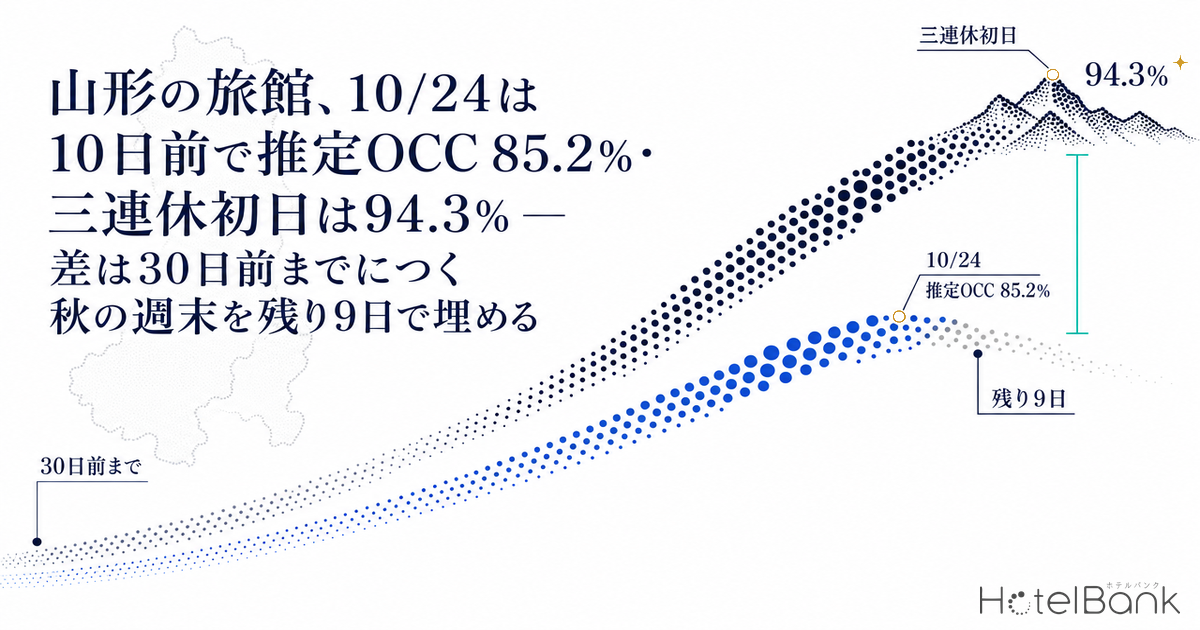
The HotelBank Editorial Team lined up booking curves for 110 ryokan (2,910 rooms) in Yamagata Prefecture using observations through October 14, 2026. Saturday, October 10, the first day of the three-day weekend, had built up to an estimated OCC (based on OTA-listed inventory) of 94.3% at 10 days before the stay date. Saturday, October 24 stood at 85.2% at the same 10-day mark, a gap of 9.1pt. Saturday, October 17 was also only at 85.7% three days out, 12.4pt short of the 98.1% the long-weekend opener had reached at the same three-day mark. The shape has changed from mid-September, however, when curves were “nearly flat from 45 days out”: Oct 24 has added 14.6pt from 70.6% at 45 days out, and Oct 17 added 18.6pt from 67.1%, showing that autumn weekend bookings arrive in a burst once the stay date is inside 30 days. This article compares the four stay dates for ryokan and business hotels, the September–October weekend landing levels, the distribution of remaining inventory for Oct 24, and estimated settled ADR year on year, then sets out what to revisit over the remaining nine days with Oct 24 as the target date, and what to prepare at T-45, T-30 and T-14 for November weekends.
Scope: Yamagata Prefecture ryokan, N=110 properties (2,910 rooms); business hotels for comparison, N=23 properties (1,989 rooms). Each is a fixed cohort with the same set of properties on every stay date. The price metric in this article is estimated settled ADR (a settled price level inferred from sales data such as OTAs, approximately tax-exclusive), and occupancy is an estimate based on OTA-listed inventory. Definitions for both appear at the end of this article. Data as of: October 15, 2026 (latest booking curve observation: October 14).
- — A 9.1pt gap at the same 10 days out: ryokan for Oct 24 (Sat) were at an estimated OCC of 85.2% (observed October 14, 2026; N=110 properties), short of the 94.3% that the long-weekend opener Oct 10 had at the same point.
- — The gap opened by 30 days out: the difference between the two dates went from 4.8pt at 45 days out to 9.7pt at 30 days out, then 9.1pt at 10 days out. Once inside 30 days, the pace of pickup was nearly the same as for the long-weekend opener.
- — The curve shape differs by segment: business hotels (N=23 properties, 1,989 rooms) added +14–15pt on each Saturday between 45 and 30 days out, while ryokan for Oct 24 added only +4.7pt over the same window.
- — Three landing bands as a yardstick: in September–October, ryokan landed at 89–95% on regular Saturdays, 80–84% on regular Sundays and around 99% on holiday weekends (observed the day before the stay). Oct 25 (Sun) had already reached the bottom of the regular-Sunday band 11 days out.
- — Remaining inventory sits mostly with small and mid-sized properties, and rates have held: for Oct 24, unsold properties with 20 rooms or fewer numbered 47 (about 156 rooms), and those with 21–50 rooms numbered 23 (about 143 rooms). Estimated settled ADR for September (finalized) was +5.5% year on year.
Oct 10 vs Oct 24: a 9.1pt Gap at 10 Days Out — Booking Curves for 110 Ryokan
First, we overlay the four ryokan stay dates on a common days-before-arrival axis. Oct 10 (Sat), the first day of the three-day weekend, built up without interruption at every stage: 75.4% at 45 days out, 85.0% at 30 days, 92.4% at 14 days, 94.3% at 10 days and 99.5% the day before. That is +9.6pt over the 15 days from 45 to 30 days out, and +14.5pt from 30 days out to the day before. Oct 24 (Sat), by contrast, was at 70.6% at 45 days out, 75.3% at 30 days, 84.7% at 14 days and 85.2% at the latest reading, 10 days out. Its gain from 45 to 30 days out was +4.7pt, half that of the long-weekend opener, and it is now catching up with +9.9pt from 30 days out to the latest reading.
The key point is that the gap between the two dates widened from 4.8pt at 45 days out to 9.7pt at 30 days out, and has held roughly flat at 9.1pt at 10 days out. In other words, the gap opened in the window up to 30 days out; once inside 30 days, the pace of pickup is not much different from the long-weekend opener. Oct 17 (Sat) shows the same pattern: 67.1% at 45 days out, 73.1% at 30 days (+6.0pt), 81.5% at 14 days and 85.7% at 3 days. Its gain inside 30 days reached +12.6pt, yet it is still 12.4pt short of the 98.1% the long-weekend opener showed at 3 days out. Sunday, Oct 25 moved on a gentler slope than the Saturdays: 71.6% at 45 days out, 75.3% at 30 days and 80.8% at 11 days, a gain of +9.2pt from 45 days out. Within the same prefecture, our booking curve analysis of the Yamagata Hanagasa Festival 2026 showed that the summer festival’s demand uplift was almost complete by 45 days out; autumn weekends build up at a different time altogether.
Source: MetroEngines Research; compiled by the HotelBank Editorial Team
Table 1: Fixed-point estimated OCC for Yamagata Prefecture ryokan (N=110 properties, 2,910 rooms). Latest readings observed October 14 (Oct 10 only: observed October 9, the day before the stay). Sold-out share is the share of properties with no listed inventory found on OTAs etc. at that point (estimated).
| Stay date | 45 days out | 30 days out | 14 days out | Latest (days out) | 45 days out → latest | Sold-out share (latest) |
|---|---|---|---|---|---|---|
| Oct 10 (Sat, long-weekend day 1) | 75.4% | 85.0% | 92.4% | 99.5% (1 day) | +24.1pt | 94.5% |
| Oct 17 (Sat) | 67.1% | 73.1% | 81.5% | 85.7% (3 days) | +18.6pt | 36.4% |
| Oct 24 (Sat) | 70.6% | 75.3% | 84.7% | 85.2% (10 days) | +14.6pt | 33.6% |
| Oct 25 (Sun) | 71.6% | 75.3% | 79.6% | 80.8% (11 days) | +9.2pt | 24.5% |
Source: MetroEngines Research; compiled by the HotelBank Editorial Team
The gap in sold-out share is also large. For the long-weekend opener, 94.5% of properties had no listed inventory the day before the stay; for Oct 24 the figure is 33.6% at 10 days out, and for Oct 17 it is 36.4% at 3 days out. Even with estimated OCC in the mid-80s, two-thirds of properties still have rooms left, which suggests more selling room over the remaining nine days than the headline figure implies.
Business Hotels Add 14pt by 30 Days Out — How Their Curve Differs from Ryokan
Looking at the same four dates for 23 business hotels (1,989 rooms), the curve shape is clearly different from ryokan. Oct 10 rose +14.0pt from 79.0% at 45 days out to 93.0% at 30 days, Oct 17 +14.9pt from 59.6% to 74.5%, and Oct 24 +14.4pt from 63.2% to 77.6%: almost the same increment in the 45-to-30-day window regardless of whether the date fell on a long weekend. Compared with ryokan over the same window (+9.6pt for Oct 10, +4.7pt for Oct 24), this reflects a difference in how demand arrives: business and corporate demand for business hotels comes in steadily up to 30 days out, while leisure demand for ryokan on autumn weekends arrives in bulk once inside 30 days.
A gap remains at the latest readings too. At 10 days out for Oct 24, business hotels were at 89.8% versus 85.2% for ryokan, a 4.6pt difference; at the same 10-day mark for Oct 10, the figures were 99.6% and 94.3%, a 5.3pt difference. For Sunday Oct 25, business hotels were at 50.2% at 45 days out, 58.5% at 30 days and 68.0% at 11 days, below ryokan (80.8%): on Sundays, when corporate demand is thin, ryokan have the upper hand. In Yamagata Prefecture, then, a day-of-week split is already visible in the curves: business hotels fill first on Saturdays, while ryokan are relatively stronger on Sundays. How inventory absorption among the prefecture’s business hotels splits at property level into three types, including early-absorption and last-minute types, is covered in detail in our inventory absorption analysis of 38 business hotels in Yamagata.
Source: MetroEngines Research; compiled by the HotelBank Editorial Team
A Landing Yardstick — Where September–October Weekends Finally Settled
As a yardstick for how far Oct 24 can go from 85.2% in the remaining nine days, we line up the landing levels of weekends from September to early October (estimated OCC observed the day before the stay). Ryokan Saturdays landed at 91.5% on 9/5, 94.5% on 9/12, 89.6% on 9/26 and 91.6% on 10/3: Saturdays outside holiday periods landed in an 89–95% band. Holiday dates, by contrast, filled to around 99%: 99.2% on 9/19 (Sat, first day of the five-day holiday), 99.9% on 9/20 (Sun), 99.4% on 9/21 (Mon, holiday), 97.5% on 9/22 (Tue), 99.5% on 10/10, the first day of the three-day weekend, and 97.3% on 10/11 (Sun). Regular Sundays were in an 80–84% band: 81.3% on 9/6, 80.2% on 9/13, 84.0% on 9/27 and 83.3% on 10/4.
The long-weekend opener added +5.2pt from 94.3% at 10 days out to 99.5% the day before. Given that regular Saturdays land in the 89–95% band, Oct 24, at 85.2% with 10 days to go, sits on the boundary between entering the regular-Saturday band and approaching holiday levels. Oct 25 (Sun), at 80.8%, has already reached the bottom of the regular-Sunday band, suggesting its level is settling earlier than Saturday’s. In neighboring Fukushima Prefecture, ryokan for the same Oct 24 were at 87.5% at 12 days out, 8.3pt below the long-weekend opener at the same point, so the same gap between a foliage-season Saturday and a long-weekend opener also appears there.
Table 2: Landing estimated OCC for Yamagata Prefecture ryokan on weekends and holidays (observed the day before the stay). N=108–117 properties per date (the number of observed properties in the fixed cohort varies by date). Sold-out share is from the monthly aggregation cross-section, which differs from the latest observation in Table 1, so values for the same date differ slightly (Oct 10: 94.5% in Table 1, 95.8% in this table).
| Stay date | Type | Est. OCC (day before) | Sold-out share |
|---|---|---|---|
| Sep 5 (Sat) | Regular Saturday | 91.5% | 65.3% |
| Sep 12 (Sat) | Regular Saturday | 94.5% | 68.2% |
| Sep 19 (Sat) | Five-day holiday, day 1 | 99.2% | 93.5% |
| Sep 20 (Sun) | Five-day holiday, day 2 | 99.9% | 98.8% |
| Sep 26 (Sat) | Regular Saturday | 89.6% | 60.6% |
| Oct 3 (Sat) | Regular Saturday | 91.6% | 66.3% |
| Oct 10 (Sat) | Three-day weekend, day 1 | 99.5% | 95.8% |
| Oct 11 (Sun) | Three-day weekend, day 2 | 97.3% | 85.6% |
| Sep 27 (Sun) / Oct 4 (Sun) | Regular Sunday | 84.0% / 83.3% | 56.9% / 52.7% |
Source: MetroEngines Research; compiled by the HotelBank Editorial Team
It is also worth checking the demand context of peak autumn foliage. The foliage status updated by the Yamagata City Tourism Association on October 15, 2026 lists Zao Onsen town as “at peak” (typical peak: mid-to-late October); Dokko-numa and the Torikabuto Station area of the Zao Chuo Kogen plateau, as well as the Kanshodaira and Iroha-numa area, also “at peak”; the Jizo-dake summit area already “leaves fallen”; Yamadera “just beginning to turn” (typical peak: late October to early November); and Nishi-Zao “40–50% colored.” Oct 24–25 is a weekend where the latter half of the Zao Onsen peak overlaps with the progression of color at Yamadera, which puts it in a favorable position in terms of in-prefecture demand context.
Where Is Oct 24’s Remaining Inventory? — Distribution by Property Size
Next, we break down Oct 24’s remaining inventory by property. Here we anonymously aggregated the distribution of remaining inventory as of October 15 for 104 ryokan (2,321 rooms) that list at least 30% of their total rooms on OTAs etc. Sold out (no listed inventory found) applied to 29 properties, or 27.9% of the total; 22 properties had remaining inventory of 10% or less of total rooms, 29 had more than 10% up to 25%, 13 had more than 25% up to 50%, and 11 had more than 50%. The median remaining share was 11.2%, and the room-weighted remaining share was 15.9%.
By size, small ryokan with 20 rooms or fewer number 71 properties (898 rooms), with the most sell-outs at 24 properties and a median remaining share of 10.5%. Mid-sized properties with 21–50 rooms number 26 (850 rooms), with 3 sold out and a median of 12.2%. Large properties with 51 rooms or more number 7 (573 rooms), with 2 sold out and a median of 8.5%. In other words, Oct 24’s remaining inventory is largest among small properties of 20 rooms or fewer, both in number of properties (47 not sold out) and in rooms left (about 156), followed by mid-sized properties of 21–50 rooms (23 not sold out, about 143 rooms). Only 3 of the 26 mid-sized properties have sold out so far, making this the layer whose approach to the remaining nine days of sales can move the prefecture-wide landing.
Movement since 30 days out also differs by property. Of the 102 properties that can be compared between 30 days out and October 15, 62 gained 5pt or more in estimated OCC, 28 were flat (within ±5pt), and 12 increased their listed inventory so that estimated OCC fell by 5pt or more. The 28 flat properties likely include both properties that had narrowed their listed availability at 30 days out and properties whose selling conditions are out of step with the market and have not moved.
Table 3: Distribution of remaining ryokan inventory for Oct 24 (Sat), by property size (as of October 15, 2026). Of 423 ryokan in the prefecture, 169 have listed-inventory observations; filtering for those listing at least 30% of total rooms on OTAs etc. gives N=104 properties (2,321 rooms). Sold out = properties with no listed inventory found (estimated).
| Size | Properties | Rooms | Sold out | Median remaining share |
|---|---|---|---|---|
| 20 rooms or fewer | 71 | 898 | 24 | 10.5% |
| 21–50 rooms | 26 | 850 | 3 | 12.2% |
| 51 rooms or more | 7 | 573 | 2 | 8.5% |
| Total | 104 | 2,321 | 29 | 11.2% |
Source: MetroEngines Research; compiled by the HotelBank Editorial Team
For comparison, the same aggregation for Oct 17 (Sat) covers 98 properties (2,388 rooms): 33 were sold out (33.7%), the median remaining share was 8.3%, and the room-weighted remaining share was 13.1%. That the median remaining share differs by only about 3pt between Oct 17 at 3 days out and Oct 24 at 10 days out indicates that if Oct 24 picks up about as much in the final days as Oct 17 did, it is positioned to reach the regular-Saturday landing band.
Estimated Settled ADR +5.5% YoY for September (Finalized) — Filling Rooms Without Cutting Rates
Let us also check the rate assumptions. Comparing finalized figures, estimated settled ADR (approximately tax-exclusive) for Yamagata Prefecture ryokan was ¥11,880 in September 2026 (N=190 properties), +5.5% from ¥11,266 in September of the prior year (N=182). August was ¥13,340 (N=190) versus ¥13,414 a year earlier (N=182), essentially flat at −0.6%. June, on the other hand, was ¥11,102 (−9.5% YoY) and July ¥11,515 (−9.9%), both below the prior year before summer. The turn to positive in September likely reflects the five-day holiday falling entirely within the month, and autumn weekend rates have not dropped below the prior year.
The current estimate for October is ¥14,197 (N=187) and for November ¥14,014 (N=175). Both are estimates based on current sales and should not be compared directly with the prior year’s finalized figures for October (¥12,435, N=181) or November (¥13,778, N=175) until they are finalized at month-end. Business hotels were ¥7,606 for September (finalized, N=71), +6.5% from ¥7,139 a year earlier (N=79), also above the prior year like ryokan.
Source: MetroEngines Research; compiled by the HotelBank Editorial Team
Table 4: Estimated settled ADR for Yamagata Prefecture ryokan (approximately tax-exclusive, monthly). Past months are finalized; October–November 2026 are estimates based on current sales. YoY is calculated only between finalized months.
| Month | 2025 (finalized) | N | 2026 | N | Basis | YoY |
|---|---|---|---|---|---|---|
| June | ¥12,271 | 191 | ¥11,102 | 190 | Finalized | −9.5% |
| July | ¥12,776 | 191 | ¥11,515 | 189 | Finalized | −9.9% |
| August | ¥13,414 | 182 | ¥13,340 | 190 | Finalized | −0.6% |
| September | ¥11,266 | 182 | ¥11,880 | 190 | Finalized | +5.5% |
| October | ¥12,435 | 181 | ¥14,197 | 187 | Current estimate | — (pending) |
| November | ¥13,778 | 175 | ¥14,014 | 175 | Current estimate | — (pending) |
Source: MetroEngines Research; compiled by the HotelBank Editorial Team
For Revenue Managers at Yamagata Ryokan — Implications and Action Plan
Operational insights
1. Benchmark your own curve against the market at the 30-days-out level. Among the prefecture’s ryokan, Oct 24’s gap opened in the window up to 30 days out (4.8pt at 45 days → 9.7pt at 30 days), and growth inside 30 days was nearly the same as for the long-weekend opener. If your autumn weekends are well below the market’s 75.3% (Oct 24) and 73.1% (Oct 17) at 30 days out, the problem most likely lies not in last-minute pricing but in exposure and selling conditions up to 30 days out.
2. The landing yardstick: regular Saturdays 89–95%, regular Sundays 80–84%, holidays around 99%. Knowing where your past weekends have landed within these bands lets you put numbers on the decision for Oct 24 with nine days left: whether you can reach market level, or whether to aim for holiday-level occupancy. Oct 25 (Sun) is already in the regular-Sunday band at 80.8% with 11 days to go, so Sunday is less urgent than Saturday.
3. Remaining inventory is thick among mid-sized properties. Of the 26 ryokan with 21–50 rooms, only 3 have sold out and the median remaining share is 12.2%; this is the layer that will decide the prefecture-wide landing for Oct 24. If your property is in this size band, act on the assumption that how same-size competitors sell over the remaining nine days will directly affect how your own rooms fill.
4. Rates have not fallen below the prior year. Estimated settled ADR for September was +5.5% YoY on a finalized basis, and market-wide data gives no indication that October rates need to be cut below prior-year levels to fill remaining rooms. Foliage is at peak in Zao Onsen town (as of October 15, Yamagata City Tourism Association) and just beginning to turn at Yamadera, so the demand context for Oct 24–25 is also in place.
Table 5: Action plan (target date = Oct 24; data as of October 15, 2026). Decision triggers are tied to the figures in this article.
| Timeframe | Action | Decision trigger (article figures) | Goal |
|---|---|---|---|
| Today to this week (9 days to Oct 24) | Review how remaining rooms are released. If any room types are closed, open allocations for both room-only and half-board (dinner and breakfast) plans for last-minute bookings | Your estimated OCC for Oct 24 is below the market’s 85.2% (10 days out) and you are not sold out (two-thirds of properties in the market still have rooms) | Capture the leisure demand that arrives inside 30 days |
| Today to this week | Feature two-night plans for Oct 24 (Sat) and Oct 25 (Sun). Use Saturday demand to fill Sunday’s remaining rooms | Oct 25 is at 80.8% 11 days out, below Saturday (85.2%), at the bottom of the regular-Sunday landing band of 80–84% | Sell inventory that is hard to move as a single Saturday night through multi-night stays |
| Today to this week | Rather than last-minute discounts, increase exposure with content-led messaging around peak foliage and the onsen town | September estimated settled ADR was +5.5% YoY; no market factor calling for lower rates can be identified | Bring landing occupancy into the regular-Saturday band (89–95%) while holding rates |
| Within 2 weeks (toward Oct 31 and Nov 7) | Check weekly the progress of upcoming Saturdays between 30 and 14 days out against the market’s Oct 24 fixed points: 75.3% at 30 days out and 84.7% at 14 days out | Your estimated OCC at the same point is 5pt or more below the market’s fixed point | Detect the “gap opens by 30 days out” pattern early |
| Within 2 weeks | Sort your past weekend landings into three bands (regular Saturday, regular Sunday, holiday) and set selling conditions (minimum length of stay, cancellation terms, meal plans) separately for each band | Your regular-Saturday landings are consistently below the market’s 89–95% | Replace the landing yardstick with your own property’s version |
| Toward next month (November weekends, T-45 → T-30 → T-14) | Set a three-stage calendar: at T-45 (for November Saturdays, September 23–October 14, already past; for early-December weekends, still ahead), prepare exposure and price ranges; at T-30 (for November Saturdays, October 8–29), benchmark against market fixed points and adjust conditions; at T-14 (October 24–November 14), make the final call on how to release remaining rooms | The current estimate of November estimated settled ADR is ¥14,014 (N=175), close to the prior year’s finalized ¥13,778; Yamadera’s typical peak is late October to early November | Avoid repeating October’s “gap opens by 30 days out” pattern in November |
Summary — Three Yardsticks for Reading Autumn Weekends
First, the gap opens by 30 days out. The difference between Oct 10 and Oct 24 moved from 4.8pt at 45 days out to 9.7pt at 30 days and 9.1pt at 10 days, and pickup inside 30 days was no different from the long-weekend opener. Second, keep three landing bands as your yardstick. Replacing the bands of regular Saturdays at 89–95%, regular Sundays at 80–84% and holidays around 99% with your own history lets you put numbers on decisions at each remaining-days point. Third, look at where remaining inventory sits by property size. Oct 24’s remaining inventory is largest among properties of 20 rooms or fewer, by both number of properties and rooms left, followed by those with 21–50 rooms, and how the mid-sized layer, still with few sell-outs, sells will also move the prefecture-wide landing. Estimated settled ADR for September was +5.5% YoY on a finalized basis, so rates have held, and Oct 24–25 is also a weekend with foliage at peak in Zao Onsen town. The levers for the remaining nine days lie not in price cuts but in how remaining rooms are released and in structuring multi-night and content-led offers.
Frequently Asked Questions
Q. Is estimated OCC (based on OTA-listed inventory) the same as actual room occupancy?
A. No. It is an estimate derived from the number of rooms left listed on OTAs etc., and because it counts unlisted rooms as already sold, it runs higher than actual occupancy. Use it as an indicator for the shape of booking curves and for relative comparisons between stay dates and segments, and avoid comparing its absolute values directly with published occupancy rates.
Q. How far is Oct 24 expected to rise in the remaining nine days?
A. This article does not forecast the landing. As a yardstick, Saturdays outside holiday periods in September–October landed in an 89–95% band the day before the stay, and the long-weekend opener Oct 10 added +5.2pt from 94.3% at 10 days out to 99.5% the day before. Whether Oct 24’s 85.2% at 10 days out enters this band is the benchmark for sales over the remaining nine days.
Q. When and what should we review for November weekends?
A. For ryokan in October, the gap opened in the window up to 30 days out. For November Saturdays, T-30 falls on October 8–29 and T-14 on October 24–November 14. A practical approach is a three-stage calendar: at T-30, compare your progress against the market’s fixed points (Oct 24 was 75.3% at 30 days out), and at T-14, make the final call on how to release remaining rooms. Note that the figures are a snapshot based on observations as of October 15, 2026.
About the Data
| Definition of estimated OCC (based on OTA-listed inventory) | OTA-listed-inventory occupancy = 100 − 100 × rooms left listed on OTAs ÷ total rooms. Covers a fixed cohort of properties that list at least 30% of total rooms on OTAs (the same set of properties for every stay date). It is an estimate based on how inventory sold on OTAs is being absorbed and is defined differently from actual room occupancy (it runs higher because unlisted rooms are counted as sold). Months covered: September–October 2026; stay dates covered: Oct 10, Oct 17, Oct 24 and Oct 25. |
| Booking curves | Based on observations from 45 days before the stay date to the latest reading. Fixed points are 45 days out, 30 days out, 14 days out and latest (Oct 10: day before; Oct 17: 3 days out; Oct 24: 10 days out; Oct 25: 11 days out). |
| Estimated settled ADR | A settled price level (approximately tax-exclusive) estimated from sales data such as OTAs (lowest-plan level × segment-specific factor, ensemble across multiple channels). Past months are finalized; current and future months are estimates based on current sales. Median error against published operating results: 6.6%. |
| Sample sizes (N) | Booking curves: Yamagata Prefecture ryokan N=110 properties, 2,910 rooms; business hotels N=23 properties, 1,989 rooms (fixed cohorts). Weekend landings (Table 2): 108–117 properties per date. Remaining inventory distribution (Table 3): ryokan listing at least 30% of total rooms on OTAs etc., N=104 properties, 2,321 rooms (Oct 24); 98 properties, 2,388 rooms (Oct 17). Estimated settled ADR: ryokan N=175–191 properties, business hotels N=71–79 properties (varies by month). |
| Data as of | October 15, 2026 (latest booking curve observation: October 14). Sales and inventory change daily, so the figures in this article are a snapshot at the time of retrieval. |
References and Sources
■ Data sources
MetroEngines Research aggregated data. For each fixed cohort of Yamagata Prefecture ryokan and business hotels (properties listing at least 30% of total rooms on OTAs), rooms left listed on OTAs were observed daily from 45 days before each stay date (Oct 10, Oct 17, Oct 24, Oct 25) to the latest reading (observed October 14, 2026). Weekend landings (Table 2) are daily values as of the day before each stay in September–October 2026; estimated settled ADR (Table 4, Figure 3) is monthly from January 2025 to November 2026 (October–November 2026 are current estimates). Foliage status: Yamagata City Tourism Association (updated October 15, 2026).
■ Calculation assumptions
Estimated OCC = 100 − 100 × rooms left listed on OTAs ÷ total rooms; gaps and pickup are differences (pt) between fixed points for the same stay date. Fixed points are 45 days out, 30 days out, 14 days out and latest. The remaining inventory distribution (Table 3) aggregates each property’s remaining-room share as of October 15 by size band (20 rooms or fewer, 21–50 rooms, 51 rooms or more), with properties anonymized. YoY for estimated settled ADR is calculated only between finalized months, and no landing forecast is made.
■ Limitations
Estimated OCC is an estimate based on OTA-listed inventory; rooms withdrawn from listing (sales stopped) are also counted as sold, so it runs higher than actual room occupancy. The number of observed properties for weekend landings (Table 2) is 108–117 per date, so comparisons between stay dates include small changes in the population. October and November estimated settled ADR are pre-finalization values and cannot be compared directly with prior-year finalized figures. The comparison with Fukushima Prefecture uses a different observation point and is limited to comparing the overall pattern.
■ External sources