

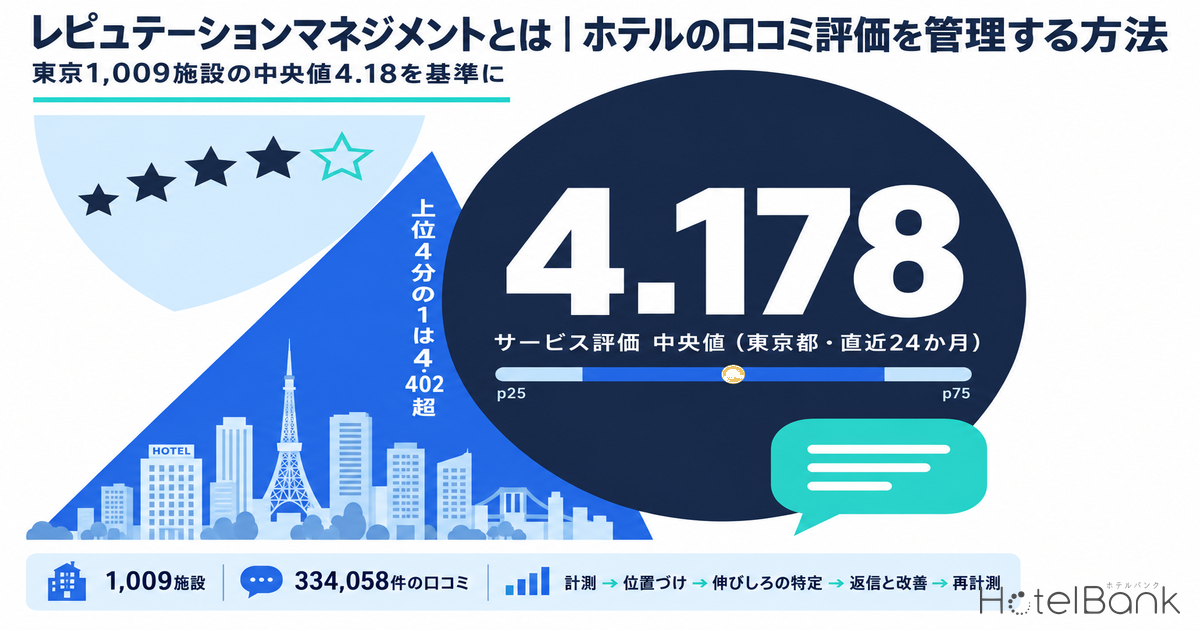
Reputation management is the ongoing work of measuring, analyzing, improving and communicating how a business is perceived. For hotels, the main subject is guest review scores and the content of what guests write. In lodging, reviews are read before a booking is made, and higher scores are tied to how readily guests accept a given price, so reputation cannot be treated as something that takes care of itself. It has to be managed as an operating metric that feeds directly into revenue. This article defines the term and separates it from two adjacent concepts, breaks the hands-on process at a hotel into five steps, and then sets out benchmarks for “where does our score sit within the area,” drawn from review aggregates (HotelBank Editorial Team research, past 24 months) that include 334,058 service ratings across 1,009 properties in Tokyo.
Metric Definitions Used in This Article
- Review scores (category scores): The category ratings (out of 5) that guests post on major booking sites, averaged for each property. Categories in this article such as “Service,” “Room,” “Staff,” “Cleanliness,” “Location,” “Breakfast” and “Bathroom” are normalized into 13 common categories from the differing category names each source uses.
- Median, p25, p75: The 50th, 25th and 75th percentile points when per-property scores in an area are sorted from lowest to highest. Below p25 is the “bottom quarter” and above p75 is the “top quarter.” We use percentiles rather than averages so that a small number of extreme properties do not drag the benchmark.
- Coverage and period: Reviews posted in the past 24 months (as of the October 1, 2026 tabulation). The number of properties (N) and the number of reviews differ by category, so both are shown in the tables.
- Data source: HotelBank Editorial Team research. This article does not analyze prices (ADR); the relationship between scores and rates is shown through links to earlier analysis articles.
- — Reputation management is routine, ongoing work: measuring, analyzing, improving and communicating reputation. At hotels, the main subject is guest review scores and review content.
- — It differs in purpose, time horizon and ownership from reputational risk management (crisis response) and revenue management (moving price and inventory).
- — In practice, run a five-step cycle of “measure → position → identify headroom → respond and improve → re-measure” roughly every 90 days.
- — In Tokyo (past 24 months), the median service score across 1,009 properties is 4.178, and the top quarter starts above 4.402. A score of 4.1 is only average.
- — The benchmark should be category percentiles for the same area and the same hotel type, not the overall score. A service score of 4.20 is above the median for business hotels but sits around p25 (4.193) for city hotels.
What Is Reputation Management? Definition and How It Differs From Two Adjacent Terms
Reputation means how a business is regarded, and reputation management is the practice of managing that reputation as a business asset. At general companies, it covers a broad range, including media coverage, mentions on social media and standing in the recruiting market. At hotels, by contrast, the review scores and review content that guests post on major booking sites and map services carry by far the most weight as the thing to measure and improve. The reason is structural: the guest experience is rated publicly in both numbers and text, and the next guest reads those ratings before booking, a link that is more direct than in most other industries.
Two terms are easily confused with it: “reputational risk management” and “revenue management.” The former is a crisis-response framework that prevents events that damage reputation (misconduct, accidents, the spread of misinformation and so on) and limits the damage when they occur; it developed largely in financial-sector supervision. The latter is a method for maximizing room revenue by adjusting price and inventory, and it does not deal with reputation itself. Reputation management sits between the two: it is the “offensive” work of measuring and steadily raising reputation in normal times. The table below summarizes how the three differ.
| Term | Purpose | Main subject | Time horizon | Owner within the hotel |
|---|---|---|---|---|
| Reputation management | Measure, analyze, improve and communicate reputation, raising it continuously | Guest review scores and review content; mentions on social media and in the press | Normal times, ongoing (monthly to quarterly) | General manager, marketing, department leaders |
| Reputational risk management | Prevent damage to reputation and limit losses when it occurs | Misconduct, accidents, spread of misinformation, legal violations | Crisis and prevention (crisis response) | Senior management, PR, legal |
| Revenue management | Maximize room revenue by adjusting price and inventory | Selling prices, remaining rooms, sales channels, booking pace | Daily to seasonal | Revenue manager, sales |
Source: Compiled by HotelBank Editorial Team
The three are distinct, but on the ground at a hotel they are connected. The pattern that higher-rated properties find it easier to win acceptance for higher prices means that the results of reputation management become a precondition for revenue management. And a hotel that measures its reputation routinely can spot a sudden drop in scores or a surge in mentions of a particular theme early, so its first response to reputational risk is faster as well.
Why It Matters for Hotels: Reviews Are Read Before Booking and Tied to Price Acceptance
First, reviews are consulted before the booking decision. In the “Survey on the Influence of Reviews on Accommodation Bookings” conducted by Honichi Lab (訪日ラボ) on June 16–18, 2025 (a private online survey of 600 people in their 20s to 50s who had taken a domestic overnight trip within the past year), about 91% of respondents said they “refer to” reviews when booking accommodation, about 72% said they had dropped a property from consideration because it had no or few reviews, and about 78% said they had decided not to book after seeing negative reviews. This is a one-off survey of 600 domestic travelers, not a definitive figure for the whole industry, but the sequence of “read first, then book” is reason enough for hotels to manage their reputation actively.
Second, scores are tied to how readily guests accept a price. HotelBank has examined the relationship between review-score percentiles and estimated settled ADR area by area. In Ishikawa, a wide gap in estimated settled ADR was confirmed between the top and bottom tiers of room scores at business hotels. Other articles cover a three-step method for using percentiles to find room for rate increases in Okayama, which review categories explain the rate gap between city and business hotels in Osaka, and how to check score distribution against price position in central Sapporo. The price satisfaction map, which plots the probability that guests describe a stay as “good value” by price band, is also worth reading alongside these. This article does not offer a single conversion rate of the “every X-point rise in score lifts rates by Y%” kind, because the values swing at the boundaries between groups. Please check the direction and size of the relationship, together with the sample, in the area articles above.
Third, the legal backdrop has changed. Japan’s Consumer Affairs Agency made stealth marketing a violation of the Act against Unjustifiable Premiums and Misleading Representations (景品表示法) from October 1, 2023, and “representations on the internet (social media posts, review posts and the like)” are explicitly within scope. Because representations that a business asks or instructs a third party to post are subject to regulation, offering perks in exchange for high ratings is not an option. In other words, hotel reputation management works only by genuinely improving the stay and responding sincerely to what guests write. That may look like the long way around, but in terms of making scores last it is also the most reliable path.
How to Do Reputation Management: Five Steps From Measurement to Re-Measurement
So how do you run it inside a hotel? The process has five steps, “measure → position → identify headroom → respond and improve → re-measure,” repeated on a cycle of roughly 90 days. The figure below first shows the metrics to watch at each step, followed by a step-by-step explanation.
Figure: The reputation management cycle at a hotel (compiled by HotelBank Editorial Team)
STEP 1: Measure. The first decision is what to count. The overall score tends to land close to the average of the categories, so if you track only the overall score, headroom in categories like bathroom or breakfast is hidden behind high marks in categories the property can hardly change, such as location. Instead, align the differing category names used by each source into common categories such as service, room, cleanliness, staff, location, breakfast and bathroom, and record monthly category scores, review counts and the posting rate relative to the number of guest parties for each property. Adding a breakdown by review language lets you separate later how domestic and international guests weigh things differently. How much the evaluation criteria differ by language is shown category by category in our analysis of review score gaps by language at popular Tokyo hotels.
STEP 2: Position. A measured value on its own is neither high nor low. A service score of 4.1, for example, is slightly below the median (4.178) across all properties in Tokyo, but roughly level with the median (4.114) if you look only at business hotels in the same city. The comparison should therefore be “percentiles for the same area and the same hotel type.” With p25, median and p75 for each category, as in the Tokyo table below, you can see on a single table whether each of your categories falls in the “bottom quarter,” “around the median” or “top quarter.”
STEP 3: Identify headroom. Once you know the percentile bands, list the categories below the median as candidates and read the review content to identify recurring themes. The key is to account for the fact that levels differ between categories. In Tokyo, the bathroom median is 3.719, 0.66 lower than location at 4.376. The same score of 3.8 is on the upper side (above the median) for bathroom but on the lower side (below p25) for location. Prioritizing by position within each category’s distribution, rather than by absolute value, makes it easier to start with the improvements that offer the best return on investment.
STEP 4: Respond and improve. There is no need to require a reply to every review, but reviews with low scores and specific complaints should get priority, ideally within a few days. The purpose of a reply is not only to address the reviewer but also to tell future readers that “this is a hotel where feedback gets through and gets acted on.” At the same time, turn the themes identified in STEP 3 into improvement items for each department and record start and completion dates. If you know when an improvement was made, you can read its effect against score changes at re-measurement.
STEP 5: Re-measure. After roughly 90 days, recheck the category scores and percentile bands. Because scores swing in months with few reviews, it helps to place the last 90 days next to the last 365 days and confirm that the short-term change points the same way as the long-term trend. How scores settle as reviews accumulate is tracked in monthly cohorts in our review formation curve for hotels opened in 2025. If an improved category has moved up a band, go on to the next category; if not, revisit the theme you identified or the substance of the improvement and return to STEP 1. Keeping this cycle going is nearly the whole of reputation management in practice.
A Benchmark Example: Distribution of Review Category Scores in Tokyo
As an example of the benchmarks used in STEP 2, here is the distribution by category for properties in Tokyo. Coverage is properties that received reviews in the past 24 months, and the number of rated properties differs by category. Service (1,009 properties, 334,058 reviews), room (1,020 properties, 390,911 reviews) and location (1,005 properties, 384,895 reviews) are large, while breakfast (659 properties, 57,495 reviews) and meals (436 properties, 22,852 reviews) have smaller samples depending on whether the service is offered and how rating categories are set up.
Source: HotelBank Editorial Team research (Tokyo, past 24 months, as of the October 1, 2026 tabulation. Bars show p25–p75; markers show the median. N = 436–1,020 properties by category)
| Category | Properties | Reviews | p25 | Median | p75 | p75−p25 |
|---|---|---|---|---|---|---|
| Location | 1,005 | 384,895 | 4.143 | 4.376 | 4.569 | 0.426 |
| Staff | 849 | 138,992 | 4.087 | 4.310 | 4.504 | 0.417 |
| Amenities | 531 | 33,638 | 4.040 | 4.269 | 4.464 | 0.424 |
| Cleanliness | 879 | 175,302 | 3.899 | 4.218 | 4.412 | 0.513 |
| Service | 1,009 | 334,058 | 3.922 | 4.178 | 4.402 | 0.480 |
| Meals | 436 | 22,852 | 3.824 | 4.154 | 4.400 | 0.576 |
| Room | 1,020 | 390,911 | 3.854 | 4.135 | 4.384 | 0.530 |
| Breakfast | 659 | 57,495 | 3.889 | 4.119 | 4.353 | 0.464 |
| Facilities | 805 | 114,824 | 3.763 | 4.062 | 4.333 | 0.570 |
| Bathroom | 787 | 143,681 | 3.429 | 3.719 | 4.014 | 0.585 |
Source: HotelBank Editorial Team research (Tokyo, all hotel types, past 24 months, as of the October 1, 2026 tabulation. Sorted by median, highest first)
Two things stand out in this table. First, among the seven main categories, all except bathroom have medians clustered in a narrow 4.1–4.4 range: service 4.178, room 4.135, cleanliness 4.218, staff 4.310, location 4.376 and breakfast 4.119 all fall in the “4.1s to 4.3s.” Put differently, a score of 4.1 in Tokyo is average rather than a strength, and getting into the top quarter requires exceeding 4.402 for service, 4.384 for room or 4.412 for cleanliness. Treating a score above 4.0 as an achievement sets the bar for differentiation one notch too low.
Second, the level itself differs between categories. Bathroom has a median of 3.719, below the p25 of every other category (3.8–4.1), and even its p75 reaches only 4.014. Bathroom is also the lowest category in other major markets such as Osaka and Fukuoka; because bathroom size and fixtures depend on building design, it is hard for an individual hotel to move through operations in the short term. On the other hand, its p75−p25 spread of 0.585 is the widest of any category, showing a large gap between hotels with high and low bathroom scores even within Tokyo. If a hotel can move into the upper band here when it renovates, it is a category where it can more readily stand out from peers. This structure, in which bathroom is both the lowest-rated category and the one with the widest gap between properties, is not limited to Tokyo; the same shape appears in the distribution of review scores in Kyoto.
Benchmarks Shift by Hotel Type: All Types vs Business Hotels vs City Hotels
Aligning hotel type as well as area moves the benchmarks further. The chart and table below compare the medians for the same seven categories for business hotels (641 properties) and city hotels (87 properties) in Tokyo against all hotel types. City hotels form a small sample of 87 properties, so their percentile values can shift with changes in just a few properties; please read them with that in mind.
Source: HotelBank Editorial Team research (Tokyo, past 24 months, as of the October 1, 2026 tabulation. Median of per-property scores for each hotel type. All types N = 659–1,020; business N = 471–641; city N = 69–87 properties)
| Category | All types: median (p25 / p75) | Business: median (p25 / p75) | City: median (p25 / p75) | City − Business |
|---|---|---|---|---|
| Service | 4.178 (3.922 / 4.402) N=1,009 | 4.114 (3.894 / 4.304) N=641 | 4.400 (4.193 / 4.549) N=87 | +0.286 |
| Room | 4.135 (3.854 / 4.384) N=1,020 | 4.085 (3.832 / 4.278) N=641 | 4.372 (4.173 / 4.538) N=87 | +0.287 |
| Staff | 4.310 (4.087 / 4.504) N=849 | 4.270 (4.072 / 4.438) N=588 | 4.537 (4.374 / 4.737) N=80 | +0.267 |
| Cleanliness | 4.218 (3.899 / 4.412) N=879 | 4.177 (3.884 / 4.343) N=606 | 4.518 (4.280 / 4.648) N=80 | +0.341 |
| Location | 4.376 (4.143 / 4.569) N=1,005 | 4.327 (4.130 / 4.500) N=639 | 4.558 (4.354 / 4.692) N=85 | +0.231 |
| Breakfast | 4.119 (3.889 / 4.353) N=659 | 4.067 (3.841 / 4.246) N=471 | 4.379 (4.178 / 4.519) N=75 | +0.312 |
| Bathroom | 3.719 (3.429 / 4.014) N=787 | 3.636 (3.359 / 3.920) N=572 | 3.921 (3.719 / 4.123) N=69 | +0.285 |
Source: HotelBank Editorial Team research (Tokyo, past 24 months, as of the October 1, 2026 tabulation. N is the number of properties per category)
The gap between hotel types ranges from 0.23 to 0.34 across every category, with city hotels consistently higher. The point to note is that the same score can flip position depending on hotel type. A business hotel with a service score of 4.20 sits above the business-hotel median (4.114) but below p75 (4.304), in the “between the median and the top” zone. Place the same 4.20 in the city-hotel distribution, however, and it lands at the lower edge, almost exactly at p25 (4.193). Comparing without aligning hotel type leads you to mistake a hotel that is doing well for a laggard, and conversely to mistake an average city hotel for a leader. Fixing the comparison axis at “percentiles for the same area and the same hotel type” is the basic rule for using percentile benchmarks.
Suppose a business hotel in Tokyo, Hotel A, scores 4.25 for service, 4.05 for room, 4.30 for cleanliness, 3.75 for bathroom and 4.20 for location. Against the business-hotel percentiles, service is above the median (in the 4.114–4.304 band), room is below the median (under 4.085), cleanliness is in the upper zone near p75 (0.04 short of 4.343), bathroom is above the median (in the 3.636–3.920 band), and location is above p25 but below the median. Bathroom, the lowest in absolute terms, is on the upper side in relative terms, and setting aside location, which the property can hardly change, room emerges as the category with the most headroom. When reading review content in STEP 3, picking up mentions related to the room first (size, bedding, fixtures, quietness and so on) sets the order of improvements.
Organization and KPIs: Focus on Metrics the Hotel Can Track Itself
Finally, here is the organization and set of metrics to keep the cycle going. At many hotels, reputation management is not large enough to justify a dedicated staff member, so a realistic setup is to make the general manager accountable and have the front desk, rooms and F&B leaders share responses and improvements. Check the percentile band for each category at the monthly operations meeting, and each quarter narrow the improvement themes to one or two to follow through. Limiting metrics to ones that can be updated from the hotel’s own data, without relying on outside statistics or estimates, makes it easier to sustain the work even when the person in charge changes.
| KPI | Definition | Review frequency | How to use it |
|---|---|---|---|
| Category scores (90-day / 365-day) | Average for each common category over the last 90 days and the last 365 days | Monthly | Check whether the short-term change points the same way as the long-term trend. Categories where the 90-day score exceeds the 365-day score are showing improvement taking hold |
| Percentile band (by category) | The hotel’s position relative to p25 / median / p75 for the same area and hotel type | Quarterly | Aim to reduce the number of categories “below the median” and increase the number “above p75” |
| Posting rate | Number of reviews ÷ number of guest parties | Monthly | Scores swing when counts are low. When encouraging reviews, do not tie them to perks (Act against Unjustifiable Premiums and Misleading Representations) |
| Response rate and days to respond | Share of reviews answered, and median days from posting to reply | Monthly | Aim for 100% replies to reviews with low scores or specific complaints. The fewer the days, the more clearly readers see “a hotel that acts on feedback” |
| Low-score share | Share of reviews with an overall score of 3 or below | Monthly | In months where it jumps, read the themes mentioned and determine whether facilities, staffing or peak demand is the cause |
| Theme mention share | Share of mentions by theme, such as breakfast, bathroom, noise and check-in | Quarterly | Even if scores do not move, a change in what guests mention is an early sign of improvement. Use it as the basis for choosing improvement themes |
| Score gap by language | Difference in category scores between Japanese-language and foreign-language reviews | Quarterly | Hotels with a high share of international guests face different evaluation criteria. Categories with large gaps are easier to close through multilingual guidance and signage |
Source: Compiled by HotelBank Editorial Team
What these metrics have in common is that they can be updated every month from the hotel’s own reviews and stay records alone, without relying on outside estimates. Only the percentile band needs the area distribution, and once you have benchmarks for the same area and hotel type in hand, like the Tokyo tables in this article, you can reuse them for quarterly positioning. Benchmarks move as reviews accumulate, so it is worth refreshing them at least once a year.
Summary
Reputation management is the routine work of measuring, analyzing, improving and communicating reputation, and its role differs from both reputational risk management (crisis response) and revenue management (moving price and inventory). At hotels, reviews are read before booking and scores are tied to how readily guests accept a price, so this work feeds directly into revenue. In practice, it comes down to running the five-step cycle of “measure → position → identify headroom → respond and improve → re-measure” roughly every 90 days.
The benchmark for that cycle is neither the overall score nor a national average, but category percentiles for the same area and hotel type. In Tokyo, the medians of the main categories cluster at 4.1–4.4, and a score of 4.1 is only average. Start by applying this reading, that a score becomes a source of differentiation only once it reaches the top quarter, to your own hotel’s numbers.
Frequently Asked Questions
Q. What is reputation management?
It is the ongoing work of measuring, analyzing, improving and communicating how a business is perceived. At hotels, the main subject is guest review scores and review content. It refers to a cycle of positioning category scores against percentiles for the same area and hotel type, improving and responding in the categories with headroom, and then re-measuring.
Q. How do hotels do reputation management?
Repeat the five steps of “measure → position → identify headroom → respond and improve → re-measure” on a cycle of roughly 90 days. Measure by category score rather than overall score, and position against p25, median and p75 for the same area and hotel type. Reply first to reviews with low scores and specific complaints, and record when improvements are made so you can read their effect at re-measurement.
Q. How does it differ from reputational risk management?
Reputational risk management is a crisis-response framework that prevents events that damage reputation, such as misconduct or the spread of misinformation, and limits losses when they occur. Reputation management is ongoing work in normal times to measure and steadily raise reputation, and its subject is everyday review scores and review content. The former is typically owned by senior management, PR and legal; the latter by the general manager and department leaders.
Q. What review score counts as high?
A score cannot be judged on its own; compare it with percentiles for the same area and hotel type. For all hotel types in Tokyo (past 24 months, as of the October 1, 2026 tabulation), the median service score is 4.178 and the threshold for the top quarter is 4.402, so a score of 4.1 is average. Levels differ by category (bathroom has a median of 3.719, for example), so compare category by category.
Q. Can we offer perks to get more reviews posted?
Offering perks in exchange for high ratings is not an option. Japan’s Consumer Affairs Agency has treated stealth marketing as a violation of the Act against Unjustifiable Premiums and Misleading Representations since October 1, 2023, and representations that a business asks or instructs a third party to post are subject to regulation. Even when encouraging reviews, do not tie them to perks; build scores by improving the actual stay and responding sincerely.
Related Articles
- A 4.1 Review Score Is Average, Not a Strength: Sapporo Price Position
- Osaka City vs Business Hotels: 1.49x ADR Gap Explained by Meals
- What Price Gets Called “Good Value”? 2.9M Reviews Map a U-Curve
Further Reading
- Kyoto Reviews vs Settled ADR: Bathroom 4.002 Weakest, July ¥17,420
- Tokyo Hotel Review Gap by Language: How Japanese vs Inbound Guests Differ
- New Hotel Reviews Rise +0.38pt in 2 Months: 1,728 Japan 2025 Openings
- What Guests Write About in 8 Languages — 3.46M Review Tag Analysis
- 16M Reviews: Japan’s 47 Prefectures Split Into 4 Review Profile Types
- Room Cleanliness: Foreign Reviews Mention It 1.5x More — 12,733 Hotels
- Review Volume Doesn’t Grow With Age: 1,643 Hotels, ADR, Sell-Through
References and Sources
■ Data Source
Category ratings (out of 5) from reviews that guests posted on major booking sites were averaged for each property, and percentiles (p25, median, p75) of per-property scores in Tokyo were calculated (HotelBank Editorial Team research, past 24 months, as of the October 1, 2026 tabulation). Category names are normalized from each source’s labels into common categories.
■ Assumptions
The number of properties (N) differs by category (all types 436–1,020 properties; business hotels 302–641; city hotels 69–87). The figures for “Hotel A” are a hypothetical example to illustrate how to read percentiles and do not represent a real property. The five-step process and KPIs are a practical framework compiled by the Editorial Team.
■ Limitations
Percentiles move as reviews accumulate, so the benchmarks reflect the tabulation date. City hotels form a small sample of 87 properties, and their percentiles can shift with changes in just a few properties. Review scores reflect the guests who posted reviews and do not represent the satisfaction of all guests. The Honichi Lab survey is a one-off online survey of 600 people and is not a definitive figure for the industry as a whole. This article does not provide a conversion rate between scores and room rates.
■ Sources
- HotelBank Editorial Team research — Distribution of guest review category scores in Tokyo (past 24 months, as of the October 1, 2026 tabulation; all types N = 436–1,020 properties, business hotels N = 302–641, city hotels N = 69–87)
- Consumer Affairs Agency, “Stealth marketing becomes a violation of the Act against Unjustifiable Premiums and Misleading Representations from October 1, 2023” (Japanese)
- Honichi Lab (訪日ラボ), “Survey on the Influence of Reviews on Accommodation Bookings” (June 16–18, 2025; 600 people in their 20s–50s; published August 22, 2025) (Japanese)