

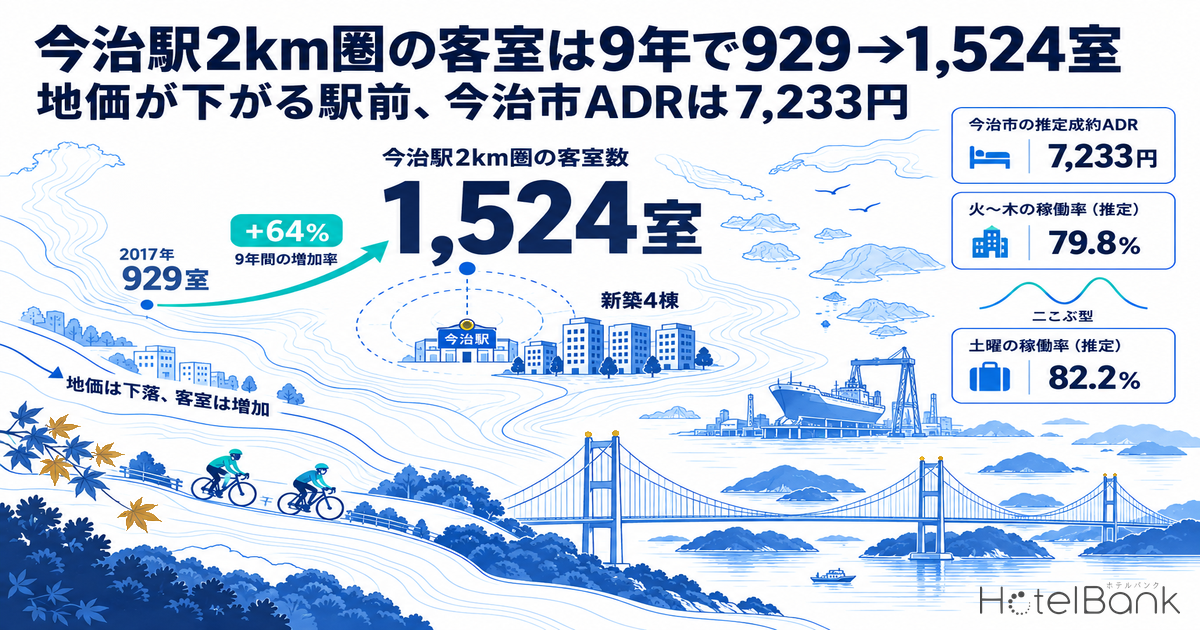
The number of hotel rooms within 2 km of JR Imabari Station grew from 929 (17 properties) in 2017 to 1,524 (24 properties) in 2026 — an increase of 595 rooms, or 64%, in nine years. Nearly all of that increase, 594 rooms, came from four newly built hotels that opened in 2021 and 2024. Over the same period, commercial land prices within 1 km of the station have fallen for five consecutive years, and the resident population is projected to shrink by more than 20% toward 2040. This article examines which demand is supporting the room stock that has accumulated in a regional hub city where both population and land values are contracting, using estimated occupancy by day of week, booking pace, and estimated settled ADR.
Metric Definitions Used in This Article
*Metric definitions used in this article: ADR (average daily rate) = estimated settled rate (tax-exclusive equivalent), calculated by applying a segment-specific adjustment factor to the lowest-priced plan level each property publishes on OTAs (two guests per room, price per room, tax included). In a comparison with property-level results disclosed by listed hotel REITs (184 property-months, April–May 2026), the median error was about 7.5%. These are estimates and differ from each property’s actual settled prices and accounting figures. Area-level ADR is the median across covered properties (the level of a typical property in the area). OCC (occupancy) = rooms sold as a share of total rooms in the area (an estimate based on OTA sales inventory; consistency checks against monthly REIT disclosures confirm accuracy to within roughly a few points). Where listed prices are mentioned, they are the price per room for two guests per room (tax included). Booking curve = the trajectory of remaining OTA room inventory toward the check-in date. LT (lead time) = number of days until check-in. Occupancy (estimated, based on OTA-listed inventory) is an estimate derived from how inventory sold on OTAs is being consumed and differs from the actual occupancy of the entire property. Data source: MetroEngines Research.
- — 929 → 1,524 rooms (+64%): Room stock within 2 km of Imabari Station rose by 595 rooms between 2017 and 2026, of which 594 came from four new-build hotels opened in 2021 and 2024
- — Land prices are falling; land is about 2.7% of total investment: The official commercial land price within 1 km of the station has a median of ¥76,600/㎡ (2026, −0.7% YoY). In a 150-room model, yield is driven by construction cost and room rate
- — A twin-peak week: Tue–Thu 79.8%, Saturday 82.2%: Imabari City’s occupancy (estimated, June 10–September 30, 2026) reflects dual demand — the maritime industry on weekdays and Shimanami tourism on weekends
- — Imabari City’s estimated settled ADR is ¥7,233 (+2.1% YoY): The four new builds have a median of about ¥7,500, roughly 1.5 times that of the 11 older properties. No property sits in the ¥9,000–12,000 band
- — GOP yield of 4.1–5.9%: Once construction-period inflation is factored in, a 6% yield requires an ADR of about ¥10,200 under an assumed full-year occupancy of 80%. Capturing the vacant price band is the dividing line
Supply Trend — 595 Rooms Added in Nine Years, 594 of Them in Four New Builds
We start with the supply time series. Counting, at each year-end, the properties tracked by MetroEngines Research that are located within a 2 km radius of JR Imabari Station (34.0659°N, 132.9976°E) and whose opening year can be confirmed, there were 17 properties with 929 rooms in 2017. The figure stayed nearly flat through 2020 at 18 properties and 935 rooms, then moved to 20 properties and 1,202 rooms in 2021, 23 properties and 1,514 rooms in 2024, and 24 properties and 1,524 rooms in 2026. The increase was not continuous; it is explained by two steps — +267 rooms in 2021 and +327 rooms in 2024.
The steps consist of four newly built hotels. In 2021, Super Hotel Imabari (スーパーホテル今治, 146 rooms) opened in April and JR Clement Inn Imabari (JRクレメントイン今治, 121 rooms) in September; in 2024, Shimanami Prime Hotel Imabari (しまなみプライムホテル今治, 152 rooms) followed in March and Hotel Route-Inn Imabari (ホテルルートイン今治, 175 rooms) in June. The four total 594 rooms, almost exactly matching the nine-year net increase of 595 rooms. Opening dates and room counts for all four can be confirmed from the companies’ official announcements and press reports.
| Property | Rooms | Opening date | Location | Features (company announcements) |
|---|---|---|---|---|
| Super Hotel Imabari (スーパーホテル今治) | 146 | April 29, 2021 | About 1.0 km from the station | Rooms that allow bicycles to be brought inside |
| JR Clement Inn Imabari (JRクレメントイン今治) | 121 | September 16, 2021 | In front of Imabari Station | 17 cycle rooms |
| Shimanami Prime Hotel Imabari (しまなみプライムホテル今治) | 152 | March 28, 2024 | About a 5-minute walk from the station | Top-floor panoramic public bath and sauna |
| Hotel Route-Inn Imabari (ホテルルートイン今治) | 175 | June 8, 2024 | About 3 minutes from Imabari IC | Rooms that accept road bikes |
What stands out is that all four are limited-service hotels yet come with specifications aimed at leisure travelers, such as cyclist-friendly rooms and large public baths. This is not supply designed for business travel alone; it is designed around the location as the starting point of the Shimanami Kaido. The map below shows the 15 properties with a complete 12-month estimated settled ADR series (1,461 rooms, 96% of the rooms within 2 km of the station) together with the four commercial sites in the official land price survey.
Location Assessment — Station-Front Commercial Land Down 8.2% Since 2022, FAR of 300–500%
During the same period in which room stock grew by 60%, land prices underfoot kept falling. Looking at the four commercial sites within 1 km of Imabari Station in the Ministry of Land, Infrastructure, Transport and Tourism (MLIT) official land price survey, 2026 prices ranged from ¥59,200 to ¥101,000/㎡, with a median of ¥76,600/㎡ (¥77,200/㎡ in 2025, −0.7% YoY). All four sites were in negative territory year on year, at −0.1% to −1.9%, and the site closest to the station, in Tokiwa-cho 4-chome, fell from ¥110,000/㎡ in 2022 to ¥101,000/㎡ in 2026 — a decline of 8.2% in four years.
| Standard site | Location | Distance from station | FAR | 2022 (¥/㎡) | 2026 (¥/㎡) | YoY | vs. 2022 |
|---|---|---|---|---|---|---|---|
| Imabari 5-4 | Tokiwa-cho 4-chome (常盤町4丁目2番4外) | About 120 m | 500% | 110,000 | 101,000 | −1.9% | −8.2% |
| Imabari 5-1 | Kita-Hiyoshi-cho 1-chome (北日吉町1丁目218番8) | About 520 m | 300% | 82,000 | 80,500 | −0.1% | −1.8% |
| Imabari 5-3 | Kita-Horai-cho 3-chome (北宝来町3丁目1番28) | About 480 m | 400% | 77,600 | 72,700 | −1.4% | −6.3% |
| Imabari 5-2 | Asahi-machi 3-chome (旭町3丁目4番8) | About 800 m | 500% | 61,700 | 59,200 | −0.2% | −4.1% |
Falling land prices are not necessarily a headwind for hotel development, however. Commercial land in front of the station is designated with a floor-area ratio (FAR) of 300–500%, and as the model later in this article shows, land accounts for less than 3% of total investment for a 150-room limited-service hotel. What determines whether an investment works is construction cost and room rate, not land price, and cheap land works to lower the barrier to entry. Disaster risk and site-specific regulations are not covered in this article; in an actual review, checking the municipality’s hazard maps and city planning maps is essential.
The Demand Base — Resident Population Is Shrinking, but 12,500 People Work Within 1 km
Next, we look at the population and employment structure underlying lodging demand. According to MLIT’s 250 m mesh population projections, the resident population within a 1 km radius of Imabari Station is projected to fall 27.9%, from 12,837 in 2020 to 9,252 in 2040; widening the radius to 1.5 km still shows a 23.4% decline, from 23,366 to 17,891. The share of residents aged 65 and over had reached 40.1% within 1 km as of 2025. Note that these are census-based resident populations and do not represent visitors or people passing through.
As a place of work, however, the area retains depth. According to the Economic Census (2021) by the Ministry of Internal Affairs and Communications and the Ministry of Economy, Trade and Industry, 1,526 establishments with 12,519 employees are located within 1 km of the station, and 2,546 establishments with 21,435 employees within 2 km. The share of office-type employees is only 13.4% within 1 km and 11.0% within 2 km — the composition of a town built around manufacturing, logistics, and retail worksites rather than an office district.
| Range from Imabari Station | Establishments | Employees | Office-type share | Resident population (2020) | 2040 projection (vs. 2020) |
|---|---|---|---|---|---|
| 1 km radius | 1,526 | 12,519 | 13.4% | 12,837 | −27.9% |
| 2 km radius (employment) / 1.5 km (population) | 2,546 | 21,435 | 11.0% | 23,366 | −23.4% |
Behind this is the city’s maritime industry cluster. According to materials published by Imabari City, 14 shipbuilding establishments are located in the city and account for about 18% of vessels built in Japan, while the groups of shipbuilders headquartered or based in the city build about 35% of Japan’s total. As for ocean-going vessels, shipowners in the city are said to own about 1,100, or roughly 30% of the 3,663 held in Japan (all figures are FY2021 results). The business negotiations and construction-stage inspections that bring together shipowners, shipyards, marine equipment manufacturers, financial institutions, and classification bodies are considered a source of weekday overnight stays from outside the area.
The other pillar is cycle tourism. About 330,000 cyclists a year are said to visit the Shimanami Kaido from Japan and abroad, and rental bicycle loans totaled 127,458 in FY2023, of which 29,678 were to overseas users — 26% above the 23,547 recorded in FY2019 (Onomichi City materials). On October 25, 2026, the biennial international cycling event “Cycling Shimanami 2026” is scheduled with a capacity of around 7,000 participants. The natural explanation for why room stock grew in a city with a shrinking resident population lies not in the local population but in two kinds of demand arriving from outside. How much lodging capacity exists along the 12 National Cycle Routes, including the Shimanami Kaido, is compared route by route in Japan’s 12 National Cycle Routes: 29,454 Rooms and an Autumn ADR Peak.
Occupancy by Day of Week — A Twin Peak of 79.8% Tue–Thu and 82.2% on Saturday
So how do these two kinds of demand show up in actual occupancy? Averaging occupancy (estimated, based on OTA-listed inventory) for Imabari City as a whole (24–26 properties / 1,029–1,053 rooms covered, based on listings on major booking sites) by day of week over the 113 days from June 10 to September 30, 2026, Tuesday through Thursday came in at 79.0–80.5% (three-day average 79.8%) and Saturday at 82.2% — a twin-peak pattern with highs in both midweek and on Saturday. The troughs were Sunday at 65.9%, Friday at 71.4%, and Monday at 73.1%.
| Day | Imabari City occupancy (estimated) | Imabari City listed price (all-plan average, tax incl.) | Ehime business hotels occupancy (estimated) | Days counted |
|---|---|---|---|---|
| Monday | 73.1% | ¥16,765 | 76.3% | 16 |
| Tuesday | 79.7% | ¥15,264 | 82.7% | 16 |
| Wednesday | 80.5% | ¥15,237 | 83.2% | 17 |
| Thursday | 79.0% | ¥15,316 | 83.2% | 16 |
| Friday | 71.4% | ¥15,525 | 75.5% | 16 |
| Saturday | 82.2% | ¥21,232 | 82.5% | 16 |
| Sunday | 65.9% | ¥17,538 | 68.3% | 16 |
Business hotels in Ehime Prefecture (48–50 properties / 5,009–5,232 rooms covered) trace almost the same shape, at 82.7–83.2% Tuesday through Thursday and 82.5% on Saturday. What distinguishes Imabari City from the prefecture as a whole is that Saturday exceeds Tuesday–Thursday by 2.4 points and is the highest day of the week. The listed price (all-plan average, tax included) is also about 40% higher on Saturday, at roughly ¥21,200 versus roughly ¥15,300 Tuesday through Thursday, so weekend leisure demand is working on the rate side as well. The picture is one of dual demand — business on weekdays, tourism on Saturday — using the same rooms at different points in the week.
Narrowing to the 2 km station area and looking at lowest listed prices confirms the same tendency. The median lowest listed price (two guests per room, tax included) across 12 major properties was around ¥5,600 on weekdays in September 2026, versus ¥7,000–7,900 on Saturdays excluding holiday weekends. Moreover, in listings as of October 3, the median for Saturday, October 24 — the eve of Cycling Shimanami 2026 — was set at about ¥18,800 (10 properties with confirmed listings), roughly three times the October weekday level of about ¥6,000. That many properties are active in pricing event dates indicates the scale of the revenue opportunity in this area.
Booking Pace — Weekdays and Saturdays Alike Add 20–30% in the Final Two Weeks
Differences by day of week also show up in when bookings come in. Comparing booking curves from LT45 to LT1 for three September dates in Imabari City, Saturday, September 12 built at a steady pace from early on — from 47.7% at LT45 to 72.7% at LT14 and 91.2% at LT1. Wednesday, September 16 stood at 42.5% at LT45 and only 57.5% even at LT14, but added 26.6 points in the final two weeks to reach 84.1% at LT1.
Interestingly, another Wednesday — September 9 — had already advanced to 62.6% at LT45 and reached 94.9% at LT1, surpassing the Saturday. Weekday demand is not uniform: days that fill early and days that surge at the last minute coexist. This is likely because business travel tends to be tied to specific events and production schedules, but the cause cannot be identified from public OTA data alone. From an operating perspective, identifying early those weekdays whose pace is fast before LT14 and linking them to stepped pricing creates room for further revenue growth. For an analysis comparing, by segment, how Saturdays across Ehime Prefecture build from 45 days out, see Ehime Saturday Booking Curves: Aug +14.7pt, Sep Flat at +1.2pt.
Where Rates Stand — Imabari City at ¥7,233, the Four New Builds About 1.5× Older Properties
How have rates moved? On a 12-month average basis, Imabari City’s estimated settled ADR (monthly median across properties, N=30–32 properties) was ¥7,233 for September 2025–August 2026 versus ¥7,085 for September 2024–August 2025, up 2.1% YoY. By month, May, November, and January are high and June is the annual low — a clear seasonal pattern. For reference, in a single-month cross-section for June 2026, Imabari City stood at about ¥6,100.
| City | Estimated settled ADR (Sep 2024–Aug 2025) | Same (Sep 2025–Aug 2026) | YoY | Properties covered |
|---|---|---|---|---|
| Matsuyama | ¥9,487 | ¥9,963 | +5.0% | N=85–90 |
| Imabari | ¥7,085 | ¥7,233 | +2.1% | N=31–32 |
| Niihama | ¥5,717 | ¥5,792 | +1.3% | N=10–11 |
| Saijo | ¥5,262 | ¥5,767 | +9.6% | N=19–21 |
Set against the prefecture’s industrial cities, Imabari falls short of Matsuyama’s roughly ¥10,000 but sits about ¥1,400 above the roughly ¥5,800 of Niihama and Saijo. The citywide figure includes properties on the islands, however, so the reality around the station needs to be checked separately. Isolating the 15 properties within 2 km of the station with a complete 12-month series (1,461 rooms), the median across properties was essentially flat at ¥5,849 (¥5,843 a year earlier), while the room-weighted average was ¥8,002 (¥8,466 a year earlier). In a phase when 327 rooms of new supply were in place for a full year, the area can be read as having filled rooms while giving up some rate.
Two points can be read from this positioning. First, the 12-month averages of the four new builds opened since 2021 range from about ¥6,300 to ¥8,700, with a median of about ¥7,500 — roughly 1.5 times the median of about ¥5,000 for the 11 properties opened earlier. Newness and specifications such as large public baths and cyclist facilities show up as a rate gap. Second, there is not a single property between about ¥8,700 and about ¥12,300. The ¥9,000–12,000 band, between the one full-service property at the top and the cluster of new limited-service hotels, is currently a vacant price band.
The dense zone
¥5,000–7,000 × 36–121 rooms
7 properties, 583 rooms. The core price band where existing business hotels near the station cluster.
The zone formed by new builds
¥7,000–8,700 × 146–175 rooms
3 properties, 473 rooms. Limited-service hotels with large public baths and cyclist facilities.
The vacant price band
¥9,000–12,000
No properties. The upside for an upper-tier limited-service hotel that captures leisure demand on weekends and event dates.
Development Scenario Model — 4–6% Yield for a 150-Room Limited-Service Hotel
Using the figures so far, we run a simplified model for building a new 150-room limited-service hotel in front of the station. Gross floor area is set at 3,900㎡ (about 1,180 tsubo), based on 26㎡ per room (guest rooms of around 18㎡, with guest rooms accounting for about 70% of floor area), and the site at 780㎡ on the assumption of a 500% FAR. Applying the official land price of the highest-priced station-front site, ¥101,000/㎡, land comes to about ¥80 million. For construction cost we adopt the 2025 unit cost for steel-frame construction of ¥2.405 million per tsubo, based on MLIT’s Building Starts Statistics, giving about ¥2.84 billion. The GOP margin is set at 45%. The actual GOP margin of the 91 operating properties disclosed by Invincible Investment Corporation (インヴィンシブル投資法人) was 38.9% (fiscal period ended December 2024), and the general guideline for limited-service hotels is said to be 50–60%, so this is a conservative level between the two.
| Item | Case 1: In line with the market | Case 2: In line with the top new builds |
|---|---|---|
| Rooms | 150 | 150 |
| ADR assumption | ¥7,500 (median of the four new builds) | ¥8,700 (upper end of the new builds) |
| Occupancy assumption | 75% | 80% |
| Room revenue (annual) | ¥308 million | ¥381 million |
| GOP (45%) | ¥139 million | ¥171 million |
| Total investment (2025 actual cost basis) | ¥2.92 billion | ¥2.92 billion |
| GOP yield (2025 actual cost basis) | 4.8% | 5.9% |
| Total investment (construction-period inflation included) | ¥3.36 billion | ¥3.36 billion |
| GOP yield (same basis) | 4.1% | 5.1% |
What the model shows is a structure in which land is only about 2.7% of the roughly ¥2.92 billion total investment, with construction cost making up the rest. Even if land prices fall 1–2% a year, the investment amount barely changes; a 10% move in construction cost has a far larger effect on yield. Because rising construction costs also work to slow the pace of new entry, they can be a factor that stabilizes the competitive environment for properties already operating.
| Case 2 sensitivity | Base | ADR −10% | Occupancy −5pt | Both |
|---|---|---|---|---|
| Room revenue (annual) | ¥381 million | ¥343 million | ¥357 million | ¥322 million |
| GOP | ¥171 million | ¥154 million | ¥161 million | ¥145 million |
| GOP yield (2025 actual cost basis) | 5.9% | 5.3% | 5.5% | 5.0% |
| GOP yield (inflation included) | 5.1% | 4.6% | 4.8% | 4.3% |
Stepping away from the case settings, the next table moves ADR and occupancy together. Against total investment of ¥2.92 billion on the 2025 actual cost basis, Case 1 — ADR ¥7,500 and 75% occupancy (assumed full-year value) — corresponds to 4.8%, and Case 2 — ADR ¥8,700 and 80% occupancy (same) — to 5.9%. The 6% GOP yield line is crossed at an ADR of about ¥8,900 or more with 80% occupancy (assumed full-year value), or about ¥9,500 or more at 75% — both of which fall in the ¥9,000–12,000 band where no property currently exists within 2 km of the station.
| ADR \ Occupancy (assumed full-year value) | 65% | 70% | 75% | 80% | 85% |
|---|---|---|---|---|---|
| ¥6,500 | 3.6% | 3.8% | 4.1% | 4.4% | 4.7% |
| ¥7,500 | 4.1% | 4.4% | 4.8% | 5.1% | 5.4% |
| ¥8,700 | 4.8% | 5.1% | 5.5% | 5.9% | 6.2% |
| ¥10,000 | 5.5% | 5.9% | 6.3% | 6.8% | 7.2% |
| ¥11,000 | 6.0% | 6.5% | 7.0% | 7.4% | 7.9% |
Looking at combinations of construction cost and GOP margin makes the picture even clearer. Holding Case 2’s room revenue of ¥381 million fixed and raising the unit cost from ¥2.405 million to ¥2.779 million per tsubo lowers the yield at a 45% GOP margin from 5.9% to 5.1%; recovering the 5.9% level requires raising the GOP margin to about 52%. To reach a 6% yield on total investment of ¥3.36 billion with construction-period inflation included, an ADR of about ¥10,200 is needed at 80% occupancy (assumed full-year value). A product designed to capture the middle of the vacant price band is the precondition for securing yield at this location.
| Construction cost (per tsubo) | Total investment | GOP margin 40% | 45% | 50% | 55% |
|---|---|---|---|---|---|
| ¥2.20 million | ¥2.67 billion | 5.7% | 6.4% | 7.1% | 7.8% |
| ¥2.405 million (2025 actual) | ¥2.92 billion | 5.2% | 5.9% | 6.5% | 7.2% |
| ¥2.60 million | ¥3.15 billion | 4.8% | 5.5% | 6.1% | 6.7% |
| ¥2.779 million (inflation included) | ¥3.36 billion | 4.5% | 5.1% | 5.7% | 6.2% |
| ¥3.00 million | ¥3.62 billion | 4.2% | 4.7% | 5.3% | 5.8% |
This is a simplified model; an actual investment decision requires a detailed feasibility study. In particular, estimated settled ADR is a tax-exclusive equivalent estimate and does not include breakfast or ancillary revenue.
Investment Perspective — Designing the Price Band and the Upside on Weekends and Event Dates
To summarize, what has supported the +64% supply growth around Imabari Station is neither population nor land prices but two pillars: weekday demand from the maritime industry and weekend demand from the Shimanami Kaido. Occupancy (estimated) of about 80% Tuesday through Thursday and 82.2% on Saturday are figures recorded after the four hotels and 594 rooms were added, indicating that there was commensurate depth on the demand side.
| Issue | Confirmed facts | Points to focus on in a review |
|---|---|---|
| Demand | Twin peak of 79.8% Tue–Thu and 82.2% on Saturday | Lifting Sunday (65.9%) and Friday (71.4%) is the upside. Capturing multi-night stays and cyclists’ pre- and post-ride nights should be effective |
| Rate | Median of about ¥7,500 for the four new builds; the ¥9,000–12,000 band is vacant | Room for an upper-tier limited-service hotel. Saturday and event-date rates well above weekday levels provide support |
| Supply | 594 rooms in total opened in 2021 and 2024 | The room-weighted average rate within 2 km of the station adjusted year on year. The timing and scale of additional supply should be judged carefully |
| Cost | Land is about 3% of total investment; construction is the bulk | Construction cost movements drive yield. Timing of the construction start and choice of structure are key |
| Long term | Resident population within 1 km in 2040 is projected at −27.9% vs. 2020 | Assume local demand and the labor pool will shrink. Factor in dependence on outside demand (business, tourism, inbound) |
For developers and financial institutions considering limited-service hotels in Shikoku and the Seto Inland Sea region, Imabari is the type of city that would be passed over on population and land prices alone but merits consideration once measured demand is examined. As next steps, the starting points would be to check how maritime-related event schedules correspond to weekday booking pace, and to work backward from the track record of the existing new builds to a product specification that works in the ¥9,000–12,000 band.
⚠ Note on ADR for future dates: The October 2026 listed prices mentioned in this article are the selling prices published on OTAs as of the survey date (October 3, 2026) and will change as the check-in date approaches. Please note that prices currently set high may fall through last-minute discounting. Year-on-year comparisons of estimated settled ADR use only finalized months through August 2026.
Related Articles
| Japan’s 12 National Cycle Routes: 29,454 Rooms and an Autumn ADR Peak |
| Japan’s Second Cities: 21 Prefectures Where the Capital Isn’t #1 |
| Ehime Saturday Booking Curves: Aug +14.7pt, Sep Flat at +1.2pt |
References and Sources
■ Data sources
Room supply time series = the 24 OTA-listed properties tracked by MetroEngines Research (as of October 3, 2026) that are located within a 2 km radius of JR Imabari Station (34.0659°N, 132.9976°E) and whose opening year can be confirmed. Estimated settled ADR = monthly median across properties for Imabari, Matsuyama, Niihama, and Saijo (September 2024–August 2026; Imabari N=30–32 properties), and the 12-month average for the 15 properties (1,461 rooms) within 2 km of the station with a complete 12-month series. Occupancy (estimated) = 113 stay dates from June 10 to September 30, 2026, for all segments in Imabari City (24–26 properties covered) and business hotels in Ehime Prefecture (48–50 properties covered). Land prices = MLIT official land prices (commercial land, 4 sites within 1 km of the station, 2022–2026). Population = National Land Numerical Information, 250 m mesh population projections; employment = Economic Census for Business Activity (2021).
■ Model assumptions
150 rooms, gross floor area 3,900㎡ (26㎡ per room), site 780㎡ (500% FAR). Land = official land price of the highest-priced station-front site, ¥101,000/㎡; construction cost = 2025 steel-frame cost of ¥2.405 million per tsubo from the Building Starts Statistics (the inflation-included case uses ¥2.779 million per tsubo, assuming increases over 2026–2028). GOP margin 45% (between Invincible Investment Corporation’s actual 38.9% for the fiscal period ended December 2024 and the general guideline of 50–60% for limited-service hotels). ADR is estimated settled ADR (tax-exclusive equivalent, excluding breakfast and ancillary revenue); occupancy is an assumed full-year value made with reference to Imabari City’s estimated figure (113-day average of 76.0%). GOP yield = GOP ÷ total investment, before deduction of rent, property tax, insurance, and depreciation.
■ Limitations and caveats
The supply time series applies current room counts to past years and does not reflect changes from extensions or renovations. Occupancy is an estimate based on consumption of OTA-listed inventory and differs from the actual occupancy of the entire property; because it covers the 113 days from June to September 2026, it does not capture full-year seasonality. Estimated settled ADR has a median error of about 7.5% when compared with results disclosed by listed hotel REITs. October 2026 listed prices are selling prices as of the survey date and may change. The model is a simplified estimate that excludes acquisition costs, pre-opening expenses, and interest, and does not address disaster risk or site-specific regulations.
■ Market data
- MetroEngines Research & Consulting — Estimated settled ADR (Imabari City N=28–32 properties; within 2 km of the station N=15 properties), estimated occupancy (Imabari City, 24–26 properties / 1,029–1,053 rooms covered), booking curves, room supply time series (24 properties, 1,524 rooms)
■ Government statistics and public data
- MLIT Real Estate Information Library — Official land prices (2022–2026)
- MLIT National Land Numerical Information — 250 m mesh population projections
- Ministry of Internal Affairs and Communications / Ministry of Economy, Trade and Industry, “Economic Census for Business Activity (2021)”
- MLIT, “Building Starts Statistics”
- Imabari City, “About Imabari, Japan’s Largest Maritime City” (日本最大の海事都市今治とは)
- Onomichi City Industry Department, Tourism Division, “Initiatives on the Setouchi Shimanami Kaido” (December 23, 2024)
■ REIT and industry reports
■ News and press releases
- [Ehime] Hotel Route-Inn Imabari to open Saturday, June 8 (PR TIMES)
- Heiwa Kosan to open hotel on the 28th near JR Imabari Station, 152 rooms (Ehime Shimbun, March 25, 2024)
- Shikoku Railway Company / JR Shikoku Hotels, notice of opening date for JR Clement Inn Imabari (May 31, 2021)
- Super Hotel Imabari grand opening on April 29 (PR TIMES, 2021)
- Cycling Shimanami 2026 — Setouchi Shimanami Kaido International Cycling Event, official site