

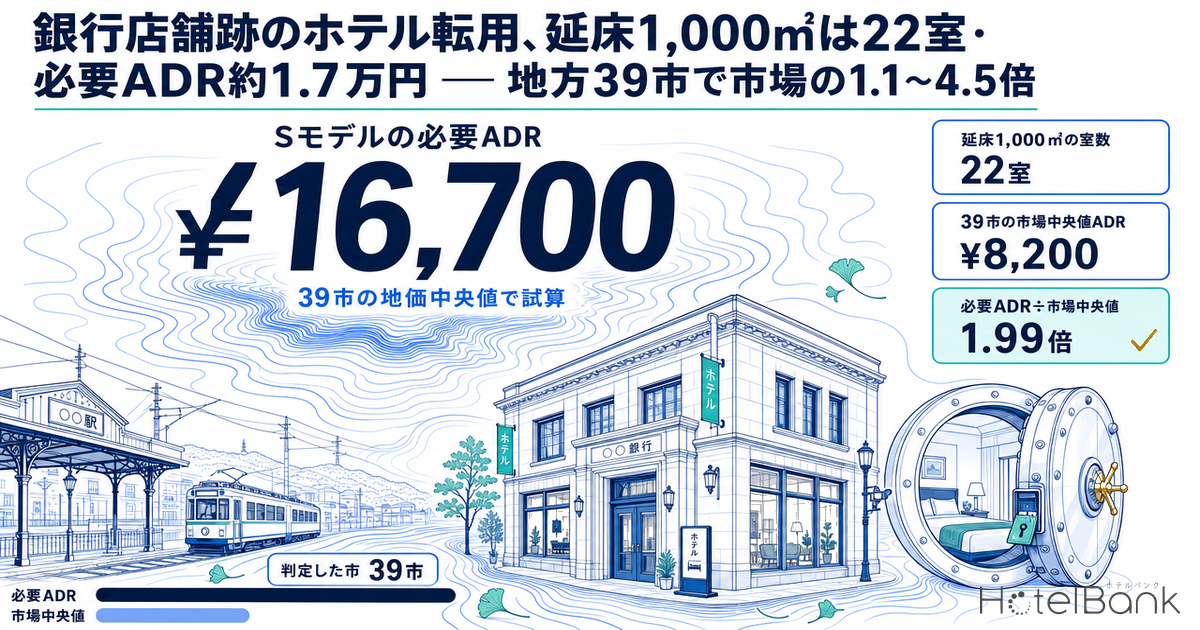
As banks consolidate their branch networks, small two- to three-storey buildings are falling vacant on corner lots in front of stations and along main streets. The ground floor holds a high-ceilinged banking hall; at the back sits a vault enclosed by thick walls; the upper floors were offices. They are close to the station, on corners, and highly visible — an almost ideal location for lodging. Yet how many rooms such a building can actually hold as a hotel, and at what price those rooms must sell for the investment to pay off, has rarely been discussed in numbers.
This article narrows the conversion source to financial-institution branches. We lay out rooms for three models — 1,000㎡, 2,000㎡ and 3,000㎡ of gross floor area — stack up acquisition, renovation and pre-opening costs, and back-calculate the required ADR. We then compare it with the estimated achieved ADR in 39 prefectural capitals and regional core cities. The bottom line first: a typical 1,000㎡ branch building yields 22 rooms, and at the median land price of the 39 cities the required ADR is about ¥16,700. That is 1.13–4.49x the market median (median 1.99x), so the conditions for viability are either a scale of 2,000㎡ or more, or a product priced in the upper band of existing small hotels.
Metric Definitions Used in This Article
- ADR (Average Daily Rate): An estimated achieved rate (tax-excluded equivalent), calculated by applying segment-specific adjustment factors to the lowest-plan rate each property publishes on OTAs and similar channels (per room, 2 guests per room, tax-inclusive). Checked against property-level results disclosed by listed hotel REITs (91 properties, most recent 3 months), the median error is about 7%. These are estimates and differ from each property’s actual achieved rates and accounting figures. Area-level ADR is the median of the target properties (the level of a typical property in the area). The “market median ADR” in this article is the 12-month average of monthly medians from September 2025 to August 2026, weighted by the number of target properties.
- OCC (Occupancy Rate): Not used as an observed value in this article; it appears only as a modeling assumption (80%) for back-calculating the required ADR.
- Required ADR (back-calculated): The room rate needed to meet the target NOI yield on the assumed total investment. Required ADR = (total investment × target NOI yield) ÷ GOP ratio ÷ (rooms × 365 days × OCC). It is a theoretical value under the conservative assumption that the investment is recovered from room revenue alone, not a business-plan figure for any actual project.
- Listed price: For segments such as hostels and guesthouses, whose adjustment factors have not been validated, we show for reference the per-room rate for 2 guests (tax-inclusive, average of all plans) as is. Its level differs from estimated achieved ADR, so the two are not compared directly.
- Data sources: MetroEngines Research & Consulting / MLIT National Land Numerical Information (Official Land Price Publication, 2026) / MLIT Statistics on Building Construction Starts
- — Staffed bank branches fell by an average of 416 a year (2018–2022). Regional banks also closed 169 physical branches in FY2023, releasing low-rise buildings of around 1,000㎡ in front of stations.
- — A 1,000㎡ branch yields 22 rooms. Because the ground floor becomes common space, GFA per room is 45.5㎡ — about 30% heavier than the benchmark for limited-service hotels (about 35㎡).
- — Model S requires an ADR of about ¥16,700 (at the 39-city median land price, assuming 80% year-round OCC). That is 1.13–4.49x the market median ADR, with a median of 1.99x.
- — At 2,000㎡ or more the median multiple drops to 1.54x (1.46x for Model L). The benefit of scale is greatest from 1,000㎡ to 2,000㎡.
- — Only 4.6% of existing properties with 59 rooms or fewer exceed the Model S level (19 of 412). Viability depends on designing a product for the upper band of small city hotels, or building in ground-floor F&B and tenant income.
How This Differs from Our Conversion Series — Focusing on Financial-Institution Branches
HotelBank has examined the decision to turn existing buildings into hotels one conversion source at a time. Office conversions compared large typical floors on revenue per tsubo; department store sites tracked 14 cases and estimated the required ADR for 300-room projects at 1.4–3.1x the market median; and aging malls and warehouses covered large-span suburban buildings. All of these discussions assumed a large floor plate.
Bank branches turn that assumption upside down. They are small in floor area, low-rise and close to the station, and they contain rooms no other conversion source has: a vault and a large-span banking hall. The role of this article is to start from the fact that the room count cannot grow, and to work backwards to the scale and price band at which the numbers work. We use the same yardstick as the department store article — required ADR ÷ market median — so the multiples can be compared directly.
| Conversion source | Building scale | Location | Building conditions that matter | Relation to this article |
|---|---|---|---|---|
| Office buildings | Large; big typical floors | Central business districts | Floor depth, window frontage, MEP capacity | Compared on revenue per tsubo (published) |
| Department store sites | Large; assumes rebuild/redevelopment | City centers | FAR and joint-development schemes | Shares the required-ADR yardstick (published) |
| Aging malls & warehouses | Large, low-rise | Suburbs, logistics locations | Large spans, ceiling height, parking | Suburban type (published) |
| Bank branches | Small boxes of about 1,000㎡ GFA | Station fronts, main streets | Ground-floor banking hall (large space, wide openings), vault, upper-floor offices | This article |
Source: Compiled by HotelBank Editorial Team
Floor Space Released by Consolidation — Staffed Bank Branches Fell by 416 a Year in 2018–2022
Start with the population. According to research by Toshihiro Sugiyama of Edogawa University, who compiled the number of staffed domestic bank branches since 1873 (Bulletin of Edogawa University, No. 34, 2024), bank branch numbers peaked around 1993, just after the collapse of the Heisei bubble, and fell by nearly 6,600 over the roughly 30 years to 2022. The decline was not uniform: there were two waves of mass closures, averaging 456 a year during the bad-loan clean-up of 1999–2005 and 416 a year during the negative-interest-rate period of 2018–2022.
Recent movements can be tracked through regional banks. According to Nikkin’s tally, regional banks had 8,211 physical branches at the end of March 2024, down 169 (2%) in one year. We say “physical” because many consolidated branches keep their signboard inside another branch as a “branch-in-branch.” Even when the published branch count does not fall, the building is vacated. The Japan Center for Economic Research pointed out in a 2021 analysis that regional banks’ physical branch count is about 10% lower than the published figure. The statistical decline in branch numbers does not necessarily reflect the number of buildings that become vacant.
As for where the vacated buildings went, there is research tracking the major consolidation of city banks. A survey by Mayuko Ando and Yoko Sone of Nihon University found that city-bank branches in Chuo Ward, Tokyo fell from 87 before consolidation to 48 (down 45%), and 33 of the 39 closed branches (85%) were converted to other uses rather than demolished. Among change-of-use cases accepted by the Tokyo Fire Department in 2002 and 2003, conversions from banks numbered 102, second only to offices (301). However, the top new uses were convenience stores (15), retail shops (12), and restaurants and cafés; hotels did not appear near the top. Bank branch floor space has so far been absorbed mainly by street-level retail and food service.
Source: Compiled by MetroEngines Research & Consulting from MLIT “Statistics on Building Construction Starts” (e-Stat, by use and by owner)
New-build statistics give a rough idea of building size. In the building construction starts statistics, 7,950 buildings classified as “for finance and insurance” were started in 2011–2024, with an average floor area of 768㎡ per building (751㎡ in 2020–2024). This average includes large insurance-company buildings, and many neighborhood branches are smaller. That is why we set 1,000㎡ of GFA as the representative model for a “typical branch building.”
Building Conditions — 60% of Bank Sites Among Official Land Price Points Are Two-Storey, on Lots Over Twice the Commercial Average
We check branch-building conditions against MLIT’s Official Land Price Publication (2026). Of the 6,509 commercial-land benchmark points nationwide, 119 include a bank in the “current use” field of the appraisal report. The table below compares them with commercial land as a whole.
| Item | Points whose current use includes “bank” | All commercial benchmark points |
|---|---|---|
| Number of points | N=119 | N=6,509 |
| Median site area | 737㎡ | 322㎡ |
| Median above-ground storeys | 2 | 3 |
| Share with 3 storeys or fewer | 84.0% | 61.8% |
| Structure: Steel / RC / SRC | 45% / 44% / 9% | 46% / 27% / 10% |
| Median designated FAR | 300% | 400% |
| Median upper-bound FAR utilization (storeys × BCR ÷ FAR) | 60% | 80% |
| Median distance to nearest station | 550m | 550m |
Source: Compiled by MetroEngines Research & Consulting from MLIT National Land Numerical Information (Official Land Price Publication, 2026) (bank points N=119, commercial land N=6,509)
Two-storey buildings account for 60.5% of bank points, and 84.0% have three storeys or fewer. The median site is 737㎡, more than twice that of commercial land as a whole (322㎡), and the structures are split roughly evenly between steel and reinforced concrete. The median designated FAR is 300%, but even assuming each floor is built to the full building coverage ratio, the median FAR utilization is only 60%. A low building sitting on a wide lot is the typical picture of a bank branch.
Source: Compiled by MetroEngines Research & Consulting from MLIT National Land Numerical Information (Official Land Price Publication, 2026)
Let us look room by room at how this shape plays out in a hotel conversion. The ground-floor banking hall has a waiting area where large numbers of walk-in customers gather, and large openings facing the street. A high-ceilinged space with few columns suits a lobby, breakfast room or street-level restaurant tenant, but its depth and the position of its openings do not fit a row of guest rooms. The vault is enclosed by thick walls and a heavy door, has no windows, and new openings are hard to create. It naturally goes to common areas that need no windows, such as luggage storage, a linen room or a bar. In practice, only the upper-floor office areas can become guest rooms.
| Floor | Typical use as a bank branch | Layout after conversion (Model S) | How the area works |
|---|---|---|---|
| 1F | Banking hall (waiting area, counters), reception room, vault | Lobby/front desk, breakfast/lounge, back office; former vault as luggage storage/linen room | No guest rooms; all 340㎡ is common space |
| 2F | Offices, meeting rooms, staff canteen/break room | 11 guest rooms (18㎡) + corridor, stairs, elevator, shafts | Two stairs, elevator and shafts take ~45㎡; corridor ~28% of the rest |
| 3F | Offices, archive, machine room | 11 guest rooms (18㎡) + corridor, stairs, elevator, shafts | Same as above |
| Total | 1,000㎡ GFA | 22 rooms, 396㎡ of room area | Room area = 39.6% of GFA |
Source: Compiled by MetroEngines Research & Consulting (model layout)
With this layout, a three-storey building of 1,000㎡ GFA holds 22 rooms, for 45.5㎡ of GFA per room. That is about 30% heavier than the roughly 35㎡ benchmark for limited-service hotels, and larger than the median of 26.2㎡ and top-quartile 33.5㎡ for operating business hotels (283 properties) in our earlier tally. The reason is that the entire 340㎡ ground floor becomes common space, and the area every floor must have — stairs, elevator and service shafts — is borne by only two floors of rooms. Expanding to 2,000㎡ (four storeys) gives 37.0㎡, and 3,000㎡ (five storeys) gives 35.7㎡; the per-room ratio approaches the norm as scale increases.
Regulatory details are left to a separate article, but the key points are these. A change of use from office or retail to hotel requires a building confirmation application if the converted portion exceeds 200㎡, and using floors at the third storey or above as a hotel triggers fire-resistant building requirements. At 2,000㎡ GFA or more and 50 rooms or more, the Barrier-Free Act requires at least 1% of all guest rooms to be wheelchair-accessible (effective September 2019). Model M (2,000㎡, 54 rooms) just crosses this line. On the other hand, the amended Hotel Business Act effective June 2018 abolished the minimum room count, and allowed the front desk to be replaced by ICT equipment under certain conditions — a tailwind for operating small buildings.
Assumptions and Total Investment for Three Models — ¥34 Million per Room for a 1,000㎡ Branch
For the three models we stack up costs from acquisition to opening. Land is the site area multiplied by the official land price of each city’s station-front commercial land (2026, highest-priced commercial point within 500m of the nearest station). Buildings are assumed to be over 30 years old, with a residual value of ¥60,000 per ㎡ of GFA. For renovation cost we use, unchanged, the ¥1.344 million per tsubo (60% of new-build cost) set as the “existing-structure reuse case” in the department store article, keeping the basis of comparison consistent. Operating assumptions are also common: 80% year-round OCC, 35% GOP ratio and a 5.0% target NOI yield.
| Assumption | S (small) | M (medium) | L (large) |
|---|---|---|---|
| Gross floor area | 1,000㎡ (approx. 302 tsubo) | 2,000㎡ (approx. 605 tsubo) | 3,000㎡ (approx. 908 tsubo) |
| Floors | 3 storeys (1F 340㎡; 2F–3F 330㎡ each) | 4 storeys (500㎡ each) | 5 storeys (1F 700㎡; 2F–5F 575㎡ each) |
| Site area | 500㎡ | 750㎡ | 1,000㎡ |
| Ground-floor use | Lobby, front desk, breakfast, back office, former vault | Same | Same |
| Room size (wall-center) | 18㎡ | 18㎡ | 18㎡ |
| Rooms | 22 | 54 | 84 |
| GFA per room | 45.5㎡ | 37.0㎡ | 35.7㎡ |
| Room area as % of GFA | 39.6% | 48.6% | 50.4% |
| Land cost | Site × official price of the city’s station-front commercial land (highest point) | Same | Same |
| Building cost | GFA × ¥60,000/㎡ (assumed residual value, 30+ years old) | Same | Same |
| Acquisition expenses | 5% of land and building cost | Same | Same |
| Renovation cost | ¥1.344M/tsubo (60% of new-build) | Same | Same |
| Contingency | 10% of renovation cost | Same | Same |
| FF&E and pre-opening | ¥1.5M per room + ¥10M | Same | Same |
| Operating assumptions | 80% year-round OCC, 35% GOP ratio, 5.0% target NOI yield (all modeling assumptions) | Same | Same |
Source: Compiled by MetroEngines Research & Consulting. Renovation cost assumed at 60% of new-build unit cost based on MLIT building construction starts statistics. OCC, GOP ratio and target yield are modeling assumptions.
Source: MetroEngines Research & Consulting
At the 39-city median land price (¥377,000/㎡), total investment is ¥751 million for Model S, ¥1.408 billion for M and ¥2.063 billion for L. In every case the largest items are renovation and contingency, which account for about 60% of total investment in Model S. Per room, that is ¥34.14 million for S, ¥26.08 million for M and ¥24.55 million for L. The smaller the building, the heavier the per-room cost, because the renovation of the non-room ground floor and the shared core is divided over fewer rooms. Across the 39 cities the land share for Model S ranges widely from 9% to 65% (median 25%); in many regional cities, renovation cost rather than land determines the required ADR.
Source: MetroEngines Research & Consulting (back-calculated with assumed 80% year-round OCC, 35% GOP ratio and 5.0% target NOI yield)
With land price on the horizontal axis, the slope of required ADR differs greatly by model. For every ¥100,000/㎡ rise in land price, the required ADR rises by about ¥1,200 for Model S and about ¥600 for Model L. Even in a city with land at ¥100,000/㎡, Model S needs about ¥13,500, short of the 39-city market median (¥8,200). Cheap land does not bring a small building’s required ADR all the way down; the floor is set by renovation cost and room count.
Comparison with Market ADR — Required ADR Is 1.13–4.49x the Market Median Across 39 Cities
We calculated the required ADR at each city’s land price and divided it by that city’s median estimated achieved ADR. As a guide, 1.2x or below is the “viable zone” reachable as an extension of standard pricing; 1.2–2.0x requires pricing in the upper band; and above 2.0x a stand-alone hotel is difficult, so mixed use or partial leasing should be considered.
For Model S (1,000㎡, 22 rooms), 2 cities were at 1.2x or below, 19 at 1.2–2.0x and 18 above 2.0x. For Model M (2,000㎡, 54 rooms), 7 cities were at 1.2x or below and 7 above 2.0x; for Model L (3,000㎡, 84 rooms) this improves to 7 cities at 1.2x or below and 5 above 2.0x. The median multiple is 1.99x for S, 1.54x for M and 1.46x for L, with the biggest improvement coming from expanding GFA from 1,000㎡ to 2,000㎡. Compared with 300-room department store site projects (1.4–3.1x), Models M and L fall in a similar band, while Model S is a notch heavier.
Source: MetroEngines Research & Consulting / MLIT National Land Numerical Information (Official Land Price Publication, 2026) (N=39 cities; market medians cover 2,067 properties in total)
Note that the cities with low multiples — Matsue, Matsumoto, Yamagata and Otsu — include hot-spring towns or resorts within city limits, where ryokan push up the market median. What a station-front limited-service hotel actually competes with is business hotels. Re-dividing by the business-hotel median gives multiples of 1.76–4.94x for S (median 2.25x), 1.37–3.42x for M (median 1.71x) and 1.30–3.10x for L (median 1.62x), and no city falls at 1.2x or below. A design priced alongside standard business hotels makes a small station-front building hard to run in any city.
At the other end, the high-multiple cities — Naha, Himeji, Kagoshima, Oita and others — are those with expensive station-front land. Station-front commercial land is ¥2.26 million/㎡ in Naha and ¥1.66 million/㎡ in Himeji, and land accounts for around 60% of total investment in Model S. In these cities, success hinges less on the market’s ADR level than on the price at which land can be secured. How far the required ADR falls if the land is secured through a fixed-term business land lease instead of a purchase is the subject of a separate simulation of 15 station-front commercial areas.
Source: MetroEngines Research & Consulting / MLIT National Land Numerical Information (Official Land Price Publication, 2026)
| City | Station-front commercial land price (¥/㎡) | Market median ADR | Business hotel median | S required ADR / multiple | M required ADR / multiple | L required ADR / multiple |
|---|---|---|---|---|---|---|
| Matsue (Shimane) | 175,000 | ¥12,661 N=54 | ¥7,268 N=18 | ¥14,346 1.13x | ¥11,318 0.89x | ¥10,777 0.85x |
| Matsumoto (Nagano) | 245,000 | ¥13,281 N=101 | ¥8,597 N=31 | ¥15,163 1.14x | ¥11,818 0.89x | ¥11,205 0.84x |
| Yamagata | 220,000 | ¥12,269 N=59 | ¥7,549 N=22 | ¥14,871 1.21x | ¥11,639 0.95x | ¥11,052 0.90x |
| Otsu (Shiga) | 394,000 | ¥12,586 N=33 | ¥8,583 N=12 | ¥16,902 1.34x | ¥12,881 1.02x | ¥12,116 0.96x |
| Aomori | 201,000 | ¥10,124 N=39 | ¥8,293 N=22 | ¥14,649 1.45x | ¥11,504 1.14x | ¥10,936 1.08x |
| Shimonoseki (Yamaguchi) | 190,000 | ¥9,581 N=40 | ¥7,006 N=17 | ¥14,521 1.52x | ¥11,425 1.19x | ¥10,869 1.13x |
| Nagano | 385,000 | ¥11,039 N=75 | ¥8,465 N=30 | ¥16,797 1.52x | ¥12,816 1.16x | ¥12,061 1.09x |
| Saga | 346,000 | ¥9,827 N=33 | ¥7,311 N=11 | ¥16,342 1.66x | ¥12,538 1.28x | ¥11,823 1.20x |
| Hakodate (Hokkaido) | 181,000 | ¥8,560 N=85 | ¥7,370 N=47 | ¥14,416 1.68x | ¥11,361 1.33x | ¥10,814 1.26x |
| Tottori | 114,000 | ¥8,047 N=34 | ¥7,093 N=14 | ¥13,633 1.69x | ¥10,883 1.35x | ¥10,404 1.29x |
| Kurashiki (Okayama) | 216,000 | ¥8,451 N=42 | ¥7,405 N=24 | ¥14,824 1.75x | ¥11,611 1.37x | ¥11,028 1.30x |
| Yamaguchi | 165,000 | ¥8,092 N=29 | ¥7,010 N=16 | ¥14,229 1.76x | ¥11,247 1.39x | ¥10,716 1.32x |
| Asahikawa (Hokkaido) | 253,000 | ¥8,614 N=37 | ¥8,596 N=30 | ¥15,256 1.77x | ¥11,875 1.38x | ¥11,254 1.31x |
| Maebashi (Gunma) | 123,000 | ¥7,467 N=30 | ¥6,630 N=17 | ¥13,738 1.84x | ¥10,947 1.47x | ¥10,459 1.40x |
| Nara | 992,000 | ¥12,899 N=59 | ¥9,232 N=23 | ¥23,884 1.85x | ¥17,147 1.33x | ¥15,774 1.22x |
| Miyazaki | 217,000 | ¥8,008 N=57 | ¥7,692 N=36 | ¥14,836 1.85x | ¥11,618 1.45x | ¥11,034 1.38x |
| Fukushima | 256,000 | ¥8,250 N=69 | ¥6,346 N=20 | ¥15,291 1.85x | ¥11,896 1.44x | ¥11,273 1.37x |
| Akita | 204,000 | ¥7,586 N=30 | ¥7,723 N=18 | ¥14,684 1.94x | ¥11,525 1.52x | ¥10,955 1.44x |
| Tsu (Mie) | 255,000 | ¥7,703 N=27 | ¥6,710 N=14 | ¥15,280 1.98x | ¥11,889 1.54x | ¥11,266 1.46x |
| Mito (Ibaraki) | 265,000 | ¥7,738 N=34 | ¥7,160 N=28 | ¥15,396 1.99x | ¥11,960 1.55x | ¥11,328 1.46x |
| Fukui | 454,000 | ¥8,828 N=37 | ¥9,075 N=12 | ¥17,603 1.99x | ¥13,309 1.51x | ¥12,483 1.41x |
| Kofu (Yamanashi) | 304,000 | ¥7,809 N=37 | ¥7,505 N=26 | ¥15,852 2.03x | ¥12,238 1.57x | ¥11,566 1.48x |
| Takamatsu (Kagawa) | 480,000 | ¥8,189 N=71 | ¥7,957 N=52 | ¥17,906 2.19x | ¥13,494 1.65x | ¥12,642 1.54x |
| Morioka (Iwate) | 333,000 | ¥7,335 N=42 | ¥6,665 N=23 | ¥16,190 2.21x | ¥12,445 1.70x | ¥11,743 1.60x |
| Nagasaki | 851,000 | ¥9,955 N=63 | ¥7,859 N=34 | ¥22,238 2.23x | ¥16,141 1.62x | ¥14,911 1.50x |
| Matsuyama (Ehime) | 870,000 | ¥9,958 N=88 | ¥6,834 N=35 | ¥22,460 2.26x | ¥16,277 1.63x | ¥15,027 1.51x |
| Koriyama (Fukushima) | 415,000 | ¥7,459 N=51 | ¥6,590 N=25 | ¥17,148 2.30x | ¥13,030 1.75x | ¥12,245 1.64x |
| Wakayama | 460,000 | ¥7,272 N=44 | ¥6,031 N=27 | ¥17,673 2.43x | ¥13,351 1.84x | ¥12,520 1.72x |
| Gifu | 707,000 | ¥8,355 N=32 | ¥6,743 N=21 | ¥20,557 2.46x | ¥15,114 1.81x | ¥14,031 1.68x |
| Takasaki (Gunma) | 522,000 | ¥7,362 N=31 | ¥6,900 N=24 | ¥18,397 2.50x | ¥13,794 1.87x | ¥12,899 1.75x |
| Utsunomiya (Tochigi) | 530,000 | ¥7,298 N=50 | ¥7,137 N=41 | ¥18,490 2.53x | ¥13,851 1.90x | ¥12,948 1.77x |
| Kanazawa (Ishikawa) | 1,230,000 | ¥10,223 N=116 | ¥8,837 N=82 | ¥26,663 2.61x | ¥18,845 1.84x | ¥17,229 1.69x |
| Tokushima | 377,000 | ¥6,365 N=50 | ¥6,045 N=36 | ¥16,704 2.62x | ¥12,759 2.00x | ¥12,013 1.89x |
| Toyama | 654,000 | ¥6,988 N=57 | ¥6,736 N=36 | ¥19,938 2.85x | ¥14,736 2.11x | ¥13,706 1.96x |
| Fukuyama (Hiroshima) | 680,000 | ¥6,783 N=36 | ¥6,313 N=29 | ¥20,241 2.98x | ¥14,921 2.20x | ¥13,865 2.04x |
| Oita | 754,000 | ¥6,919 N=43 | ¥6,463 N=33 | ¥21,105 3.05x | ¥15,449 2.23x | ¥14,318 2.07x |
| Kagoshima | 936,000 | ¥6,714 N=73 | ¥6,426 N=58 | ¥23,230 3.46x | ¥16,748 2.49x | ¥15,431 2.30x |
| Naha (Okinawa) | 2,260,000 | ¥10,201 N=139 | ¥9,449 N=105 | ¥38,688 3.79x | ¥26,194 2.57x | ¥23,528 2.31x |
| Himeji (Hyogo) | 1,660,000 | ¥7,058 N=40 | ¥6,408 N=24 | ¥31,683 4.49x | ¥21,913 3.10x | ¥19,859 2.81x |
Source: MetroEngines Research & Consulting (market median ADR and business-hotel median are 12-month averages from September 2025 to August 2026; for Himeji, one month with extremely few target properties is excluded) / MLIT National Land Numerical Information (Official Land Price Publication, 2026)
Segment Fit — Can a Small Building Sit in the Upper Band of Existing Small Hotels?
If the required ADR exceeds the market median, the next question is whether small hotels actually selling at that price exist. Of the business and city hotels in the 39 cities, we lined up the 1,395 properties (166,832 rooms in total) with an estimated achieved ADR by room count.
Source: MetroEngines Research & Consulting (39 cities; business/city hotels N=1,395 properties; 12-month average from September 2025 to August 2026)
| Segment / size | Properties | Bottom 25% | Median | Top 25% | Top 10% | Basis |
|---|---|---|---|---|---|---|
| Business hotels, ≤59 rooms | N=373 | ¥4,991 | ¥6,300 | ¥7,925 | ¥12,027 | Estimated achieved ADR |
| Business hotels, ≥60 rooms | N=818 | ¥6,636 | ¥7,859 | ¥9,698 | ¥12,866 | Estimated achieved ADR |
| City hotels, ≤59 rooms | N=39 | ¥8,228 | ¥10,932 | ¥16,243 | ¥28,397 | Estimated achieved ADR |
| City hotels, ≥60 rooms | N=165 | ¥8,150 | ¥10,899 | ¥14,585 | ¥19,966 | Estimated achieved ADR |
| Hostels & guesthouses (reference) | N=442 | ¥11,212 | ¥15,506 | ¥23,698 | ¥33,679 | Listed price (2 guests/room, tax incl.) |
| Business hotels, ≤59 rooms (reference) | N=360 | ¥10,021 | ¥12,107 | ¥15,324 | ¥22,156 | Listed price (2 guests/room, tax incl.) |
Source: MetroEngines Research & Consulting (hostels and guesthouses are shown at listed prices for reference because their adjustment factors are unvalidated; they are not compared with estimated achieved ADR)
Business hotels with 59 rooms or fewer (N=373) have a median of ¥6,300, and even the top 25% reach only ¥7,900. Model S’s required ADR (¥16,700 at the median land price) is far above this band and out of reach even for the top 10% (¥12,000). By contrast, city hotels with 59 rooms or fewer (N=39) show a median of ¥10,900, a top 25% of ¥16,200 and a top 10% of ¥28,400 — a price band a notch higher for the same small building size. The top quarter of small hotels differentiated by design or food and beverage sits right at Model S’s required ADR.
In fact, of the 412 existing properties with 59 rooms or fewer across the cities, only 19 (4.6%) exceed their own city’s Model S required ADR; the figures are 39 (9.5%) for Model M and 46 (11.2%) for Model L. What these numbers mean is that making a small building work requires a product that ranks in roughly the top 5% of the market.
Real small hotels converted from bank buildings show exactly how to build that upper band. K5 in Kabutocho, Nihonbashi, Tokyo opened in 2020 after renovating the former Daiichi Bank annex completed in 1923. It has 20 rooms on floors 2–4, with a restaurant, café, bar and beer hall on the ground floor and basement — a configuration that earns revenue from non-room floor space through food and beverage. HakoBA Hakodate by THE SHARE HOTELS (opened May 2017) renovated the former Yasuda Bank Hakodate branch completed in 1932 (about 760㎡) together with an adjacent former art museum, securing 58 rooms in 1,995.03㎡ of GFA. At about 34㎡ of GFA per room, combining it with the neighboring building to gain scale removed the per-room burden of a small building.
Hostels and guesthouses are not used in the assessment because their estimated achieved ADR adjustment has not yet been validated, but at listed prices their 39-city median is ¥15,500, above the listed-price median for business hotels with 59 rooms or fewer (¥12,100). Segments that build revenue per room through dormitory and group rooms suit small buildings where room counts are hard to increase. Segments that sell monthly stays, such as serviced apartments, can also offer larger rooms, making it easy to turn the ground-floor banking hall into a shared kitchen or lounge.
Conditions for a Small Building — Five Levers That Move the Required ADR
The chart below shows the results of changing one assumption at a time, using Model S (39-city median land price) as the baseline.
Source: MetroEngines Research & Consulting (the reference rebuild assumes a new 3,000㎡, 84-room building at 600% FAR on the same 500㎡ site, at a new-build unit cost of ¥2.24M/tsubo including demolition)
| Renovation cost (% of new-build) | S: GOP 28% | S: GOP 35% | S: GOP 40% | M: GOP 28% | M: GOP 35% | M: GOP 40% |
|---|---|---|---|---|---|---|
| 40% (¥0.896M/tsubo) | ¥16,736 | ¥13,389 | ¥11,715 | ¥12,573 | ¥10,058 | ¥8,801 |
| 60% (¥1.344M/tsubo, base) | ¥20,880 | ¥16,704 | ¥14,616 | ¥15,949 | ¥12,759 | ¥11,164 |
| 80% (¥1.792M/tsubo) | ¥25,024 | ¥20,019 | ¥17,517 | ¥19,326 | ¥15,460 | ¥13,528 |
Source: MetroEngines Research & Consulting (39-city median land price of ¥377,000/㎡; assumed 80% year-round OCC and 5.0% target NOI yield)
The first lever is room size. Shrinking rooms from 18㎡ to 15㎡ increases Model S to 26 rooms and lowers the required ADR to about ¥14,200. The second is renovation specification: limiting work mainly to building services while reusing the structure and facade, and holding renovation cost to 40% of new-build, brings it to about ¥13,400. Combining both gives about ¥11,400, and under the same assumptions Model M falls to about ¥8,700 and Model L to about ¥8,000. For Models M and L, that is just short of the top 25% of business hotels (¥9,700 for 60 rooms or more).
The third lever is labor cost, and it works in the opposite direction. Minimum staffing for 24-hour reception and housekeeping does not shrink in proportion to room count, so GOP ratios tend to be lower in small buildings. Setting the GOP ratio at 28% raises Model S’s required ADR to about ¥20,900. How far this fixed cost can be turned into a variable one — through ICT-based front-desk substitution permitted under the amended Hotel Business Act, or by outsourcing housekeeping and linen — has a major impact on a small building’s profitability.
The fourth lever is how the ground floor is used. Our simulation conservatively assumes recovery from room revenue alone, but as K5 shows, dedicating the ground floor and basement to food and beverage generates income from floor space that cannot become rooms. Given that bank branches have historically been converted to convenience stores and restaurants, a mixed scheme — leasing the ground floor to a street-level tenant and making the upper floors a hotel — can exploit the location’s strengths directly. The fifth lever is scale: if the project can be planned together with an adjacent lot or building, as HakoBA was, GFA per room can be brought back to a standard level.
For reference, a rebuild that uses the full 600% FAR on the same 500㎡ site (3,000㎡ GFA, 84 rooms) needs a required ADR of about ¥14,600 — lower than the Model S conversion (¥16,700). Bank branches often use only about 60% of their permitted floor area, and the land price includes the value of that unused capacity. Conversion keeps construction time and initial investment down, but it means paying for the land without using that headroom. A rebuild carries different risks — a longer construction period and greater exposure to rising construction costs — so which is more advantageous must be judged case by case based on land price, FAR and the construction timeline. The effect of demolition costs on the rebuild side, and of FAR reductions for existing non-conforming buildings, on per-room cost is covered in a separate analysis of hotel rebuild demolition costs.
Summary — Build Small Station-Front Boxes at “2,000㎡ or More” or in the “Upper Band”
Staffed bank branches fell by an average of 416 a year in 2018–2022, and regional banks closed 169 physical branches in FY2023. Because signboards remain in the form of branch-in-branch arrangements, more buildings are vacant than the statistics suggest. Branch buildings at official land price points are two-storey in 60% of cases, sit on lots more than twice the commercial average, and use only about 60% of their permitted floor area. Low, small boxes appearing on prime station-front land — that is what the floor space released by this consolidation looks like.
Converted to a hotel, such a box yields 22 rooms at 1,000㎡ GFA, with 45.5㎡ of GFA per room — about 30% heavier than standard. The required ADR back-calculated across the 39 cities is 1.13–4.49x the market median (median 1.99x), out of reach at business-hotel price levels. There are three paths to viability. The first is securing a scale of 2,000㎡ or more (the median multiple falls to 1.54x). The second is creating a product that ranks in the top 25% of small city hotels (¥16,200). The third is tightening room size and renovation specification while earning income from the ground floor through food and beverage or street-level tenants. For regional banks and shinkin banks involved in station-front revitalization, and for companies holding idle real estate, assembling scale with adjacent lots, or offering the property with ground-floor income built in, is more likely to attract hotel buyers than selling the building on its own.
Methodology and Notes
The 39 target cities are prefectural capitals and regional core cities, excluding ordinance-designated cities, that have a commercial benchmark point within 500m of a station (Kochi was excluded for lacking such a point). For land prices, from the commercial points in National Land Numerical Information (Official Land Price Publication as of January 1, 2026), the highest-priced point within 500m of the nearest station was taken as “station-front commercial land.” This includes points whose nearest stop is a tram stop or station in the city center. Market median ADR is the 12-month average from September 2025 to August 2026 of each city’s monthly median estimated achieved ADR, weighted by the number of target properties; months in which the number of target properties fell below 60% of the series median were excluded. The distribution by size and segment uses the average for properties with at least six months of estimated achieved ADR in the same period.
Required ADR is a theoretical value for comparing differences in location and scale, not a business-plan figure for any actual property or project. Building residual value, renovation cost ratio, FF&E and pre-opening costs, OCC, GOP ratio and target yield are all modeling assumptions. Bank branches are often acquired through private negotiated transactions, and actual acquisition prices do not match official land prices. If the land is leased rather than purchased, or the ground floor is leased out, the required ADR will be lower. The “current use” field in the Official Land Price Publication refers to building use at the time of appraisal, and the tally of bank points does not distinguish between operating and closed branches.
Related Articles
- Department Store Sites: 6 of 14 Go Hotel, ADR Needs 1.4-3.1x Market
- Old Malls and Warehouses as Next Hotel Rooms: Conversion Investment Boundaries
- 226k Hotel Rooms in 32 Regional Cities: 42.7% Built Before 1996
References and Sources
■ Data Sources
Estimated achieved ADR is tallied by MetroEngines Research & Consulting (39 cities, September 2025 – August 2026; market medians cover 2,067 properties in total; the size/segment distribution covers 1,395 business and city hotels). Land prices and building conditions are from MLIT National Land Numerical Information (Official Land Price Publication, 2026; 6,509 commercial points, 119 including banks); building size is from the Statistics on Building Construction Starts (finance & insurance use, 2011–2024, 7,950 buildings).
■ Modeling Assumptions
Three models S, M and L (1,000 / 2,000 / 3,000㎡ GFA; 22 / 54 / 84 rooms; 18㎡ rooms). Land = highest-priced official commercial land price within 500m of each city’s station × site area; building = residual value of ¥60,000/㎡ for buildings over 30 years old; acquisition expenses 5%; renovation ¥1.344M/tsubo (60% of new-build) + 10% contingency; FF&E and pre-opening ¥1.5M per room + ¥10M. 80% year-round OCC, 35% GOP ratio and 5.0% target NOI yield are all modeling assumptions, under the conservative premise of recovery from room revenue alone.
■ Limitations
Required ADR is a theoretical value for comparing location and scale, not a business-plan figure for an actual property. Bank branches are often acquired through private negotiated transactions, and actual acquisition prices do not match official land prices. Renovation cost uses a fixed reference unit price and does not factor in construction cost inflation during the works. Estimated achieved ADR is estimated from published OTA prices (median error of about 7% against REIT-disclosed results). The current-use field in the Official Land Price Publication does not distinguish operating from closed branches.
■ Market Data
- MetroEngines Research & Consulting — Estimated achieved ADR (39 cities; 2,067 properties for market medians; 1,395 business and city hotels)
■ Government Statistics and Public Data
- MLIT National Land Numerical Information, “Official Land Price Data (2026)”
- MLIT, “Statistics on Building Construction Starts” (e-Stat, table ID 0003114490, by use and owner)
- Ministry of Health, Labour and Welfare, “2017 Amendment of the Hotel Business Act” (on front-desk installation)
- Sendai City, “To Lodging Operators (Barrier-Free Act amendment: number of wheelchair-accessible rooms)”
■ Research and Industry Sources
- Toshihiro Sugiyama, “Changes in the Number of Staffed Domestic Bank Branches over 150 Years: 1873–2022,” Bulletin of Edogawa University, No. 34 (March 2024) (Japanese)
- Mayuko Ando and Yoko Sone, “A Study on the Change of Use of Banks,” Nihon University College of Industrial Technology academic lecture (Japanese)
- Yoko Sone and Mayuko Ando, “A Study on the Change of Use of Bank Buildings,” AIJ Journal of Technology and Design, Vol. 15, No. 31 (October 2009) (Japanese)
- Japan Center for Economic Research, “Regional banks’ branch count 10% lower than published figures” (December 23, 2021) (Japanese)
- Nikkin ONLINE, “Regional banks continue consolidating branches: 169 fewer in FY2023” (Japanese)
■ Case Studies (Official Information)