

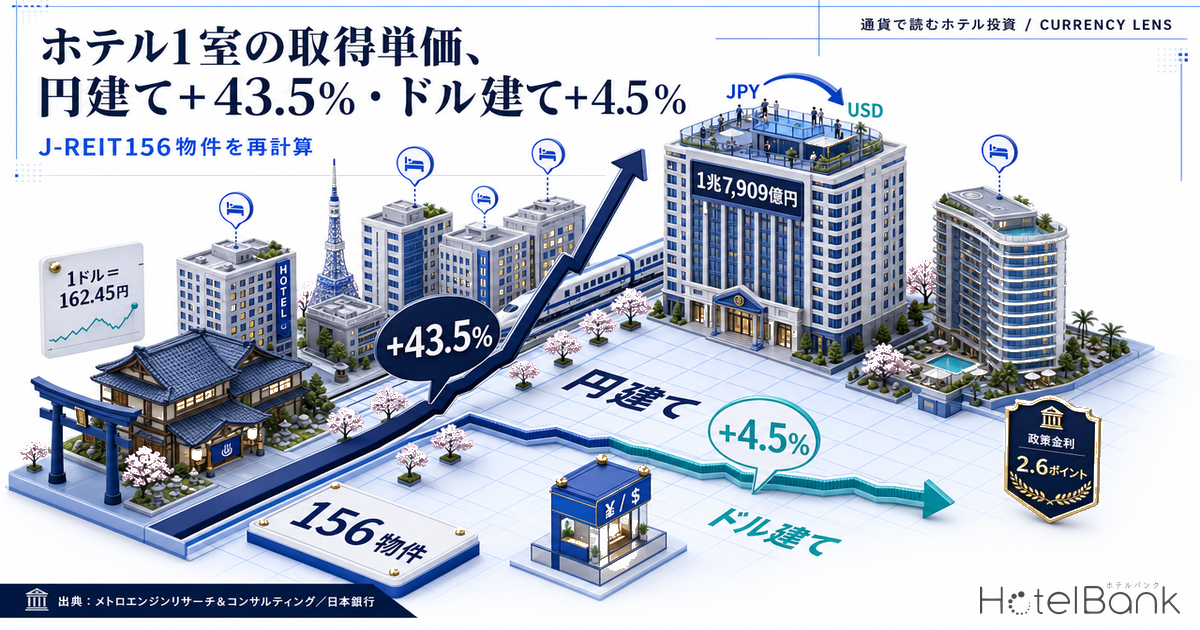
Japanese hotel assets have clearly appreciated over the past decade. Add up the acquisition prices of the 287 properties and 51,636 rooms held by six listed hotel REITs and you get ¥1.7909 trillion, or ¥34.68M per room. Restate the same figures in dollars, however, and the picture looks entirely different. This article is an attempt to recalculate Japanese hotel investment with currency, rather than region or individual REIT, as the subject.
First, how this piece differs from earlier coverage. HotelBank has previously compared per-room acquisition prices across seven REITs in yen, mapped where foreign capital chooses to invest in Japan geographically, and contrasted listed share prices with the underlying physical assets. This article takes a different axis from all of them. We convert the same acquisition-price data into dollars at the exchange rate of the month each property was acquired, building a time series separate from the yen one. We do not deal with geography, nor with the comparison against equities. The only subject is currency.
- — The acquisition price of the 287 properties and 51,636 rooms held by six listed hotel REITs, ¥1.7909 trillion, is about $11.0bn at the current rate (¥162.45 per dollar). At the acquisition-weighted average rate for 2014–2019 (¥110.4), it would have been worth about $16.2bn.
- — Tracking the acquisition price per room across the 156 properties of three REITs whose acquisition dates are individually consistent, 2023–2025 compares with 2014–2019 at +43.5% in yen and +4.5% in dollars. Most of the yen-denominated increase is offset on the currency side.
- — The Japan–US interest rate gap of 2.6 points (as of September 2026) lifts a 5.0% yen NOI yield to about 7.7% once hedged into dollars. The hedge works as carry income, not as a cost.
- — Unhedged, with a 5-year hold and entry at ¥162.45, the dollar value of the principal swings by +30.0% on an exit at ¥125 and −18.8% at ¥200, even if the yen price does not move at all.
- — The median share of foreign-language reviews across 213 REIT-owned hotels is 25.0%. The numerator of NOI is also partly linked to foreign currency, so properties with a high inbound share carry a partial natural hedge against exchange rates.
Metric Definitions Used in This Article
- Acquisition price: the property-level acquisition price (¥ million) disclosed by each REIT, used exactly as recorded in our REIT ownership master (snapshot of August 31, 2026).
- Acquisition price per room: total acquisition price divided by total rooms. Properties with no room count recorded are excluded.
- Dollar conversion: each property’s yen price divided by the Tokyo-market USD/JPY spot rate (17:00, monthly average; Bank of Japan, “Foreign Exchange Rates (Tokyo interbank market)”) for its acquisition month. Annual and period aggregates are summed after converting property by property, so the average rate implied by the aggregates is an acquisition-weighted implicit rate.
- ADR (average daily rate): an estimated settled rate (tax-exclusive equivalent) calculated by applying a segment-specific adjustment factor to the lowest-plan price level each property publishes on OTAs (per room, 2 guests, tax-inclusive). Checked against property-level results disclosed by listed hotel REITs (91 properties, most recent 3 months), the median error is about 7%. It is an estimate and differs from each property’s actual transaction prices and accounting figures. Area-level ADR is the median of the properties covered (the level of a typical property in the area). The settled ADR disclosed by REITs is shown excluding consumption tax, and the estimated settled ADR in this article is likewise a tax-exclusive equivalent.
- Data sources: MetroEngines Research & Consulting (REIT ownership master, estimated settled ADR), Bank of Japan (exchange rates), monthly disclosures of each REIT.
What is ¥1.7909 trillion of assets worth in dollars?
Start with the big picture. Our REIT ownership master (snapshot of August 31, 2026) records 302 domestic and overseas properties held by listed hotel REITs. Of these, we aggregated the 287 properties of six REITs whose acquisition prices and room counts are recorded consistently. The 15 properties of Kasumigaseki Hotel REIT Investment Corporation are excluded from this article’s aggregates because of a known inconsistency in the master, where the acquisition-price and room-count columns are stored out of alignment (this does not mean the REIT “does not own” them).
| REIT | Properties | Total acquisition price | Rooms | Per room (¥) | Per room (at current rate) |
|---|---|---|---|---|---|
| Japan Hotel REIT Investment Corporation (ジャパン・ホテル・リート投資法人) | 53 | ¥655,708M | 15,338 | ¥42,750,554 | $263,161 |
| Invincible Investment Corporation (インヴィンシブル投資法人) | 112 | ¥639,037M | 19,285 | ¥33,136,479 | $203,980 |
| Hoshino Resorts REIT (星野リゾート・リート投資法人) | 71 | ¥233,906M | 8,667 | ¥26,988,116 | $166,132 |
| MORI TRUST REIT (森トラストリート投資法人) | 6 | ¥142,217M | 1,937 | ¥73,421,270 | $451,962 |
| Ichigo Hotel REIT Investment Corporation (いちごホテルリート投資法人) | 29 | ¥71,903M | 4,418 | ¥16,275,011 | $100,185 |
| Nippon Hotel & Residential Investment Corporation (日本ホテル&レジデンシャル投資法人) | 16 | ¥48,083M | 1,991 | ¥24,150,176 | $148,662 |
| Total (6 REITs) | 287 | ¥1,790,854M | 51,636 | ¥34,682,276 | $213,495 |
Source: MetroEngines Research & Consulting (REIT ownership master, N=287 properties, snapshot of August 31, 2026) / Bank of Japan, “Foreign Exchange Rates (Tokyo interbank market)”. Current-rate conversion uses the July 2026 monthly average of ¥162.45 per dollar.
Divide ¥1.7909 trillion by the July 2026 monthly average rate and you get about $11.0bn. Divide the same yen book by the 2014–2019 acquisition-weighted average rate (¥110.4 per dollar) and it was about $16.2bn. The yen acquisition prices have not moved by a single yen, yet the asset base counted in dollars has shrunk by nearly a third. This is neither a loss nor a gain in value; the measuring stick has simply changed. For overseas investors buying Japanese hotels, though, this is the measuring stick they use every day.
Yen +43.5%, dollar +4.5%: a decade of acquisition prices per room in two currencies
Now to the main question. The exchange rate depends on when a property was bought. So we need to apply the monthly average rate for each property’s acquisition month and build up the dollar acquisition amounts at those points in time.
This exercise has a precondition, however. The accuracy of the acquisition-date field in our master varies by REIT. Records for Japan Hotel REIT and MORI TRUST REIT sometimes hold the construction date, and for Hoshino Resorts REIT some rows record the initial portfolio in bulk at the listing date (July 2013), so none of them can be used to apply the exchange rate of the acquisition month. The annual time series is therefore limited to the three REITs whose acquisition dates are individually consistent — Invincible Investment Corporation, Ichigo Hotel REIT Investment Corporation and Nippon Hotel & Residential Investment Corporation — covering 156 properties (25,694 rooms, total acquisition price ¥728.9bn). The six-REIT total above is used only for point-in-time balance comparisons that do not depend on acquisition timing.
Source: compiled from MetroEngines Research & Consulting (REIT ownership master, N=156 properties / 3 REITs, snapshot of August 31, 2026) / Bank of Japan, “Foreign Exchange Rates (Tokyo interbank market)”. The three REITs made no acquisitions in 2021.
The bars (yen) and the line (dollars) have almost the same shape through 2019, because the rate was stable at around ¥110 per dollar. The divergence begins in 2023. Acquisitions in 2024 recovered to ¥110.1bn in yen, close to the 2016 level (¥123.3bn), but in dollars they came to only $698.8M, about 60% of 2016’s $1,134.4M. What looks like an “acquisition rush” in yen looks like a mid-sized year in dollars.
The more fundamental gap appears when you look per room.
Source: compiled from MetroEngines Research & Consulting (REIT ownership master, N=156 properties / 3 REITs) / Bank of Japan, “Foreign Exchange Rates (Tokyo interbank market)”. Annual levels are also affected by the segment mix of the assets acquired.
Because annual levels move up and down with what was bought (whether a year was heavy on limited-service or full-service hotels), grouping the years into three periods makes the structure easier to see.
| Period | Properties | Acquisitions (yen) | Acquisitions (USD) | Per room (¥) | Per room ($) | Implicit rate |
|---|---|---|---|---|---|---|
| 2014–2019 | 106 | ¥460,399M | $4,169M | ¥26,043,614 | $235,821 | 110.4 |
| 2020–2022 | 6 | ¥23,886M | $213M | ¥16,237,933 | $144,610 | 112.3 |
| 2023–2025 | 44 | ¥244,677M | $1,613M | ¥37,383,804 | $246,483 | 151.7 |
| 2023-25 ÷ 2014-19 | — | — | — | +43.5% | +4.5% | +37.4% |
Source: compiled from MetroEngines Research & Consulting (REIT ownership master, N=156 properties / 3 REITs) / Bank of Japan, “Foreign Exchange Rates (Tokyo interbank market)”. The implicit rate is the acquisition-weighted average.
This is the central finding of the article. In yen, the acquisition price per room rose +43.5%, from an average of ¥26.04M in 2014–2019 to an average of ¥37.38M in 2023–2025. Count the same transactions in dollars, however, and it moved only +4.5%, from $235,821 to $246,483. Most of the yen increase in acquisition price per room can be explained not by rising asset prices but by the change in the currency.
To avoid misunderstanding: this is not a story of Japanese hotels “being sold off cheaply”. For domestic investors who raise capital in yen and distribute in yen, the yen figure of +43.5% is the reality. Likewise, for investors who raise capital in dollars and are accountable in dollars, +4.5% is the reality. Neither is right; the view differs depending on which currency you stand in. This duality is the key to understanding Japanese hotel transactions since 2023.
One more angle. The ¥728.9bn these three REITs actually paid came to $5,994.8M at the rates prevailing when they acquired. Paying the same ¥728.9bn at the July 2026 level (¥162.45 per dollar) would cost just $4,487.3M. Measured by dollar cost, the same purchase has become 25.1% cheaper. There is no need to explain the stronger interest of overseas capital in Japanese hotels since 2023 solely by supply and demand or growth expectations. A change in the denominator alone moves how prices look this much.
A 2.6pt rate gap: why the hedge becomes income, not a cost
When currency is connected to investment returns, most of the discussion focuses on the direction of the exchange rate (whether the yen will weaken or strengthen). In institutional practice, however, before trying to call the direction, investors check what happens when they hedge. Here lies an issue specific to Japanese hotel investment that is rarely discussed.
As of September 2026, the Bank of Japan’s policy rate, the uncollateralized overnight call rate, stands at “around 1.0%” (raised from around 0.75% at the monetary policy meeting of June 16, 2026), and the US Federal Open Market Committee (FOMC) target range for the federal funds rate is 3.50–3.75% (held at the July 2026 meeting). The short-term rate gap is roughly 2.6 points.
Under covered interest rate parity, this rate gap is reflected in the forward points. When yen rates are lower than dollar rates, the yen trades at a premium to spot in the forward market. Investors who hold yen assets and hedge them into dollars therefore stand on the side that receives carry equivalent to the rate gap. The hedge becomes income rather than a cost. Conversely, a yen-based investor who buys dollar assets and hedges them pays the same rate gap. This is not a matter of good or bad, only of direction.
We show this effect as a sensitivity on unlevered NOI yields.
| Assumed NOI yield (yen) | Rate gap 1.0pt | Rate gap 2.0pt | Rate gap 2.6pt (as of Sep 2026) | Rate gap 3.0pt |
|---|---|---|---|---|
| 4.5% | 5.54% | 6.59% | 7.22% | 7.63% |
| 5.0% | 6.05% | 7.10% | 7.73% | 8.15% |
| 5.5% | 6.55% | 7.61% | 8.24% | 8.66% |
Approximate real yield when a dollar-based investor hedges a yen asset into dollars. Calculated as (1 + NOI yield) × (1 + rate gap) − 1. A simplified estimate that ignores the currency basis, hedge roll costs, funding spreads and tax factors; actual investment decisions require detailed case-by-case analysis. Policy rates are the published figures of the Bank of Japan and the FOMC.
Source: prepared by MetroEngines Research & Consulting from the published policy rates of the Bank of Japan and the US Federal Reserve Board (rough estimate).
A 5.0% NOI yield in yen becomes about 7.7% when hedged into dollars. Judge Japanese hotels as “thin” on yen yields alone and you miss these 2.6 points. Conversely, if the rate gap narrows to 1.0 point, the hedged yield on the same property falls to 6.05%. Further BOJ rate hikes or US rate cuts could move the yield seen by overseas investors by 1.7 points without touching Japanese hotel prices directly. This is a change that happens on an entirely different plane from how a property’s NOI is improved.
Unhedged: how much does the dollar value of the principal move?
In cross-border real estate, holding periods are long at 5–10 years and NOI fluctuates during the hold, so many investors do not mechanically hedge the full amount. In that case, the exchange rate acts directly on the dollar value of the principal. The sensitivity with a 5-year hold and entry at ¥162.45 per dollar is as follows.
| USD/JPY at exit | Yen position | Change in principal (USD) | Annualized (5 years) |
|---|---|---|---|
| ¥125 | Sharp yen appreciation | +30.0% | +5.38% |
| ¥135 | Yen appreciation | +20.3% | +3.77% |
| ¥145 | Slight yen appreciation | +12.0% | +2.30% |
| ¥162.45 | Flat (baseline) | 0.0% | 0.00% |
| ¥180 | Yen depreciation | −9.8% | −2.03% |
| ¥195 | Sharp yen depreciation | −16.7% | −3.59% |
A simplified estimate assuming the yen asset value is unchanged. The entry rate is the July 2026 monthly average from the Bank of Japan’s “Foreign Exchange Rates (Tokyo interbank market)”. Actual returns vary widely with NOI growth, cap rate changes and leverage structure.
An annualized 2–4% is equivalent in scale to a 0.3–0.5 point move in the cap rate. It is as wide as, or wider than, the value-add that can be built up through property selection or a change of operator. Whether to hedge is nothing other than a choice of which of these two tables to put on your own income statement.
Not only the denominator of NOI but the numerator moves with currency: room rates in two currencies
So far we have dealt with asset prices, i.e. the balance sheet. But the currency lens can also be applied to the income statement. Lay out the monthly room rates disclosed by REITs in two currencies and the same shape appears as with asset prices.
| Subject | Jul 2025 | Jul 2026 | YoY (yen) | YoY (USD) |
|---|---|---|---|---|
| Invincible Investment Corporation ADR (101 domestic hotels) | ¥15,257 / $103.9 | ¥15,100 / $93.0 | −1.0% | −10.5% |
| Japan Hotel REIT Investment Corporation ADR (29 hotels with variable rent, etc.) | ¥21,784 / $148.3 | ¥21,806 / $134.2 | +0.1% | −9.5% |
| Tokyo estimated settled ADR (Jan–Jul average) | ¥13,929 / $94.2 | ¥14,375 / $90.6 | +3.2% | −3.8% |
Source: monthly operating disclosures of Invincible Investment Corporation and Japan Hotel REIT Investment Corporation (yen YoY figures are as published by each company) / estimated settled ADR for Tokyo from MetroEngines Research & Consulting (N=1,125–1,151 properties per month). Dollar figures converted at the monthly average of the Bank of Japan’s “Foreign Exchange Rates (Tokyo interbank market)”. Single-month ADRs for the two REITs use the July monthly average of each year (July 2025 = ¥146.85, July 2026 = ¥162.45); Tokyo’s January–July average ADR uses the average rate for the same period (2025 = about ¥147.9, 2026 = about ¥158.7). Japan Hotel REIT’s July 2025 ADR is a reference value back-calculated from its published YoY change.
Flat to slightly positive in yen, down nearly 10% in dollars. Same rooms, same occupancy, same nights — change the currency and the sign flips. The phenomenon seen in our earlier analysis tracking area room rates as a dollar index (Japan Hotels 7.9% Cheaper in USD Than 2019) is confirmed on a REIT-disclosure basis as well.
One step further, an issue important for investors emerges. Even though Japanese hotels book NOI in yen, a substantial part of what funds it comes from households in foreign-currency economies. Among the REIT-owned hotels in our ownership master, we aggregated the share of foreign-language reviews for the 213 properties with 100 or more reviews: the median was 25.0% and the mean 28.6%.
Source: HotelBank Editorial Team research (213 REIT-owned hotels with 100 or more reviews; share of foreign-language reviews used as a proxy). It does not match the actual share of foreign guests.
56 properties, or 26.3%, have a foreign-language review share of 40% or more. The NOI of these properties is booked in yen but in substance depends on their ability to earn in foreign currency. According to the Japan Tourism Agency’s “Inbound Consumption Trend Survey” for April–June 2026 (first preliminary estimate), inbound visitor consumption was ¥2.5096 trillion, +0.2% year on year, and spending per visitor was ¥244,000, +3.3%. By market, the United States took first place at 15.3% (¥384.8bn), overtaking China. The structure in which the “dollar lodging budget” paid by customers in the dollar bloc is converted into yen and shapes room rates is stronger than ever.
Restated from a risk-management perspective, the structure looks like this. A weak yen pushes down the dollar acquisition cost and the dollar value of principal, while also working to push NOI up through Japan’s relative cheapness for customers in foreign-currency economies. Because the two act in opposite directions, properties with a high inbound share can be interpreted as carrying a partial natural hedge against exchange rates. How strongly that natural hedge works, however, varies widely from property to property and cannot be handled with a single coefficient. To measure a portfolio’s FX exposure, you need to look not only at the currency of the acquisition price but at the customer mix behind NOI — that is the practical implication of this article.
Where to stand on currency: summary
To recap what this article established. First, the ¥1.7909 trillion acquisition price of the 287 properties and 51,636 rooms held by six listed hotel REITs is worth about $11.0bn at the current rate and about $16.2bn at the 2014–2019 average rate. Second, tracking acquisition price per room across the 156 properties of three REITs whose acquisition dates are individually consistent, 2023–2025 compared with 2014–2019 at +43.5% in yen and +4.5% in dollars. Third, a Japan–US rate gap of 2.6 points lifts a 5.0% yen NOI yield to about 7.7% once hedged into dollars. Fourth, the median share of foreign-language reviews across 213 REIT-owned hotels is 25.0%, so NOI itself is partly linked to foreign currency.
None of this is about whether a weak yen is “good” or “bad”. To investors who raise capital and distribute in yen, and to investors who raise capital and are accountable in dollars, the same property looks like a different price and a different yield. Many of the transactions seen in the Japanese hotel market in recent years are struck within the gap between these two lenses. Debating whether a price is fair without knowing which currency the counterparty stands in leads nowhere. That is the conclusion of this article.
The variables from here are clear. If the rate gap narrows, the overseas investor’s advantage in hedged yield erodes. Conversely, if the yen recovers, the dollar cost of acquisitions rises, but the dollar value of the principal already held improves. In either scenario, only the inputs to investment decisions change, while yen acquisition prices and NOI stay exactly where they are. Together with quarterly J-REIT acquisition trends and the regulatory environment around foreign acquisitions of hotels, the currency axis is worth tracking at fixed intervals.
Data Handling and Limitations
- The ownership master is a snapshot of August 31, 2026 with 302 records (of which 287 properties of six REITs are aggregated in this article, and 156 properties of three REITs in the time-series analysis). It covers only the seven listed hotel-focused REITs, so the absence of a record is not proof of non-ownership.
- The 15 properties of Kasumigaseki Hotel REIT Investment Corporation are excluded from all aggregates in this article because of a known inconsistency in the master, where the acquisition-price and room-count columns are stored out of alignment.
- The acquisition-date fields of Japan Hotel REIT Investment Corporation and MORI TRUST REIT include records holding the construction date, and Hoshino Resorts REIT has rows recorded in bulk at the listing date, so they are excluded from the annual acquisition time series and used only for point-in-time balance comparisons.
- Dollar conversion uses the Tokyo-market USD/JPY spot rate (17:00, monthly average; data code FM08’FXERM07) from the Bank of Japan’s “Foreign Exchange Rates (Tokyo interbank market)”. The series runs through July 2026. The monthly average for each acquisition month is applied on an acquisition-date basis.
- Hedged yields and exchange-rate sensitivities are all rough estimates that ignore the currency basis, roll costs, funding spreads, tax factors, leverage and NOI fluctuations. Actual investment decisions require detailed case-by-case analysis.
- The share of foreign-language reviews is a proxy based on the language in which reviews were posted, not the actual nationality mix of guests.
Related Articles
- Japan Hotels 7.9% Cheaper in USD Than 2019 — But +38.3% in Yen
- Hotel Capital Allocation 2026: One Deal Took 27% of J-REIT Q1 Buying
- Hotel Acquisition Costs 7.1%: A 6.5% Gross Yield Becomes 4.65% Net
- Lodging Is 37% of Japan’s ¥2.51T Inbound Spend: ¥10,446 vs Real ADR
- Policy Rate 1.00%: Break-Even ADR Across Japan’s 8 Hotel Markets
References and Sources
■ Data sources
Property-level acquisition prices, room counts and acquisition dates from our REIT ownership master (snapshot of August 31, 2026; 302 records; seven listed hotel-focused REITs); the Tokyo-market USD/JPY spot rate (17:00, monthly average; series through July 2026) from the Bank of Japan’s “Foreign Exchange Rates (Tokyo interbank market)”; monthly operating and portfolio disclosures of each REIT; and our estimated settled ADR and foreign-language review share (213 REIT-owned properties). The balance comparison uses the 287 properties of six REITs (N=287) as its population, and the annual time series the 156 properties of three REITs with individually consistent acquisition dates (N=156, 25,694 rooms).
■ Calculation assumptions
Dollar conversion divides each yen price by the monthly average rate for its acquisition month, and period totals are summed after converting property by property (the average rate implied by the totals is an acquisition-weighted implicit rate). Current-rate conversion uses the July 2026 monthly average of ¥162.45 per dollar. Hedged yields are calculated with a covered interest parity approximation that simply adds the Japan–US rate gap to the unlevered yen NOI yield. The principal’s exchange-rate sensitivity starts from a 5-year hold with entry at ¥162.45 per dollar and is a single-variable sensitivity that moves only the exit rate.
■ Limitations and caveats
Acquisition prices are book values at the time of acquisition, not current appraisal values or market values. The 15 properties of Kasumigaseki Hotel REIT Investment Corporation are excluded from all aggregates because of a known inconsistency in the master, where the acquisition-price and room-count columns are stored out of alignment (this does not mean they are not owned). The acquisition-date fields of Japan Hotel REIT Investment Corporation, MORI TRUST REIT and Hoshino Resorts REIT are not accurate enough for annual analysis, so they are used only for point-in-time balance comparisons. Hedged yields and exchange-rate sensitivities are all rough estimates that ignore the currency basis, roll costs, funding spreads, tax factors, leverage and NOI fluctuations. The share of foreign-language reviews is a proxy based on the language of posting, not the actual nationality mix of guests. Only listed hotel-focused REITs are covered, so the absence of a record is not proof of non-ownership.
■ Market data
- MetroEngines Research & Consulting — REIT ownership master (snapshot of August 31, 2026, N=302 records), estimated settled ADR
- HotelBank Editorial Team research — share of foreign-language reviews at 213 REIT-owned hotels
■ Exchange rates and monetary policy
- Bank of Japan, “Main Time-Series Statistics — Foreign Exchange Rates (Tokyo interbank market), monthly” (Tokyo-market USD/JPY spot, 17:00 / monthly average; in Japanese)
- Bank of Japan, “Change in the Guideline for Money Market Operations” (June 16, 2026; uncollateralized call rate to around 1.0%; in Japanese)
- Dai-ichi Life Research Institute, “Policy rate raised to 1.00%: the BOJ’s June 2026 monetary policy meeting” (in Japanese)
- US Federal Open Market Committee (FOMC) policy rate target range 3.50–3.75% (July 2026 meeting)
■ REIT disclosures
- Invincible Investment Corporation, “Monthly Operating Results (July 2026)”, 101 domestic hotels (in Japanese)
- Japan Hotel REIT Investment Corporation, portfolio / monthly performance disclosure (in Japanese)
- Hoshino Resorts REIT, portfolio list (in Japanese)
- Ichigo Hotel REIT Investment Corporation
■ Government statistics