

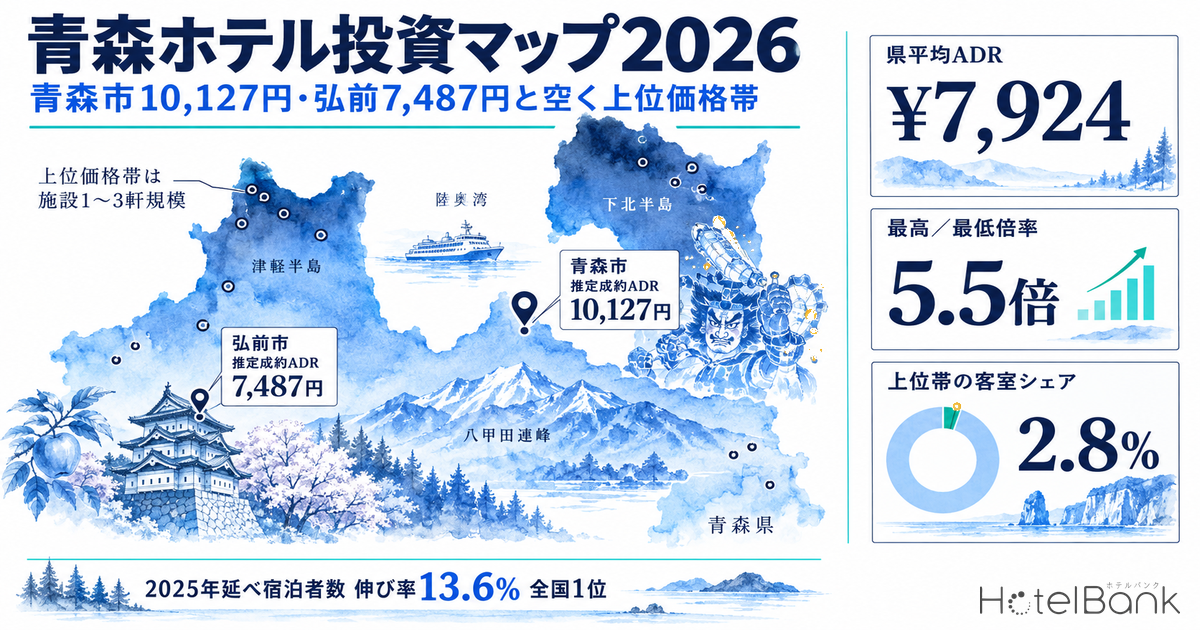
Aomori Prefecture’s lodging market recorded 5,125,880 guest nights in 2025 — the highest since the statistics began — and its 13.6% growth rate ranked first nationwide. Foreign guest nights also topped 500,000 for the first time at 522,180, reaching a level the prefecture’s tourism strategy had set as a 2028 target three years ahead of schedule. Demand is clearly growing. The question is where the rooms that absorb it are located, and at what rate.
This article overlays estimated settled ADR (average daily rate), property counts and room counts across Aomori Prefecture’s 26 municipalities to map the prefecture’s price tiers and supply volume on a single sheet. The conclusion up front: four municipalities post an estimated settled ADR above ¥12,000, but every one of them is built on just one to three properties. Conversely, the five municipalities with more than ten covered properties — Aomori City, Hachinohe, Hirosaki, Towada and Misawa — all sit at or below roughly ¥10,000. The prefecture has almost no vessel capable of capturing the upper price band at meaningful room scale.
How this differs from our earlier coverage: Aomori has not appeared in our prefecture-level investment map series to date (Toyama, Fukui, Ishikawa, Yamaguchi, Nara, Wakayama, Mie, Nagasaki, Kumamoto, Shiga, Oita, Niigata, Ehime, the four San’in cities, Ibaraki, Tochigi, Fukushima, Iwate, Yamanashi and Miyagi). What we have published on Aomori is a year-on-year rate comparison by property category and an analysis of supply-absorption speed covering new supply and sell-out signals across the three northern Tohoku prefectures. This is the first time we treat Aomori through the investment-map lens of municipal price tiers and supply volume.
Metric Definitions Used in This Article
- ADR (average daily rate) = an estimated settled rate (tax-exclusive equivalent), calculated by applying category-specific adjustment factors to the lowest published plan level each property lists on OTAs (two guests per room, per-room price, tax-included). Cross-checked against property-level results disclosed by listed hotel REITs (91 properties, most recent three months), the median error is roughly 7%. These are estimates and differ from each property’s actual transacted prices and accounting figures. Area-level ADR is the median of covered properties (the level of a typical property in the area).
- OCC (occupancy) = sold rooms as a share of total rooms in the area (an estimate based on OTA sales inventory). It reflects how fast inventory listed on OTAs is absorbed and differs from a property’s true overall occupancy.
- LT (lead time) = days remaining until check-in. LT0 = same day. The booking curves in this article use LT45 and shorter only.
- Published price, where referenced, is the per-room price for two guests per room (tax-included, averaged across all plans).
- Data source: MetroEngines Research & Consulting
- — 5.5x spread: estimated settled ADR across Aomori’s 26 municipalities runs from ¥21,262 (Kazamaura Village) down to ¥3,879 (Oirase Town), averaged over September 2025–August 2026.
- — Volume and rate never meet: the five cities with more than ten covered properties all sit at or below roughly ¥10,000, while the four municipalities above ¥12,000 are built on one to three properties.
- — 2.8% of rooms in the top band: Tier 1 (above ¥16,000) holds 602 rooms, while 45.5% of the prefecture’s rooms sit in Tier 4, below ¥8,000.
- — New supply skews low: 93% of 2026’s five openings and 363 rooms (1.7% of existing stock) land in Tier 4 Rokkasho Village and Hachinohe; lodging construction starts fell to two buildings and 41 sqm in 2024.
- — Acquisition beats building: per-room acquisition cost for the prefecture’s three J-REIT properties, ¥18.5–26.9 million, runs 20–50% below the ¥34.3 million for new construction (land excluded); at 40 rooms, ¥16,000 ADR and 65% OCC (a full-year average modelling assumption), the GOP yield is 6.6%.
Estimated settled ADR across 26 municipalities — a 5.5x spread from ¥21,262 to ¥3,879
We aggregated estimated settled ADR by municipality on a monthly basis for the twelve months from September 2025 to August 2026, then took the average. Twenty-six municipalities had enough observations to produce an estimate. Kazamaura Village at the northern tip of the Shimokita Peninsula leads at ¥21,262, followed by Ajigasawa Town at ¥17,373, Hiranai Town at ¥17,265 and Sotogahama Town at ¥16,752. The gap to bottom-ranked Oirase Town at ¥3,879 reaches 5.5x.
The prefectural capital, Aomori City, ranks ninth at ¥10,127. Hirosaki, the prefecture’s tourism city, sits 16th at ¥7,487, and Hachinohe, its largest industrial city, 19th at ¥6,839. The prefecture-wide estimated settled ADR (median basis) averaged ¥7,924 over the twelve months, up 7.1% year on year, putting the top four municipalities at more than double that level.
What must not be overlooked is how many properties each municipal ADR is calculated from. For the top four municipalities, the twelve-month average count of properties behind the estimate is 2.8, 3.0, 1.0 and 1.0 respectively. Kazamaura Village is the Shimofuro hot-spring district and Ajigasawa Town a stretch of Sea of Japan hot-spring inns — small areas where a handful of ryokan set the rate. The rate level is high, but as a vessel for deployed capital the area is small.
| Rank | Municipality | Estimated settled ADR | Covered properties | Price tier |
|---|---|---|---|---|
| 1 | Kazamaura Village | ¥21,262 | 2.8* | Tier 1 Small-scale, high-rate |
| 2 | Ajigasawa Town | ¥17,373 | 3.0* | Tier 1 Small-scale, high-rate |
| 3 | Hiranai Town | ¥17,265 | 1.0* | Tier 1 Small-scale, high-rate |
| 4 | Sotogahama Town | ¥16,752 | 1.0* | Tier 1 Small-scale, high-rate |
| 5 | Noheji Town | ¥11,717 | 1.6* | Tier 2 Hot springs and capital |
| 6 | Kuroishi City | ¥11,509 | 8.6 | Tier 2 Hot springs and capital |
| 7 | Hirakawa City | ¥10,799 | 3.6* | Tier 2 Hot springs and capital |
| 8 | Owani Town | ¥10,436 | 7.8 | Tier 2 Hot springs and capital |
| 9 | Aomori City | ¥10,127 | 38.9 | Tier 2 Hot springs and capital |
| 10 | Towada City | ¥9,765 | 16.6 | Tier 3 Mixed regional hub and tourism |
| 11 | Tsugaru City | ¥9,508 | 1.9* | Tier 3 Mixed regional hub and tourism |
| 12 | Tsuruta Town | ¥9,053 | 2.0* | Tier 3 Mixed regional hub and tourism |
| 13 | Fukaura Town | ¥9,049 | 2.0* | Tier 3 Mixed regional hub and tourism |
| 14 | Oma Town | ¥8,604 | 1.0* | Tier 3 Mixed regional hub and tourism |
| 15 | Goshogawara City | ¥8,140 | 4.5 | Tier 3 Mixed regional hub and tourism |
| 16 | Hirosaki City | ¥7,487 | 23.8 | Tier 4 Business-driven |
| 17 | Rokkasho Village | ¥7,198 | 1.9* | Tier 4 Business-driven |
| 18 | Nakadomari Town | ¥7,108 | 1.0* | Tier 4 Business-driven |
| 19 | Hachinohe City | ¥6,839 | 31.8 | Tier 4 Business-driven |
| 20 | Misawa City | ¥6,807 | 12.7 | Tier 4 Business-driven |
| 21 | Mutsu City | ¥6,768 | 9.2 | Tier 4 Business-driven |
| 22 | Nishimeya Village | ¥6,580 | 1.7* | Tier 4 Business-driven |
| 23 | Gonohe Town | ¥6,313 | 1.0* | Tier 4 Business-driven |
| 24 | Tohoku Town | ¥6,012 | 4.0 | Tier 4 Business-driven |
| 25 | Nanbu Town | ¥4,039 | 1.0* | Tier 4 Business-driven |
| 26 | Oirase Town | ¥3,879 | 1.0* | Tier 4 Business-driven |
Property count vs. ADR — the entire upper-right quadrant is empty
Plotting the 26 municipalities with covered property count on the horizontal axis and estimated settled ADR on the vertical makes Aomori’s structure visible at a glance. The points split into an upper-left cluster (few properties, high rate) and a lower-right cluster (many properties, low rate), and the upper-right quadrant — areas that combine a meaningful number of properties with an upper-band rate — is completely empty.
Five municipalities have more than ten covered properties — Aomori City (38.9), Hachinohe (31.8), Hirosaki (23.8), Towada (16.6) and Misawa (12.7) — with Mutsu (9.2) next in line. Estimated settled ADR for these six cities falls between ¥10,127 and ¥6,768, all at or below roughly ¥10,000. Meanwhile, the four municipalities above ¥12,000 are backed by 1.0 to 3.0 properties. Volume and rate simply never intersect anywhere in the prefecture.
The occupied zone
ADR ¥6,000–10,000 with more than ten properties. The business-demand band of the capital and regional hubs. Six cities account for a substantial share of the prefecture’s rooms, and price competition references peers closely.
Proven but small
ADR above ¥16,000 with one to three properties. The hot-spring districts of Shimokita and Tsugaru. The rate holds, but the rooms we track amount to just 2.8% of the prefecture total.
The empty zone
ADR ¥12,000–20,000 with five or more properties. No matches. No trade area in the prefecture builds an upper price band across multiple properties.
Aomori’s four-tier structure — 45.5% of rooms sit in areas below an estimated ¥8,000
Sorting the 26 municipalities into four tiers by estimated settled ADR makes the prefecture’s capital allocation explicit. Summing the tracked room counts of the municipalities in each tier (based on the 705 properties and 21,513 rooms we track in the prefecture) gives the following.
| Tier | ADR band | Municipalities | Covered properties | Tracked rooms | Share of prefecture rooms |
|---|---|---|---|---|---|
| Tier 1 Small-scale, high-rate | Above ¥16,000 | 4 | 7.8 | 602 | 2.8% |
| Tier 2 Hot springs and capital | ¥10,000–12,000 | 5 | 60.5 | 6,641 | 30.9% |
| Tier 3 Mixed regional hub and tourism | ¥8,000–10,000 | 6 | 28.0 | 3,267 | 15.2% |
| Tier 4 Business-driven | Below ¥8,000 | 11 | 89.1 | 9,787 | 45.5% |
Tier 4 lines up the areas with deep business demand — Hirosaki, Hachinohe, Misawa, Mutsu and Rokkasho — and accounts for 45.5% of the prefecture’s rooms. Tier 2, led by Aomori City, holds 30.9%. And Tier 1, the highest-rate tier, holds 602 rooms, just 2.8% of the total. In a prefecture posting the fastest demand growth in Japan, under 3% of rooms are allocated to the upper price band — that is where Aomori stands today.
On the map, Tier 1 (dark navy) is scattered across Kazamaura Village and Sotogahama Town on the Shimokita Peninsula and Ajigasawa Town on the Sea of Japan side of Tsugaru. All sit far from the prefectural capital in travel time and depend on a single hot-spring resource. Tier 2 (blue) runs from Aomori City as its core through the Tsugaru hot-spring towns of Kuroishi, Owani and Hirakawa. Tier 4 (gray), by contrast, is distributed across the Pacific-side industrial cluster of Hachinohe, Misawa and Rokkasho, plus Hirosaki.
Why Hirosaki prices below Aomori City — a mismatch between tourism demand and property mix
Hirosaki has some of the prefecture’s strongest tourism assets: the cherry blossoms of Hirosaki Park, the castle-town streetscape and Mount Iwaki. Guest numbers hit a record 666,150 in 2025, and on 1 December 2025 the city introduced Tohoku’s first accommodation tax (¥200 per person per night). Demand as a tourism city genuinely exists. Even so, estimated settled ADR is ¥7,487 — 26% below Aomori City’s ¥10,127.
The reason lies in the property mix. Breaking the three main cities down by property category makes the difference plain.
| City | Category | Properties | Published price (June 2026) | Published price (August 2026) |
|---|---|---|---|---|
| Aomori City | Business hotels | 23 | ¥13,400 | ¥25,700 |
| Ryokan | 9 | ¥36,700 | ¥46,200 | |
| City hotels | 4 | ¥18,400 | ¥35,000 | |
| Resort hotels | 3–4 | ¥43,700 | ¥49,900 | |
| Hirosaki City | Business hotels | 13 | ¥13,100 | ¥20,600 |
| Ryokan | 6–7 | ¥17,900 | ¥20,400 | |
| City hotels | 3 | ¥15,200 | ¥23,200 | |
| Hachinohe City | Business hotels | 24–25 | ¥12,400 | ¥18,000 |
| City hotels | 4 | ¥16,300 | ¥23,000 |
Aomori City has roughly twelve properties in the upper categories — ryokan and resort hotels — that reach published prices in the high ¥40,000s during peak season, thanks to Asamushi Onsen and the foothills of the Hakkoda mountains. Hirosaki has six to seven ryokan, but their published prices of ¥17,900 in June and ¥20,400 in August sit in virtually the same band as the city’s business hotels (¥13,100 and ¥20,600). Hirosaki holds tourism demand without owning the upper-band rooms to absorb it. That is the clearest quantified growth headroom in the prefecture: the castle town, the cherry blossoms and Mount Iwaki are all in place as differentiating assets, yet no vessel has been built to lift the rate — so whoever builds one captures the demand.
Trade-area data supports that reading. Looking at establishments and employees within a 1km radius of each main city’s central station in the Economic Census, the area around Aomori Station has 1,887 establishments and 14,220 employees with an office-sector share of 27.4%, and the area around Hon-Hachinohe Station has 1,877 establishments and 12,937 employees at 27.7%. Around Hirosaki Station, by contrast, there are 1,740 establishments and 13,990 employees but an office-sector share of only 16.7%.
| Central point | Establishments | Employees | Office-sector share | Residents within 1.5km (2025) | Change by 2040 |
|---|---|---|---|---|---|
| Aomori Station | 1,887 | 14,220 | 27.4% | 25,067 | −26.0% |
| Hirosaki Station | 1,740 | 13,990 | 16.7% | 26,016 | −22.6% |
| Hon-Hachinohe Station | 1,877 | 12,937 | 27.7% | 27,849 | −20.5% |
Aomori City and Hachinohe are business cities where office-sector employment accounts for about a quarter of the total, so weekday corporate demand supports the rate — while that same demand also caps the price band. Hirosaki has a low office-sector share and depends comparatively little on business demand. Read the other way, a larger share of Hirosaki’s lodging demand originates outside business travel — tourism, events and education — which gives it more freedom in rate design.
That said, the resident population in all three trade areas is projected to fall 20–26% by 2040. All three will need a design that assumes natural decline in domestic demand and offsets it with inbound and out-of-prefecture leisure travel. Below is the resident population distribution within a 1.5km radius of Aomori Station.
Supply — five openings and 363 rooms in 2026, with construction starts effectively blank in 2024
How is supply moving while demand grows? Within the scope MetroEngines Research tracks, Aomori Prefecture sees five openings and 363 rooms in 2026. Against the 705 properties and 21,513 rooms we track in the prefecture, that is 1.7% on a room basis. In 2025 the figures were 18 properties and 566 rooms (2.6% of existing stock).
| Opening | Property | Rooms | Category | Location |
|---|---|---|---|---|
| October 2026 | Tabino Hotel Aomori Rokkasho (たびのホテル青森六ケ所村) | 210 | Business hotel | Rokkasho Village |
| October 2026 | Richmond Hotel Hachinohe Square (リッチモンドホテル八戸スクエア) | 126 | Business hotel | Hachinohe City |
| July 2026 | Minshuku Kikuchi (民宿きくち) | 20 | Minshuku | Within the prefecture |
| May 2026 | Anzu Ryokan (あんず旅館) | 6 | Guesthouse | Within the prefecture |
| April 2026 | Yasumiya (休家) | 1 | Vacation rental | Within the prefecture |
Of the 363 new rooms in 2026, 336 — that is 93% — are concentrated in the two October openings. Rokkasho Village’s 210 rooms and Hachinohe’s 126 rooms both land in Tier 4, where estimated settled ADR sits around ¥7,000. New supply in 2026 is modest in volume relative to demand growth, yet its placement adds further depth to the existing low-rate band. The gap at the top will not be filled by this year’s openings.
To look further down the pipeline, we queried planning data from the Ministry of Land, Infrastructure, Transport and Tourism’s building dynamics survey and found no lodging projects registered in Aomori Prefecture at present. We therefore turn to the annual series of construction starts for lodging use.
Floor area started for lodging use in Aomori peaked in 2022 at 21 buildings, 23,436 sqm and ¥7.88 billion in planned construction cost, then contracted to six buildings, 7,294 sqm and ¥3.02 billion in 2023 and to two buildings, 41 sqm and ¥10 million in 2024. The 2024 figure means that essentially no new lodging facility broke ground in the prefecture that year. Since construction to opening normally takes one to two years, the pool of hotels completing in 2026–2027 is already small. Note that statistics based on building-permit applications tend to rise in both count and floor area as further applications are filed, so the current figures should be read as a floor.
Demand — 67.8% of inventory sold at LT45, with late demand lifting the rate
If supply is thin, how fast is inventory absorbed? We built a fixed cohort of properties listing at least 30% of their total rooms on OTAs and traced booking curves by category for stay dates in August 2026, the peak month that includes the Nebuta festival.
| Category | Properties / rooms | LT45 | LT30 | LT14 | LT1 |
|---|---|---|---|---|---|
| All properties | 82 / 6,609 | 67.8% | 75.5% | 84.7% | 94.3% |
| Business hotels | 35 / 4,254 | 63.3% | 73.1% | 84.4% | 94.8% |
| City hotels | 10 / 1,120 | 74.9% | 81.4% | 88.6% | 95.4% |
| Ryokan | 30 / 1,001 | 71.4% | 74.9% | 80.3% | 91.2% |
Lining up the three checkpoints brings out the category differences. Business hotels start from the lowest position at 63.3% at LT45 and climb 31.5 points to 94.8% by LT1 — the category with the greatest depth of late demand. Ryokan lead at LT45 with 71.4% but add only 19.8 points to reach 91.2% at LT1. Aomori’s business-segment inventory moves most in the final 30 days, and pricing design across that window drives revenue. Indeed, the all-property published price rises from ¥25,800 at LT45 to ¥28,200 at LT14, then returns to ¥25,800 at LT1.
For reference, in the off-peak month of June 2026, all properties stood at 57.8% at LT45, 62.6% at LT30, 73.0% at LT14 and 89.8% at LT1 — 10.0 points below August at LT45. The difference between peak and off-peak months shows up mainly in how far bookings are pulled forward at the 45-day mark; the final landing levels converge within 10 points. How the booking build-up differs across the six festival days and the days around them is analyzed in detail in our study of the Aomori Nebuta 2026 booking curve.
Prefecture-wide rate trend — ¥11,639 in August 2026, up 9.7% year on year
Tracking prefecture-wide estimated settled ADR monthly shows a market with wide seasonal amplitude. August 2026 came in at ¥11,639, up 9.7% from ¥10,606 a year earlier. The annual low is March at ¥6,447, a 1.8x gap to the peak month.
From an investment standpoint, that amplitude is itself the issue. A 1.8x gap between August and March means annual revenue depends heavily on the summer. The Tier 1 hot-spring districts feel this seasonality even more strongly. Conversely, Aomori City and Hachinohe, with their business demand, show narrower amplitude and hold an advantage in cash-flow predictability. Within Aomori, the highest rates and the steadiest earnings sit in different places.
Investment view — on capital per room, acquisition runs 20–50% below new construction
If the goal is to build a vessel for the upper price band, which route is realistic? Aomori Prefecture holds three properties owned by listed J-REITs, and disclosed acquisition prices allow capital per room to be backed out. All three are held by Invincible Investment Corporation (インヴィンシブル投資法人).
| Property | Location | Rooms | Acquired | Acquisition price | Per room |
|---|---|---|---|---|---|
| Art Hotel Hirosaki City (アートホテル弘前シティ) | Hirosaki City | 134 | February 2018 | ¥2,723 million | ¥20.3 million |
| Hotel MyStays Aomori Station (ホテルマイステイズ青森駅前) | Aomori City | 132 | August 2023 | ¥2,445 million | ¥18.5 million |
| Art Hotel Aomori (アートホテル青森) | Aomori City | 211 | July 2024 | ¥5,672 million | ¥26.9 million |
Acquisition prices are totals including land and building. Per room they range from ¥18.5 million to ¥26.9 million, with the most recent acquisition in July 2024 the highest. What would it cost to build an equivalent property new? Based on the construction-starts statistics, 2025 hotel construction cost runs ¥2.026 million per tsubo for reinforced-concrete structures. Assuming 40 rooms at 30 sqm per room with rooms making up 62% of gross floor area, total floor area is 1,935 sqm (about 585 tsubo) and construction cost ¥1.19 billion. Factoring in construction-cost inflation over the build period at an assumed rate of around 5% per year brings that to ¥1.37 billion, or ¥34.3 million per room (land excluded). The inflation rate is our own assumption, not a confirmed forecast.
New construction (building only)
¥34.3 million per room
Reinforced concrete, ¥2.026 million per tsubo, 40 rooms assumed. Land excluded. After factoring in construction-cost inflation.
Acquisition (land and building)
¥18.5–26.9 million per room
Actual acquisition prices of the three J-REIT-owned properties in the prefecture.
Difference
New construction is 1.3–1.9x acquisition
Adding land cost widens the gap further.
For the purpose of creating upper-band capacity, acquiring and renovating existing assets is more capital-efficient in Aomori than building new. Hot-spring ryokan in Tiers 2 and 3 are particularly relevant: their rates sit around ¥10,000, but many already hold the assets a move upmarket requires — open-air baths, banquet space and land. The business-succession tax regime, whose deadline falls in December 2027, also works to pull forward the timing at which succession cases in the prefecture come to market.
Suppose a 40-room property is acquired at ¥20 million per room (acquisition plus renovation), or ¥800 million in total, and repositioned into the upper band. Modelling the revenue at three estimated settled ADR levels gives the following.
| Assumed ADR (tax-exclusive equivalent) | Annual revenue | GOP (gross operating profit, 35%) | Return on invested capital | Reference level |
|---|---|---|---|---|
| ¥16,000 | ¥151.8 million | ¥53.1 million | 6.6% | Close to Sotogahama Town’s ¥16,752 |
| ¥18,000 | ¥170.8 million | ¥59.8 million | 7.5% | Close to Ajigasawa Town’s ¥17,373 |
| ¥21,000 | ¥199.3 million | ¥69.8 million | 8.7% | Close to Kazamaura Village’s ¥21,262 |
Moving both rate and occupancy widens the yield range from 4.2% (ADR ¥12,000, 55% OCC) to 10.1% (ADR ¥21,000, 75% OCC). If the mid-case ADR of ¥16,000 can be sustained, the GOP-based yield holds at 5% even if occupancy falls to 49% for the full year. Conversely, assuming 65% OCC, the ADR required to secure 5% is roughly ¥12,000 — near the top of the prefecture’s Tier 2 band (¥10,000–12,000). Repositioning into the upper band works on yield because this lift in rate outweighs the swing in occupancy.
| ADR \ OCC (full-year average) | 55% | 60% | 65% | 70% | 75% |
|---|---|---|---|---|---|
| ¥12,000 | 4.2% | 4.6% | 5.0% | 5.4% | 5.7% |
| ¥14,000 | 4.9% | 5.4% | 5.8% | 6.3% | 6.7% |
| ¥16,000 | 5.6% | 6.1% | 6.6% | 7.2% | 7.7% |
| ¥18,000 | 6.3% | 6.9% | 7.5% | 8.0% | 8.6% |
| ¥21,000 | 7.4% | 8.0% | 8.7% | 9.4% | 10.1% |
Every assumed ADR sits within the range Tier 1 properties actually achieve in the prefecture; these are not desk figures. The question is not whether the rate can be achieved, but that no location or asset capable of operating 40 rooms at that rate has yet been assembled in the prefecture. Areas like Hirosaki, where tourism demand and transport access are both in place and upper-band supply is thin, are the most plausible candidates for that assembly.
⚠ A note on ADR for future dates: estimated settled ADR from September 2026 onward in this article is based on sales prices published on OTAs at the time of the survey and will move as check-in dates approach. Please note that prices set high at present may fall through last-minute adjustments.
Conclusion — demand growth leads the country while the upper-band vessel stays at 2.8%
Lining up estimated settled ADR across Aomori’s 26 municipalities produces a 5.5x hierarchy from ¥21,262 down to ¥3,879. But every high-rate municipality is a small area backed by one to three properties, and all six cities with more than nine covered properties sit at or below roughly ¥10,000. Of the prefecture’s rooms, 45.5% are in areas with estimated ADR below ¥8,000, while just 2.8% are allocated to the upper band.
Meanwhile, guest nights in the prefecture reached a record 5.12 million in 2025, with the fastest growth rate in Japan, and foreign guest nights passed 500,000 for the first time. On the supply side, 2026 brings five openings and 363 rooms, 1.7% of existing stock, and 93% of that lands in areas with estimated ADR around ¥7,000. Construction-start statistics recorded an effective blank in 2024 at two buildings and 41 sqm, leaving a thin new-build pipeline heading into 2027.
For anyone choosing where to open in northern Tohoku, the reading splits three ways: the business band in Aomori City and Hachinohe is a dense, closely peer-referenced market; Hirosaki is a market with substantial headroom where upper-band capacity is thin relative to tourism demand; and the hot-spring districts of Shimokita and Tsugaru are markets where the rate holds but scale is small. And on capital efficiency, new construction costs ¥34.3 million per room against ¥18.5–26.9 million for acquisition. The realistic route to building upper-band capacity in Aomori runs through acquiring and repositioning existing assets, not building new.
Related reading
References and sources
■ Data sources
Municipal estimated settled ADR is the 12-month average of monthly values from September 2025 to August 2026 (N=26 municipalities; covered property counts are monthly averages). Prefecture-wide estimated settled ADR is the monthly prefecture median from September 2024 to August 2026 (an average of 183 properties per month). Estimated occupancy and booking curves use a fixed cohort for June and August 2026 stay dates (82 properties and 6,609 rooms listing at least 30% of total rooms on OTAs, OTA-listed inventory basis). Openings are based on confirmed OTA listings; J-REIT acquisition prices come from Invincible Investment Corporation disclosures; construction starts, trade-area and population figures come from the construction-starts statistics, the Economic Census and National Land Numerical Information.
■ Modelling assumptions
The repositioning model assumes 40 rooms, 65% OCC (full-year average), 365 days, a 35% GOP margin and ¥800 million total investment (¥20 million per room, acquisition plus renovation), with return on invested capital calculated as GOP ÷ total investment. The two-axis sensitivity spans ADR ¥12,000–21,000 × OCC 55–75%. New construction cost is a building-only figure based on ¥2.026 million per tsubo for reinforced concrete, 30 sqm rooms and a 62% guestroom share of gross floor area (1,935 sqm total), with construction-cost inflation during the build period factored in at an assumed rate of around 5% per year; land cost is excluded.
■ Limitations and caveats
Estimated settled ADR is an estimate (median error of roughly 7% when cross-checked against REIT-disclosed properties), and municipalities with fewer than four covered properties show wide rate swings. Estimated occupancy is on an OTA-listed inventory basis and differs from a property’s true occupancy. GOP-based yields are figures before deducting property tax, insurance, FF&E reserves, rent and similar items, and therefore run higher than NOI yields. Rates from September 2026 onward, the 2024 construction-start statistics and the 2026 opening count may each change through future price adjustments, additional permit applications and additional listings.
■ Market data
- MetroEngines Research & Consulting — municipal estimated settled ADR (N=26 municipalities, September 2025–August 2026), booking curves and estimated occupancy by category (August 2026, 82 properties and 6,609 rooms), opening data (based on confirmed OTA listings), J-REIT ownership master (as of 7 September 2026)
■ Government statistics and public data
- e-Stat, Statistical Survey on Building Construction Starts (statistics ID 0003114490, by use and by client; Aomori Prefecture, lodging)
- Ministry of Internal Affairs and Communications / Ministry of Economy, Trade and Industry, Economic Census for Business Activity (2021) (boundaries: 2020 Population Census small areas)
- Ministry of Land, Infrastructure, Transport and Tourism, Statistical Survey on Building Construction Starts
- Ministry of Land, Infrastructure, Transport and Tourism, National Land Numerical Information (projected population by 250m mesh, 2024 National Institute estimate)
- Ministry of Land, Infrastructure, Transport and Tourism, Building Dynamics Statistical Survey (planned hotel data)
- Aomori Prefecture, Aomori Prefecture Tourism Visitor Statistics
- Hirosaki City, Overview of the Accommodation Tax
■ REIT and investment benchmarks
- Invincible Investment Corporation, Portfolio List
- Invincible Investment Corporation, Hotel Portfolio (38.9% GOP result across 91 operated properties, fiscal year ended December 2024)
- archi-book, Construction Cost per Tsubo 2025 (steel ¥2.405 million / reinforced concrete ¥2.026 million)
■ News coverage
- Mutsu Shimpo, “Aomori Prefecture’s 2025 guest count hit a record 5.12 million, the fastest growth in Japan”
- Nikkei, “Hirosaki, Aomori: record 666,150 guests in 2025 on a sharp rise in foreign visitors”
- Nikkei, “Hirosaki, Aomori launches Tohoku’s first accommodation tax in December to polish local assets”
- Jutaku Shimpo, “Higashi-Nihon Real Estate to open a Richmond Hotel in central Hachinohe, Aomori”
- JLL, Japan Hotel Investment Market 2025