

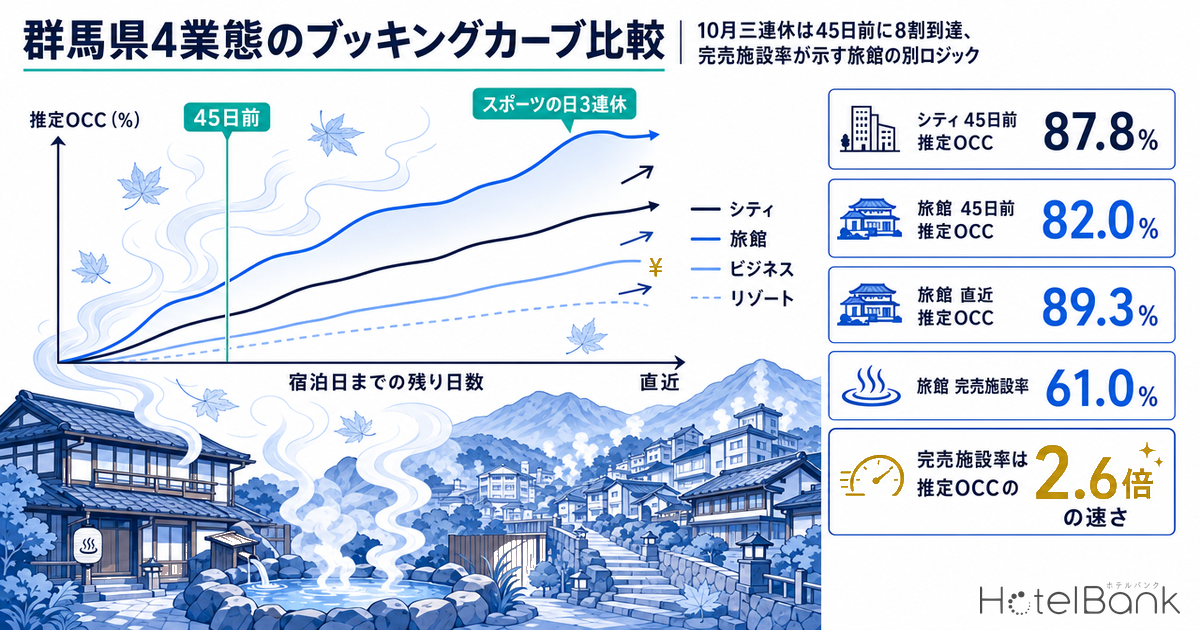
We split Gunma Prefecture’s lodging demand into four property types — city hotels, business hotels, ryokan and resort hotels — and lined them up using only observations taken from 45 days before the stay date through the latest snapshot. The headline: for Saturday, October 10, 2026 — the first night of the Sports Day three-day weekend — city hotels had already reached an estimated OCC of 87.8% (N=10 properties) and ryokan 82.0% (N=186) at 45 days out. At the latest snapshot (26 days out) the figures stood at 97.1% for city hotels, 89.3% for ryokan, 77.6% for business hotels and 76.4% for resort hotels. By contrast, on Wednesday, October 7 — a weekday in the same week — the 45-day readings were 41.4% for resort hotels, 48.9% for business hotels, 52.1% for city hotels and 65.6% for ryokan, a 24-point spread across property types. Digging further, ryokan turned out to be the only type where “estimated OCC and the sold-out property rate always move in the same direction”; for business and resort hotels the two diverged on 10 and 9 of 13 stay dates respectively. That asymmetry is where revenue decisions in Gunma fork.
Coverage: Gunma Prefecture city hotels N=10 properties (964 rooms) / business hotels N=50 (4,632 rooms) / ryokan N=187 (5,769 rooms) / resort hotels N=25 (1,985 rooms). Prices in this article are the estimated settled ADR (the transacted price level estimated from OTA and other sales data, excluding tax); occupancy is an estimate based on OTA-listed inventory. Both are defined at the end of the article. Data as of September 15, 2026 (observations through September 14).
- — Above 80% at 45 days out: estimated OCC (OTA-listed inventory basis) for Saturday, October 10, 2026 was 87.8% for city hotels (N=10) and 82.0% for ryokan (N=186). Gains from there to the latest snapshot (26 days out) were only +9.3 and +7.3 points.
- — Ryokan: 0 of 13 days: stay dates where estimated OCC rose but the sold-out property rate did not numbered 10 of 13 for business hotels, 9 of 13 for resort hotels and 5 of 12 for city hotels. For ryokan, the two metrics moved in the same direction on every date.
- — The Monday 10/12 holiday looks like a weekday: at the 45-day snapshot, city hotels were at 47.3% and ryokan at 59.9%. Holding the last day of the long weekend at peak-day rates does not match what the market shows.
Saturday, October 10 — all four types high at 45 days out, but each adds a different amount afterwards
Monday, October 12, 2026 is Sports Day, creating a three-day weekend from Saturday, October 10 (Cabinet Office, “National Holidays”). Gunma is home to hot-spring towns such as Kusatsu, Ikaho, Minakami and Shima, and absorbs long-weekend demand from the Tokyo area within driving distance (for how price bands split across Kusatsu, Ikaho, Shima–Minakami and Maebashi–Takasaki, see Gunma Hotel Market 2026: Four ADR Tiers and a ¥5,700 Upper-Mid Gap). The chart below traces the booking curve for the first night of that weekend, from 45 days before the stay date to the latest snapshot (26 days out).
Source: MetroEngines Research; compiled by HotelBank Editorial Team
All four lines slope upward (rising as days-to-arrival fall), but their shapes differ. From 45 days out to the latest snapshot, city hotels added +9.3 points, ryokan +7.3, business hotels +5.3 and resort hotels +11.2. In other words, for city hotels and ryokan most of the final picture was already set at 45 days out, while resort hotels alone picked up a double-digit gain in the 45-to-26-day window. The step in the city-hotel line from 89.8% to 96.4% between 34 and 33 days out reflects the small cohort of 10 properties: a single property closing its listed inventory moves the whole line. Lines from small cohorts should be read as “events”, not “trends”.
Setting the peak day (Sat 10/10) against a weekday (Wed 10/7) at three fixed snapshots (45 days out, 30 days out, latest) gives the following. The sold-out property rate is the (estimated) share of properties with no listed inventory visible on OTAs and other channels.
| Stay date | Type (N) | 45 days out Est. OCC / sold-out rate |
30 days out Est. OCC / sold-out rate |
Latest Est. OCC / sold-out rate |
|---|---|---|---|---|
| Oct 10 (Sat) Latest = 26 days out | City (10) | 87.8% / 30.0% | 96.4% / 40.0% | 97.1% / 50.0% |
| Ryokan (186→187) | 82.0% / 41.9% | 87.7% / 55.1% | 89.3% / 61.0% | |
| Business (50) | 72.3% / 20.0% | 75.0% / 22.4% | 77.6% / 24.0% | |
| Resort (25) | 65.2% / 20.0% | 75.4% / 20.0% | 76.4% / 24.0% | |
| Oct 7 (Wed) Latest = 23 days out | Ryokan (184→186) | 65.6% / 33.7% | 70.6% / 38.4% | 73.3% / 39.8% |
| City (10) | 52.1% / 0.0% | 51.3% / 0.0% | 53.4% / 0.0% | |
| Business (50) | 48.9% / 4.0% | 55.2% / 4.1% | 60.8% / 6.0% | |
| Resort (25) | 41.4% / 4.0% | 50.3% / 8.0% | 51.6% / 8.0% |
Source: MetroEngines Research; compiled by HotelBank Editorial Team
Two things stand out in this table: the weekday (Wed 10/7) sold-out property rate for city hotels is 0.0% at all three snapshots, and estimated OCC for the same date actually dipped from 52.1% at 45 days out to 51.3% at 30 days out. If a property adds listed inventory, estimated OCC falls even while bookings are coming in. The right way to handle this metric is not to conclude “the curve fell, so bookings were cancelled”, but to suspect a supply-side move first.
Lining up 16 stay dates at the same 45-day snapshot reveals Gunma’s demand structure
Next, we took the 16 stay dates from Friday, October 2 to Saturday, October 17 and aligned all of them at the same snapshot — 45 days before the stay date — to compare estimated OCC. Because the snapshot is fixed, the dates can be compared directly.
Source: MetroEngines Research; compiled by HotelBank Editorial Team
While Saturday 10/10, the first night of the long weekend, stands out for all four types, the holiday itself — Monday 10/12 — drops to 47.3% for city hotels, 59.9% for ryokan and 44.4% for resort hotels, little different from the weekdays that follow (Tue 10/13 and Wed 10/14). The long weekend runs “first night > middle night > last night”, and it is already visible at 45 days out that the last night should effectively be priced as a weekday.
Averaging the 45-day snapshot by day of week makes the differences in each type’s baseline clear.
| Type (N properties) | Weekday (Mon–Thu, 8-day avg.) |
Fri (3-day avg.) |
Sat (3-day avg.) |
Sun (2-day avg.) |
|---|---|---|---|---|
| Ryokan (187) | 64.2% | 67.3% | 76.1% | 71.1% |
| City (10) | 50.0% | 67.2% | 71.0% | 54.5% |
| Business (50) | 50.7% | 60.5% | 65.4% | 53.5% |
| Resort (25) | 44.7% | 51.6% | 59.4% | 49.5%* |
* The Sunday column is a two-day average of 10/4 and 10/11 (the middle night of the long weekend), so it is more volatile than the other columns. Note that it includes a long-weekend middle night.
Source: MetroEngines Research; compiled by HotelBank Editorial Team
The ryokan weekday baseline of 64.2% is 14 points above city hotels (50.0%) and business hotels (50.7%). Gunma is a market where hot-spring leisure demand keeps flowing in on weekdays, so a “weekday” for a ryokan is a different thing from a weekday for an urban hotel. Conversely, the ryokan weekend uplift is the smallest at +11.9 points (weekday 64.2% → Saturday 76.1%), while city hotels (+21.0 points) and business hotels (+14.7 points) depend more heavily on weekends. The same pattern — demand troughs falling on different days for each type — also showed up in July 2026 results; the breakdown is in Gunma Day-of-Week OCC: Ryokan Trough Wed 78.9%, Business Sun 81.3%.
The sold-out property rate and estimated OCC don’t move together — ryokan were the only exception
This is the most practically useful finding in this analysis. We compared the change from 45 days out to 30 days out on two axes: estimated OCC (inventory-volume basis) and the sold-out property rate (property-count basis). Only stay dates with both snapshots available are included.
Source: MetroEngines Research; compiled by HotelBank Editorial Team
Looking only at the gain in estimated OCC, resort hotels lead (average +9.1 points, 13 days), followed by ryokan (+5.4 points, 13 days), business hotels (+4.3 points, 13 days) and city hotels (+3.7 points, 12 days). The change in the sold-out property rate, however, comes in a completely different order. Ryokan averaged +4.3 points and city hotels +4.2 points, whereas resort hotels managed only +0.9 points, and business hotels actually went negative, averaging −1.2 points.
Counting by date shows how often this divergence occurs. Stay dates where “estimated OCC rose but the sold-out property rate did not (flat or down)” numbered 10 of 13 for business hotels, 9 of 13 for resort hotels and 5 of 12 for city hotels. Ryokan alone recorded 0 of 13 — the two metrics moved in the same direction on every date.
What is happening when the two metrics diverge
Estimated OCC is weighted by “rooms”, while the sold-out property rate counts “properties”. The gap between them therefore tells you where demand is landing.
• Estimated OCC rises but the sold-out property rate does not (Gunma’s business/resort pattern) = bookings are being absorbed by large properties and no property has closed out yet. The market as a whole still has room.
• The sold-out property rate rises faster than estimated OCC (Gunma’s ryokan pattern; on Sat 10/10, +19.1 points in sold-out rate versus +7.3 points in estimated OCC) = small properties close out one after another, and the remaining inventory concentrates in particular properties. This is the phase in which guests’ competitive alternatives shrink rapidly.
For ryokan on Saturday, October 10, the sold-out property rate rose +19.1 points, from 41.9% at 45 days out to 61.0% at the latest snapshot. Estimated OCC grew +7.3 points over the same window, so the sold-out property rate is moving 2.6 times as fast. In Gunma, where many ryokan have 10–30 rooms, one property closing barely dents prefecture-wide inventory. From a guest’s point of view, though, “the places I can choose are disappearing one by one”, and the pricing power of the remaining properties rises faster than inventory alone would suggest. Whether you can read this gap determines how precisely you price peak dates.
A price yardstick — estimated settled ADR for finalized months (YoY)
If the curve shapes differ by property type, the price level to layer on top should differ too. We took August 2026 as the most recent month where finalized figures can be compared with each other, and set it against the same month a year earlier.
| Type | Aug 2025 Est. settled ADR (finalized) |
Aug 2026 Est. settled ADR (finalized) |
YoY | Oct 2025 Est. settled ADR (finalized) |
|---|---|---|---|---|
| Ryokan | ¥17,517 N=268 | ¥18,102 N=278 | +3.3% | ¥15,328 N=271 |
| Resort | ¥16,890 N=34 | ¥19,055 N=35 | +12.8% | ¥13,802 N=34 |
| City | ¥11,519 N=11 | ¥10,262 N=13 | −10.9% | ¥11,091 N=12 |
| Business | ¥6,732 N=96 | ¥7,081 N=101 | +5.2% | ¥6,372 N=99 |
Source: MetroEngines Research; compiled by HotelBank Editorial Team
Ryokan rose +3.3% YoY and resort hotels +12.8%, while city hotels fell −10.9%. Bear in mind, however, that the city-hotel sample is small at N=11–13 properties, so a change of one or two properties in the mix can move the rate substantially. For October 2026, the ryokan estimated settled ADR is about ¥16,400 (N=278 properties; an estimate based on current sales), which sits above the finalized figure of ¥15,328 for the same month last year. Because this is an estimate based on current sales and uses a different basis, a direct comparison with finalized figures should wait until the month is finalized. Nor is this the first time the sign of YoY change has split by property type; how the signs diverged in June 2026 is covered in Gunma Settled ADR June 2026: Business +2.9%, City -9.0%, Ryokan -3.9%.
For revenue managers running ryokan and hotels in Gunma — implications and action plan
(a) Operational insights
1. A date’s character is largely set by its position at 45 days out. Sat 10/10 reached 87.8% for city hotels and 82.0% for ryokan at 45 days out, and the gain from there to the latest snapshot was only +9.3 points (city) and +7.3 points (ryokan). If you take a snapshot of your own booking mix for the same stay date once at 45 days out and check it against these market levels, you are less likely to confuse “dates that will still grow” with “dates that won’t”.
2. The gap between the sold-out property rate and estimated OCC shows which way your pricing headroom points (the number of alternatives, not the volume of inventory). For ryokan the two metrics diverged on 0 of 13 dates, and on 10/10 the sold-out rate rose 2.6 times as fast as estimated OCC. On dates when neighboring properties close out one after another, there is little reason to sit on a low rate while you still have rooms. Business hotels are the opposite: on 10 of 13 dates estimated OCC rose without the sold-out rate moving, so alternatives were not shrinking. “Filling up” means different things in each case.
3. Don’t treat a three-day weekend as a single product. At the 45-day snapshot, Sat 10/10 was at 87.8% for city hotels, but the holiday itself, Mon 10/12, was at 47.3% — close to the following weekdays, Tue 10/13 (39.8%) and Wed 10/14 (42.6%). If you build a multi-night package, leaving the last night at peak-day rates does not match the market reality.
4. For Gunma ryokan, weekdays are not a “lull”. The weekday average at the 45-day snapshot was 64.2% for ryokan versus 50.0% for city hotels and 50.7% for business hotels. The ryokan weekend premium (weekday → Saturday, +11.9 points) is narrower than for urban hotels (city +21.0 points), so planning across the whole week, weekdays included, fits the market structure better than concentrating on weekends.
(b) Action plan
| Horizon | Action | Decision trigger (tied to figures in this article) | Objective |
|---|---|---|---|
| Today to this week | Re-check remaining rooms and rates for Sat 10/10 | The market’s latest snapshot shows ryokan at 89.3% / sold-out rate 61.0% and city hotels at 97.1% / 50.0%. If your property still has double-digit rooms left for that night, determine whether the cause is weak demand or weak exposure. | Avoid leaving rate on the table before the market fully closes out |
| Re-base rates for Mon 10/12 (holiday) on weekday levels | At the 45-day snapshot, 10/12 was at 47.3% for city hotels and 59.9% for ryokan — on par with Tue 10/13 and Wed 10/14. If you still have 10/12 priced at the same level as 10/10, consider revising it. | Avoid unsold rooms lingering on the last night of the long weekend | |
| Within 2 weeks | Add the “gap” between the sold-out property rate and estimated OCC to weekly monitoring | Using your own data for the last 8 weeks, determine whether your type follows the ryokan pattern (both metrics move together) or the business/resort pattern (divergence on 10 and 9 of 13 dates). | Interpret “filling up” in a way that fits your property type |
| Write down a rule for diagnosing a falling curve | Even in the market, city hotels on Wed 10/7 dipped from 52.1% at 45 days out to 51.3% at 30 days out. When your own curve falls, first check whether additional inventory or new rate plans were released. | Prevent unnecessary price cuts triggered by false alarms | |
| Toward next month | Make the 45-day snapshot a routine | On peak dates, the market had already reached more than 80% at 45 days out (ryokan 82.0% and city hotels 87.8% for 10/10). Record your key dates from November onward at 45 days out as well, as input for next year’s decisions. | Build the base data for next season’s rate-change calendar |
| Compare your price band with ADR levels by property type | Finalized market levels for August 2026 were ¥18,102 for ryokan (N=278), ¥19,055 for resort hotels (N=35) and ¥7,081 for business hotels (N=101). If your results for the same month fall well outside this range, work out whether product design or market position is the cause. | Align your own view of your price band with your actual market position |
Source: MetroEngines Research; compiled by HotelBank Editorial Team
Summary — three yardsticks for reading October in Gunma
Yardstick 1: how far a date has got at 45 days out. At 45 days out, Saturday, October 10, 2026 stood at 87.8% for city hotels, 82.0% for ryokan, 72.3% for business hotels and 65.2% for resort hotels (all estimated OCC). Dates already above 80% at this snapshot tended to add only single-digit points afterwards. Conversely, a type sitting in the 60s at 45 days out, like resort hotels, gained +11.2 points in the 45-to-26-day window, making that window the main battleground.
Yardstick 2: the gap between the sold-out property rate and estimated OCC. For ryokan the two metrics diverged on 0 of 13 dates, and on peak dates the sold-out rate rises 2.6 times as fast as estimated OCC. Business hotels (10 of 13 dates) and resort hotels (9 of 13) are the reverse: estimated OCC rises without alternatives shrinking. The same increase in occupancy can mean a very different tightening of the market.
Yardstick 3: judge a date’s character by the snapshot, not the day of week. The holiday Monday 10/12 was at 47.3% for city hotels at the 45-day snapshot, close to the weekdays Tue 10/13 (39.8%) and Wed 10/14 (42.6%). A “long weekend” on the calendar is not the same as a “peak date” in demand. Lining up 16 dates at the same 45-day snapshot is worth running on your own property’s data, even once a month.
About the Data
• Definition of estimated OCC: occupancy on an OTA-listed inventory basis = 100 − 100 × OTA-listed remaining rooms ÷ total rooms. The sample is a fixed cohort of properties that list at least 30% of their total rooms on OTAs (the same set of properties for every stay date; “N=” in this article is its property count). It is an estimate based on how OTA-sold inventory is being absorbed and is defined differently from actual room occupancy (rooms not listed are counted as absorbed, so it reads high). This article labels it “estimated OCC (OTA-listed inventory basis)”. Target month: October 2026 (stay dates October 2–17, 2026).
• Booking curves: based on observations from 45 days before the stay date through the latest snapshot. The observation window for this article is August 18 to September 14, 2026.
• Sold-out property rate: the (estimated) share of properties in the cohort with no listed inventory visible on OTAs and other channels. Because it counts properties rather than rooms, its base differs from that of estimated OCC.
• Estimated settled ADR: the transacted price level (excluding tax) estimated from OTA and other sales data (lowest-plan price level × property-type coefficient, ensembled across multiple channels). Past months are finalized figures; current and future months are estimates based on current sales. Median error against published operating results: 6.6%.
• Sample N breakdown: booking curves cover Gunma Prefecture city hotels N=10 properties (964 rooms) / business hotels N=49–50 (4,600–4,632 rooms) / ryokan N=183–187 (5,692–5,769 rooms) / resort hotels N=25 (1,985 rooms). Observation coverage was 98.0% or higher for every type and snapshot, so the common bias of fewer properties being observed as the stay date approaches barely arises in this window (at most a change of 4 properties for ryokan). Figures for intervals where the observed property count shifts do, however, include the effect of properties entering or leaving the sample. Estimated settled ADR covers Gunma ryokan N=268–278 properties / resort hotels N=34–35 / city hotels N=11–13 / business hotels N=96–101 (varies by month).
• Data as of September 15, 2026 (observations through September 14, 2026). Sales and inventory change daily, so the figures in this article are a snapshot at the time of retrieval.
References and Sources
• Cabinet Office, Government of Japan, “National Holidays” (国民の祝日について) https://www8.cao.go.jp/chosei/shukujitsu/gaiyou.html (confirms Sports Day 2026 falls on October 12)