

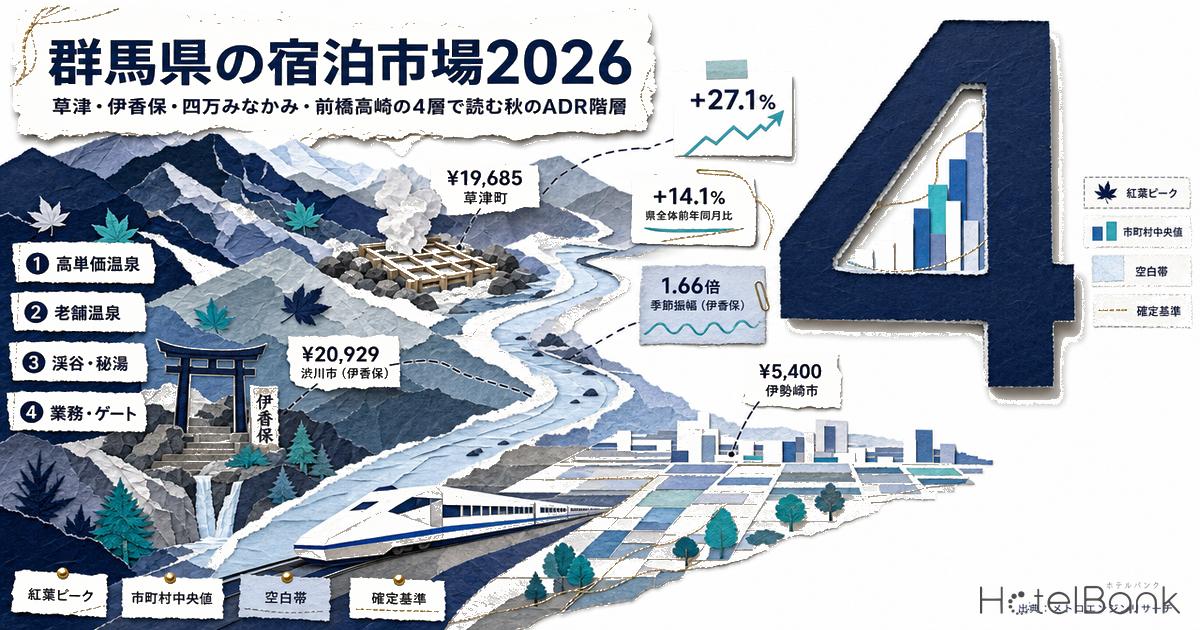
Gunma is easily discussed as a single “onsen prefecture.” Break its accommodation pricing down by municipality, however, and four clearly separated price tiers emerge. Tracking estimated settled ADR from November 2024 through June 2026 with MetroEngines Research data, the municipal median for November — the foliage peak — ranges from roughly ¥20,900 at the top to about ¥5,400 at the bottom, a spread of nearly four times.
This article divides Gunma’s accommodation market into four tiers — premium onsen, established onsen, gorge and hidden onsen, and business/gateway — compares them side by side, and quantitatively maps the price band left vacant between tiers, along with the areas positioned to grow into it.
Metric Definitions Used in This Article
- ADR (average daily rate): An estimated settled rate (tax-exclusive equivalent) calculated by applying property-type correction coefficients to the lowest published plan level each property lists on OTAs (double occupancy, per-room rate, tax included). Cross-checked against property-level actuals disclosed by listed hotel REITs (91 properties, most recent three months), the median error is approximately 7%. These are estimates and differ from each property’s actual settled rates and accounting figures. Area-level ADR is the median across the target properties (the level of a typical property in that area).
- Confirmed basis vs. estimated basis: ADR for past months is finalized on a verified historical basis. Months from the survey date (July 2026) onward are estimated from prices currently listed on OTAs, and rest on a different basis. All tier comparisons and year-on-year figures in this article use only months on the confirmed basis (through June 2026).
- OCC (occupancy): The share of sold rooms against total rooms in the area (an estimate based on OTA-listed inventory). It reflects how listed inventory is being absorbed on OTAs and differs from each property’s actual overall occupancy. It is used only as a macro indicator at the prefecture and municipality level; it is not calculated for individual properties.
- LT (lead time): Days remaining until the check-in date. LT0 = same day.
- Data sources: MetroEngines Research / Gunma Prefecture, “Tourism Visitor Statistics Survey Report”
- — At the foliage peak (November 2025), municipal medians were led by Shibukawa (Ikaho) at about ¥20,900, with Kusatsu, Nakanojo (Shima) and Minakami forming the onsen tier — clearly separated from the business tier of Maebashi at ¥8,800 and Takasaki at ¥7,400.
- — The prefecture-wide year-on-year change was +14.1%, but the breakdown shows ryokan at +19.9% versus business hotels at +2.7% — a widening gap between property types.
- — Not a single municipal median falls in the roughly ¥5,700-wide band from ¥12,900 to ¥18,600, leaving an upper-middle vacancy.
- — Occupancy headroom remains in Nakanojo (Shima, estimated occupancy 83.1%), Minakami (76.0%) and Tsumagoi (65.5%), so the fuel for rate extension exists in a different form in each area.
- — Large-scale supply over the past two years has concentrated in the business/gateway tier; moves to fill the middle vacancy have yet to begin in earnest.
November and December are the prefecture’s price peaks
Start with the prefecture-wide outline. Gunma’s estimated settled ADR was about ¥11,400 in November 2024 (N=433 properties) and about ¥13,000 in November 2025 (N=411 properties), a year-on-year change of +14.1%. Across the full year the curve has two peaks: the summer-holiday high in August, and the foliage and year-end high running from November into December. In 2025 in particular, December recorded the annual maximum at about ¥13,900, showing a structure in which seasonal demand from autumn into winter lifts the prefecture’s overall price level.
Source: MetroEngines Research; compiled by the HotelBank Editorial Team (N=411–446 properties per month)
The demand side corroborates this. According to Gunma Prefecture’s “FY2024 Tourism Visitor Statistics Survey Report,” visitors to the prefecture’s nine principal onsen destinations totaled 7,755 thousand, or 108.3% of the prior year. The breakdown: Kusatsu Onsen 3,930 thousand (112.0% year on year), Ikaho Onsen 1,348 thousand (107.9%), Minakami Onsen 1,248 thousand (103.1%), Manza Onsen 423 thousand (100.2%), Shima Onsen 304 thousand (97.4%) and Sarugakyo Onsen 254 thousand (113.9%). Tourism spending reached ¥280.9 billion, 106.2% of the prior year, of which accommodation accounted for ¥191.4 billion. Tourism demand in the prefecture is building steadily.
At the foliage peak, the prefecture’s highest rate was Ikaho — not Kusatsu
Here is the core of it. Lining up municipal median ADR for November 2025 (confirmed basis) produces the following order.
| Tier | Municipality (main onsen / hub) | Nov 2025 ADR |
YoY | Annual avg. ADR |
Seasonal amplitude (max ÷ min) |
N |
|---|---|---|---|---|---|---|
| Tier 2 Established onsen | Shibukawa (Ikaho) | ¥20,929 | +7.9% | ¥17,098 | 1.66× | 46 |
| Tier 1 Premium onsen | Kusatsu (Kusatsu Onsen) | ¥19,685 | +27.1% | ¥17,738 | 1.46× | 81 |
| Tier 3 Gorge / hidden onsen | Nakanojo (Shima) | ¥19,344 | +7.1% | ¥17,996 | 1.34× | 34 |
| Tier 3 Gorge / hidden onsen | Minakami (Minakami / Sarugakyo) | ¥18,626 | +5.6% | ¥18,120 | 1.29× | 48 |
| (Highland) | Tsumagoi (Manza / Kita-Karuizawa) | ¥12,896 | +6.0% | ¥13,608 | 1.77× | 22 |
| (Tone-Numata) | Numata (Oigami) | ¥12,589 | +4.6% | ¥11,744 | 1.67× | 17 |
| (Tone-Numata) | Katashina (Oze / Marunuma) | ¥11,082 | +18.6% | ¥10,714 | 1.22× | 25 |
| Tier 4 Business / gateway | Maebashi | ¥8,808 | +17.2% | ¥7,601 | 1.33× | 30 |
| Tier 4 Business / gateway | Takasaki | ¥7,377 | +8.3% | ¥7,319 | 1.19× | 31 |
| Tier 4 Business / gateway | Ota | ¥6,549 | +2.2% | ¥6,650 | 1.29× | 12 |
| (Eastern Gunma) | Isesaki | ¥5,400 | +2.2% | ¥5,370 | 1.42× | 12 |
Source: MetroEngines Research; compiled by the HotelBank Editorial Team. N = the 12-month median of the number of properties used to calculate estimated settled ADR in each municipality. Annual average and seasonal amplitude cover the 12 confirmed-basis months from July 2025 to June 2026.
The result runs somewhat against intuition. The highest rates in the prefecture are captured not by Kusatsu but by Shibukawa (Ikaho Onsen). Its November 2025 median of about ¥20,900 exceeded Kusatsu’s roughly ¥19,700 by some ¥1,200. On an annual average, Kusatsu leads slightly at ¥17,700 against Shibukawa’s ¥17,100 — making Shibukawa a market that is “not expensive all year, but whose autumn peak stands out.”
Seasonal amplitude bears this out. Shibukawa spans 1.66× from its annual low in June 2026 (about ¥12,600) to its high in August 2025 (about ¥21,000), the widest swing among the prefecture’s major onsen destinations. Kusatsu, by contrast, sits at 1.46×, Nakanojo at 1.34× and Minakami at 1.29× — all more level. In other words, Ikaho has settled into an approach that takes a large price gap between peak and off-peak, while Minakami runs to maintain a stable rate throughout the year. Neither is superior; the shape of demand simply differs.
Source: MetroEngines Research; compiled by the HotelBank Editorial Team (all months on the confirmed basis)
On growth, Kusatsu’s +27.1% year on year stands apart. While the other onsen-tier municipalities held to the +5–8% range, Kusatsu alone jumped a level higher. That said, the number of properties analyzed in Kusatsu rose from the 110s to the 140s between 2025 and 2026, so new entry by accommodation supply may itself have contributed to an upward shift in the price mix. Meanwhile Maebashi (+17.2%) and Katashina (+18.6%) also posted double-digit growth, showing that rates are being lifted not only at the top of the range but in the middle and lower bands as well.
Ryokan +19.9%, business hotels +2.7% — the gap between property types widened
Recut by property type rather than municipality, the spread of the tiers becomes sharper still. Prefecture-wide estimated settled ADR for November 2025 by type was about ¥18,000 for ryokan (N=265 properties), about ¥14,200 for resort hotels (N=34), about ¥9,800 for city hotels (N=12) and about ¥6,600 for business hotels (N=100).
Source: MetroEngines Research; compiled by the HotelBank Editorial Team (confirmed basis, all of Gunma Prefecture)
What deserves attention is the difference in growth. Ryokan rose +19.9% year on year and resort hotels +10.3% — both double digits — while city hotels managed +6.9% and business hotels only +2.7%. As a result, the rate multiple between ryokan and business hotels widened from 2.33× in November 2024 to 2.72× in November 2025. Gunma’s autumn price increase, in short, was not a uniform prefecture-wide rise but a phenomenon led by the ryokan segment.
This does not mean business demand is failing to grow. As discussed below, the business/gateway tier ranks near the top of the prefecture on occupancy, building revenue through occupancy rather than rate. Each tier simply constructs its revenue differently.
¥12,900–¥18,600 — a band with no municipal median at all
Placing the four tiers side by side reveals a large discontinuity between them. Sorting November 2025 municipal medians in ascending order: Isesaki ¥5,400 / Ota ¥6,500 / Kiryu ¥7,000 / Takasaki ¥7,400 / Maebashi ¥8,800 / Annaka ¥9,000 / Katashina ¥11,100 / Numata ¥12,600 / Tsumagoi ¥12,900 — and there the sequence breaks off, with the next entry jumping all the way to Minakami at ¥18,600. Across the roughly ¥5,700 span from ¥12,900 to ¥18,600, not a single municipal median exists.
The same vacancy is visible by property type. No clear tier has formed between city hotels at about ¥9,800 and resort hotels at about ¥14,200, nor between resort hotels and ryokan at about ¥18,000. Gunma’s accommodation market is split into two poles — a practical band of ¥5,000–¥13,000 and an onsen ryokan band above ¥18,000 — with the upper-middle range in between, roughly ¥13,000–¥18,000, structurally thin.
Source: MetroEngines Research; compiled by the HotelBank Editorial Team. ADR is for November 2025 (confirmed basis); occupancy is for June 2026 (confirmed month). Circle size represents OTA-listed room count. Municipalities with fewer than 10 properties in the estimated settled ADR sample (Naganohara, Shimonita and others) are excluded.
Is this vacancy a demand trough that cannot be filled? The data suggests otherwise. Tsumagoi, Numata and Katashina, sitting at the lower edge of the gap, all hold year-round tourism assets — highlands, ski terrain, Oze — while Minakami at the upper edge posts the prefecture’s highest annual average ADR at ¥18,100. Demand foundations exist on both sides of the vacancy; only the band between them is unsupplied.
Occupancy headroom remains in Minakami and Tsumagoi
Supply and demand deserve a look alongside price. Estimated occupancy by municipality for June 2026 (confirmed month) lines up as follows: Ota 87.2%, Nakanojo 83.1%, Takasaki 82.6%, Annaka 82.6%, Isesaki 82.2%, Katashina 81.3%, Kusatsu 80.7%, Numata 80.6%, Shibukawa 78.8%, Maebashi 78.8%, Minakami 76.0% and Tsumagoi 65.5%.
| Property type (all of Gunma) | Properties | OTA-listed rooms | Estimated occupancy |
|---|---|---|---|
| Business hotels | 90 | 8,067 | 89.2% |
| Ryokan | 230 | 6,160 | 87.0% |
| City hotels | 12 | 1,059 | 78.3% |
| Resort hotels | 27 | 2,253 | 73.5% |
| All properties | 519 | 18,849 | 85.7% |
Source: MetroEngines Research; compiled by the HotelBank Editorial Team (June 2026, confirmed month)
Business hotels at 89.2% are the highest in the prefecture. They occupy the lowest rate tier yet absorb inventory the fastest — confirming the “revenue through occupancy rather than rate” structure noted above. Resort hotels, at 73.5%, are the lowest, a full 13.5 points below ryokan at 87.0%. By municipality, Minakami at 76.0% and Tsumagoi at 65.5% sit near the bottom, and in both cases a property mix weighted toward resort and highland formats is likely a factor.
The start of the foliage season is also worth checking as it stands today. Saturday, October 10, 2026 is the first day of a three-day weekend running through Monday, October 12 (Sports Day). Tracking inventory absorption by property type for check-in on that date, the path from LT90 (as of July 12) to LT80 (as of July 22) is as follows.
Source: MetroEngines Research; compiled by the HotelBank Editorial Team (all of Gunma Prefecture, check-in October 10, 2026, 434 properties / 18,520 rooms)
Despite being the first day of a three-day weekend, occupancy at LT80 stands at 74.0% for business hotels, 72.0% for ryokan and 70.1% across all properties. Resort hotels are again the lowest at 54.4%, with 1,257 of their 2,759 rooms across 31 properties still listed on OTAs. Against a demand peak like the foliage long weekend, the resort segment is still carrying a substantial volume of unsold inventory. Put the other way, how far absorption can be pushed over the next two and a half months will determine autumn RevPAR.
Recent large-scale supply is concentrated in the business/gateway tier
Are there signs the vacancy will be filled? On the supply data, the answer is “not yet.” New openings in Gunma confirmed as OTA listings by MetroEngines Research numbered 46 properties in 2024, 33 in 2025 and 20 in 2026 (as of July). Extracting those with 50 rooms or more, the locational skew is striking.
| Year confirmed | Property | Rooms | Type | Tier |
|---|---|---|---|---|
| 2026 | Hotel Route Inn Grand Maebashi (ホテルルートインGrand前橋) | 243 | Business hotel | Tier 4 Business / gateway |
| 2025 | APA Hotel Takasaki-Eki Higashiguchi (アパホテル〈高崎駅東口〉) | 199 | Business hotel | Tier 4 Business / gateway |
| 2025 | APA Hotel Gunma Ota-Eki Kita (アパホテル〈群馬太田駅北〉) | 127 | Business hotel | Tier 4 Business / gateway |
| 2025 | Kamenoi Hotel Kusatsu Resort (亀の井ホテル 草津リゾート) | 103 | Resort hotel | Tier 1 Premium onsen |
| 2026 | B/C HOTEL Kusatsu (B/C HOTEL 草津) | 97 | Resort hotel | Tier 1 Premium onsen |
| 2025 | Akagi Natural Onsen Hana Hotel & Spa Shibukawa (赤城天然温泉ハナホテル&スパ渋川) | 86 | Resort hotel | Tier 2 Established onsen (Shibukawa) |
Source: MetroEngines Research & Consulting (based on confirmed OTA listings). Properties with 50 rooms or more.
The two largest — 243 rooms in Maebashi and 199 rooms in Takasaki — are both supply into the business/gateway tier. Large-scale supply into the onsen tier is limited to two properties in Kusatsu (103 and 97 rooms) and one in Shibukawa (86 rooms); no openings of 50 rooms or more have been confirmed in Nakanojo, home to Shima Onsen, or in Minakami. In other words, Tier 3 — the gorge and hidden onsen tier, with the highest rates and the closest proximity to the vacancy — has seen no notable supply added over the past two years.
On the future pipeline, one project in Gunma can be identified on the basis of MLIT’s “Building Construction Statistics Survey”: a 150-room, 10-story building in Kasakake, Midori City, scheduled for completion in April 2027 and started in September 2025. This is a building-confirmation-application basis, however, and because further applications are expected to add to both the project count and the room count, it should be read as a floor for the confirmed pipeline at this point in time. Note too that new-opening data is based on confirmed OTA listings, and since listings typically appear several months before opening, recent and subsequent years may increase as further listings come through.
Gunma’s price tiers on the map
It is worth confirming how the four tiers are arranged geographically. Circle size shows estimated settled ADR for November 2025; color indicates the tier.
Source: MetroEngines Research; compiled by the HotelBank Editorial Team. Coordinates are the median of each municipality’s accommodation distribution.
The high-rate band clusters in the prefecture’s northwest (Kusatsu, Manza, Shima, Minakami), while the business band lines up across the plain to the southeast (Maebashi, Takasaki, Isesaki, Ota). Between them — geographically, along the Tone River corridor running from Shibukawa up to Numata — a price fault line is visible even on the map. Two movement corridors, the Kan-Etsu Expressway and the Joetsu Shinkansen, cross that fault line, placing it on the transit route from the Tokyo metropolitan area to the onsen destinations.
Where are the conditions in place to reach the middle band?
On the data above, it is worth setting out which areas hold the potential to reach the upper-middle band (roughly ¥13,000–¥18,000). None of what follows is intended as an assessment of existing operations; the question is what can be added on top of strengths that already exist.
Shibukawa (Ikaho) — autumn price elasticity is already demonstrated. Seasonal amplitude of 1.66× is the largest among the prefecture’s major onsen destinations, and the numbers already show that rates can be lifted at the demand peak. November 2025 recorded the prefecture’s highest level at about ¥20,900. June 2026, meanwhile, came in at about ¥12,600 — precisely the lower edge of the vacancy. Holding pricing power at the peak while falling to the middle band in the low season means, read another way, that this is the area with the most room to hold the upper-middle band steadily through the year. A resort hotel of 86 rooms was also confirmed as a 2025 opening, so there is movement on the supply side as well.
Nakanojo (Shima) — occupancy strength is running ahead of price. Estimated occupancy of 83.1% in June 2026 is the highest in the onsen tier. Limited to the ryokan segment it reaches 84.8%, close to the prefecture-wide ryokan average of 87.0%. Even so, November 2025 ADR of about ¥19,300 came in below Kusatsu. Price has yet to catch up with the strength of demand, and there is an opportunity here to expand revenue by combining staged pricing. That said, the sample is N=34, less than half of Kusatsu’s N=81, and the small size of the market itself should be kept in view as a premise.
Minakami (Minakami / Sarugakyo) — the prefecture’s highest annual average rate, with inventory headroom left. Annual average ADR of ¥18,100 is the top figure in Gunma. A leveled price structure with seasonal amplitude of 1.29× is itself evidence of a stable year-round revenue base. Estimated occupancy of 76.0% in June 2026 is on the low side for the onsen tier, leaving headroom in inventory. Minakami Onsen drew 1,248 thousand visitors in 2024 (103.1% year on year), approaching Ikaho’s scale, while Sarugakyo Onsen’s 254 thousand (113.9%) was the strongest growth among the prefecture’s major onsen destinations. The base of demand is broadening steadily.
Tsumagoi (Manza / Kita-Karuizawa) — the size of the swing points to upside. Seasonal amplitude of 1.77× is the largest in the prefecture. January 2026 reached the upper-middle band at about ¥16,800, while June 2026 fell to about ¥9,500. The question is how far the rate achieved in winter can be extended into autumn, including the foliage season. Estimated occupancy of 65.5% is the lowest in the prefecture, meaning the raw material — inventory — is the most abundant here.
What these areas share is that every one of them is already capturing upper-middle rates at peak. The vacancy appears when viewed on an annual average; at instantaneous peak, the level has already been reached. The question, therefore, is not “how to create a new price band” but “how many days the level already being achieved can be extended across.” In Gunma, where the foliage peak concentrates from late October into mid-November, how the shoulders around it are designed — the early-October long weekend (Oct 10–12) and the late-November long weekend (Nov 21–23) — translates directly into lifting annual ADR.
Conclusion
Gunma’s accommodation market divides clearly into four tiers by price level. Among municipal medians for November 2025 — the foliage peak — Shibukawa (Ikaho) leads at about ¥20,900, followed by Kusatsu at about ¥19,700, Nakanojo at about ¥19,300 and Minakami at about ¥18,600 at the top, while the business/gateway tier of Maebashi at about ¥8,800, Takasaki at about ¥7,400 and Ota at about ¥6,500 forms the bottom. The prefecture-wide year-on-year change was +14.1%, but the breakdown differs sharply by property type: ryokan +19.9% against business hotels +2.7%.
And between the two groups, across the roughly ¥5,700 span from ¥12,900 to ¥18,600, not a single municipal median exists. Large-scale supply over the past two years has concentrated in the business/gateway tier, and moves to fill this vacancy have yet to begin in earnest. Ikaho’s price elasticity, Shima’s occupancy strength, Minakami’s year-round stability, Tsumagoi’s inventory headroom — the raw material for reaching the upper-middle band already exists in each area, in a different form. Autumn 2026 will be the season that asks how that material is translated into price.
⚠ Note on ADR for future dates: All tier comparisons and year-on-year figures in this article use data from months on the confirmed basis (through June 2026). Months from July 2026 onward are estimated from prices listed on OTAs as of the survey date; because the calculation basis differs from confirmed months, no direct comparison of levels is made. Listing-based data for future months shifts as the check-in date approaches. The booking curve for check-in on October 10, 2026 is likewise an observation at LT90–LT80, and conditions will change as bookings progress.
References and Sources
■ Data sources
Estimated settled ADR by municipality and property type (December 2023 – June 2026, confirmed basis, N=411–446 properties), estimated occupancy (as of June 2026, estimated on an OTA-listed inventory basis) and the booking curve (October 2026 check-in basis) are based on aggregated MetroEngines Research data. Visitor figures draw on published values from the Gunma Prefecture tourism visitor statistics, the Japan Tourism Agency and e-Stat.
■ Calculation assumptions
ADR is the estimated settled rate per room per night (confirmed basis, not listed price). Municipal comparisons use the monthly median, and seasonal amplitude is defined as the monthly maximum divided by the monthly minimum. Year-on-year figures are calculated only for months on the confirmed basis (through June 2026).
■ Limitations and caveats
Estimated occupancy is an approximation using OTA-listed inventory as the denominator and does not match actual occupancy. ADR for future dates (autumn 2026 onward) moves with supply and demand and is therefore not used in tier comparisons or year-on-year figures. Note that smaller municipalities have few properties, so their medians swing more widely.
■ Market data
- MetroEngines Research — estimated settled ADR by municipality and property type (December 2023 – June 2026, confirmed basis, N=411–446 properties), estimated occupancy (June 2026), booking curve (check-in October 10, 2026; 434 properties / 18,520 rooms)
- MetroEngines Research & Consulting (based on confirmed OTA listings) — new openings in Gunma Prefecture (46 properties in 2024 / 33 in 2025 / 20 as of July 2026)
■ Government and municipal statistics
- Gunma Prefecture, “FY2024 Tourism Visitor Statistics Survey Report” (Gunma Prefecture, Department of Industry and Economy, Strategic Sales Bureau, Tourism and Retreat Promotion Division) — visitor counts by principal onsen destination, tourism spending
- Full text of the same report (PDF)
- Ministry of Land, Infrastructure, Transport and Tourism, “Building Construction Statistics Survey” — building plans in Gunma Prefecture (Kasakake, Midori City; 150 rooms; completion scheduled April 2027)
■ Map
- Map tiles: open data