

Where will Japan’s inbound numbers land in 2026? Foreign visitor arrivals for July 2026, published by the Japan National Tourism Organization (JNTO) on 19 August 2026, came to 3,442,100 — a record high for the month of July. Year on year, however, that is just +0.1%, essentially flat, and the January-July cumulative total sits 1.7% below the same period a year earlier. Rather than asserting that “2026 will come in at X million,” this article sets out how far through the year we are, what monthly pace the remaining five months would require, and how many room-nights of demand that headcount converts into — as a calculation anyone can reproduce from public statistics alone. Every figure can be refreshed each month from JNTO’s release and the Japan Tourism Agency’s Overnight Travel Statistics Survey.
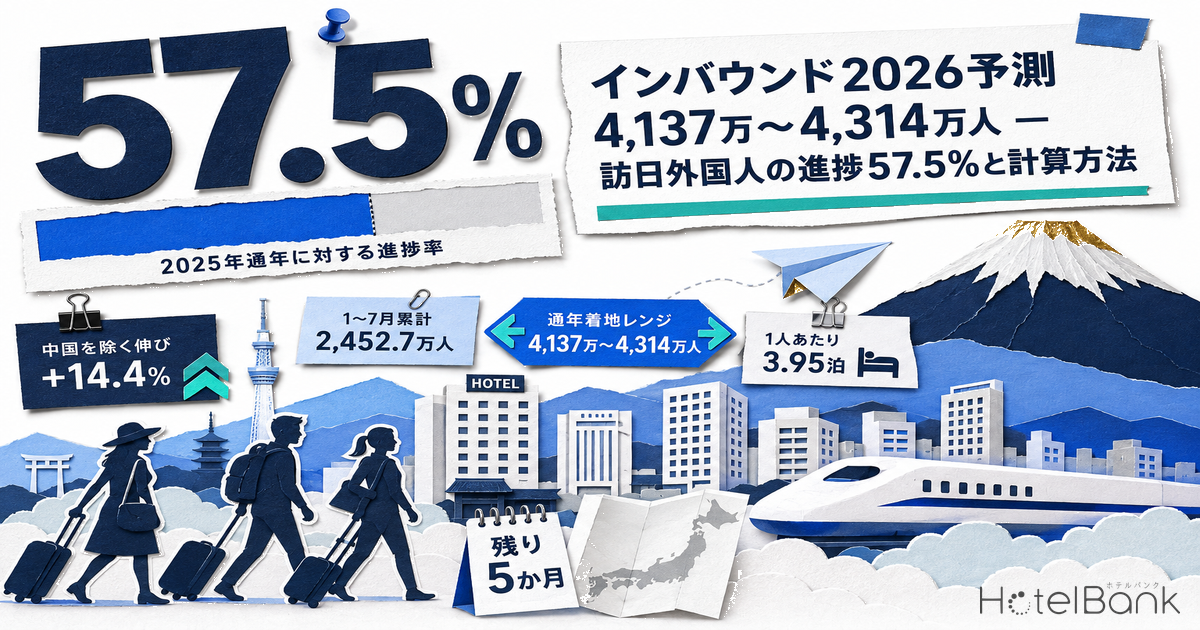
The conclusion first — 2026 inbound progress dashboard (as of July 2026)
| Item | Figure | Source / calculation |
|---|---|---|
| Jan-Jul cumulative foreign visitor arrivals | 24.527 million | JNTO (July is an estimate) |
| Year on year | -1.7% | Jan-Jul 2025: 24.956 million |
| Progress against full-year 2025 | 57.5% | Full-year 2025: 42.683 million |
| Full-year landing range (3 scenarios) | 41.37-43.14 million | Aug-Dec at -5% / +/-0% / +5% YoY |
| Jan-Jul growth excluding China | +14.4% | 22.041 million (19.263 million a year earlier) |
| Nights per visitor | 3.95 nights | JTA foreign guest nights / JNTO arrivals |
| Full-year foreign room demand (flat scenario) | approx. 101 million room-nights | approx. 16% of 617 million room-nights of national supply |
Source: Japan National Tourism Organization (JNTO), “Foreign Visitor Arrivals (July 2026 estimate)”; Japan Tourism Agency, “Overnight Travel Statistics Survey.” Compiled by the HotelBank Editorial Team
Metric Definitions Used in This Article
- Foreign visitor arrivals: an estimate compiled by JNTO from the Ministry of Justice’s Immigration Statistics. It takes lawful foreign entrants, excludes permanent residents and others whose principal country of residence is Japan, and adds shore landings, transit landings and cruise-passenger landings. It includes expatriate workers, students and re-entrants, but excludes crew members.
- Foreign guest nights: total guest nights recorded for guests without a Japanese address in the Japan Tourism Agency’s Overnight Travel Statistics Survey. Because the survey body and the population differ from those behind foreign visitor arrivals, treating the ratio of the two as “nights per visitor” gives an approximation only.
- Room occupancy rate: the figure published in the Japan Tourism Agency’s Overnight Travel Statistics Survey (occupied room-nights / total rooms x days). Every occupancy figure in this article is that published value, not an estimate of ours.
- ADR (average daily rate): an estimated settled rate (tax-excluded equivalent) calculated by applying facility-type correction factors to the lowest published plan level each property lists on OTAs and similar channels (two guests per room, per-room rate, tax included). Cross-checked against property-level actuals disclosed by listed hotel REITs (91 properties, most recent three months), the median error is approximately 7%. These are estimates and differ from each property’s actual transacted prices and accounting figures. Area-level ADR is the median across the properties covered — the level of a typical property in that area.
- Data sources: Japan National Tourism Organization (JNTO); Japan Tourism Agency, “Overnight Travel Statistics Survey”; MetroEngines Research
Note: from the January 2026 survey onward, the Japan Tourism Agency changed the stratification variable in the Overnight Travel Statistics Survey from “number of employees” to “number of rooms.” Year-on-year comparisons may therefore carry some effect from that revision.
- — 57.5% of the way through — foreign visitor arrivals for January-July 2026 came to 24.527 million, or 57.5% of the 42.683 million recorded across all of 2025. Year on year, that is -1.7%.
- — 41.37-43.14 million for the full year — a mechanical range built by setting August-December at -5% / +/-0% / +5% year on year. JTB’s forecast of 41.40 million sits near the bottom of it.
- — China’s -3.206 million is 83.8% offset by +2.687 million across the other 22 markets — excluding China, the January-July total is +14.4%. A flat headline conceals a wholesale change in market mix.
- — 3.95 nights per visitor (4.22 nights across 2025) — the coefficient that converts arrivals into guest nights. Both the change in stratification basis and a mix shift toward shorter-staying markets push it down.
- — Room demand of roughly 101 million room-nights, about 16% of the 617 million room-nights of national supply — even a 1.77 million swing in the landing point moves the national average share by less than 1pt. What matters is not the total but which areas and facility types it lands in.
1. The full-year arithmetic – 57.5% done, and the pace the last five months require
Building a full-year outlook takes nothing more than subtraction and division. Add up what is already confirmed, then set an assumption for the remaining period. That is the whole exercise.
Foreign visitor arrivals for January-July 2026 came to 24,527,200: 3,597,881 in January, 3,466,848 in February, 3,619,159 in March, 3,692,364 in April, 3,560,256 in May, 3,148,600 in June and 3,442,100 in July (July being an estimate). Against 24,955,693 over the same period a year earlier, that is -1.7%.
Next, fix the denominator. Full-year 2025 arrivals were 42,683,301, of which 17,727,608 fell in August-December — a seasonal structure in which 41.5% of the year is concentrated into those five months. January-July 2026’s 24.527 million therefore represents 57.5% progress against the full-year 2025 total.
That much is observed. What remains is entirely a question of what to assume for August-December. Setting a band of +/-5% year on year gives the three scenarios below.
Source: Japan National Tourism Organization (JNTO), “Foreign Visitor Arrivals Statistics.” Compiled by the HotelBank Editorial Team
| Full-year landing | Aug-Dec total | Required monthly average | Year on year | What it represents |
|---|---|---|---|---|
| 41.37 million | 16.841 million | 3.368 million | -5.0% | Soft scenario |
| 41.40 million | 16.873 million | 3.375 million | -4.8% | JTB forecast (published 8 January 2026) |
| 42.00 million | 17.473 million | 3.495 million | -1.4% | Round-number threshold |
| 42.25 million | 17.728 million | 3.546 million | +/-0.0% | Flat scenario (base case) |
| 42.68 million | 18.156 million | 3.631 million | +2.4% | Level with 2025 (the line for a new record) |
| 43.14 million | 18.614 million | 3.723 million | +5.0% | Upside scenario |
| 44.00 million | 19.473 million | 3.895 million | +9.8% | Strong upside (would need a real tailwind) |
Source: Japan National Tourism Organization (JNTO), “Foreign Visitor Arrivals Statistics”; JTB Corp., “2026 (January-December) Inbound Travel Market Trend Forecast” (8 January 2026). Compiled by the HotelBank Editorial Team
Using the table is simple. Each month, when JNTO publishes the single-month figure, check which “required monthly average” line that month’s actual cleared. As August, September and October accumulate, the range narrows quickly; by the October release covering September, the landing point is broadly settled.
For reference, JTB Corp.’s outlook published on 8 January 2026 forecasts 41.40 million for the full year (97.2% of the prior year) and spending of ¥9.64 trillion (100.6%). The shape of it: softer demand from China and Hong Kong leaves headcount marginally below the prior year, while growth in the longer-staying Western and Australian markets lifts spending above it. Progress as of end-July sits broadly consistent with that forecast.
The distance to the government’s target is worth noting as well. The 5th Basic Plan for Promoting a Tourism-Oriented Country, approved by the Cabinet on 27 March 2026, sets out 60 million foreign visitors and ¥15 trillion in travel spending by 2030. If 2026 lands flat at 42.25 million, reaching that would require 9.2% annual growth over the following four years. On the soft 41.37 million landing, the requirement is 9.7% a year. (Both growth rates are HotelBank Editorial Team calculations.)
2. Contribution by market – who filled China’s -3.2 million, and by how much
The January-July 2026 total is -1.7%, but that number is the residue of market-level moves cancelling each other out. Broken apart, the picture changes.
China first. The January-July cumulative total was 2,486,500, down 56.3% year on year — a negative contribution of 3,206,000 visitors in absolute terms. July alone came to 428,200 (-56.1%), still running at less than half the prior-year level.
The gains, meanwhile, are substantial. Of the 23 major markets, all 22 other than China grew, adding 2,687,000 visitors between them — enough to fill 83.8% of China’s decline. South Korea (6,569,800, +20.3%, +1,108,000) and Taiwan (4,736,000, +21.8%, +847,000) led the way, and those two markets alone offset 61% of the China shortfall. In July alone, Taiwan reached 763,800, clearing 700,000 in a single month for the first time, while South Korea’s 894,700 (+31.9%) was a record high for the month of July.
The result: excluding China, the January-July total was 22,040,700, up 14.4% year on year. In other words, 2026 is not a “contracting market.” It is a test of whether +14.4% combined growth across 22 markets can fully absorb the adjustment in one very large one. Whether you read the full-year outlook with that structure in mind makes a considerable difference.
Source: Japan National Tourism Organization (JNTO), “Foreign Visitor Arrivals Statistics.” Compiled by the HotelBank Editorial Team (January-July 2026 cumulative; July is an estimate)
| Market | Jan-Jul 2026 | Jan-Jul 2025 | Change (visitors) | Year on year |
|---|---|---|---|---|
| South Korea | 6,569,800 | 5,462,088 | +1,107,712 | +20.3% |
| Taiwan | 4,736,000 | 3,888,980 | +847,020 | +21.8% |
| United States | 2,107,900 | 1,978,506 | +129,394 | +6.5% |
| Hong Kong | 1,571,000 | 1,447,126 | +123,874 | +8.6% |
| Malaysia | 395,100 | 342,078 | +53,022 | +15.5% |
| Indonesia | 418,700 | 373,572 | +45,128 | +12.1% |
| India | 230,600 | 189,420 | +41,180 | +21.7% |
| Singapore | 407,400 | 369,457 | +37,943 | +10.3% |
| Canada | 419,000 | 387,497 | +31,503 | +8.1% |
| Vietnam | 448,700 | 418,173 | +30,527 | +7.3% |
| China | 2,486,500 | 5,692,537 | -3,206,037 | -56.3% |
| Total | 24,527,200 | 24,955,693 | -428,493 | -1.7% |
Prior-year figures are derived from JNTO’s published cumulative totals and year-on-year growth rates. Source: Japan National Tourism Organization (JNTO), “Foreign Visitor Arrivals Statistics.” Compiled by the HotelBank Editorial Team
The operational point is that a change in market mix changes the character of lodging demand. South Korea and Taiwan are short-haul, high-frequency, short-stay markets with a high share of repeat visitors. The room types, stay lengths and booking lead times they need differ from the group and shopping-led demand that came from China. Even with total headcount flat, the booking profile a property sees is not the same one it saw a year ago. Notably, city-level measurements taken while Chinese demand was running at roughly half the prior year still showed ADR rising in Tokyo and Kyoto — substitution demand can hold rates up even as one source market halves.
3. Converting arrivals into guest nights – 3.95 nights per visitor in 2026
Foreign visitor arrivals are a count of entrants, not a metric that maps directly onto accommodation revenue. Converting it into lodging demand requires a coefficient: how many nights per visitor actually land in accommodation. That is obtained by dividing foreign guest nights from the Japan Tourism Agency’s Overnight Travel Statistics Survey by JNTO’s arrivals figure.
Foreign guest nights for January-July 2026 totalled 96,817,900 (January-June are second preliminary values, July is a first preliminary value). Divided by the 24,527,200 arrivals over the same period, that gives 3.95 nights per visitor. By month: 3.57 in January, 4.05 in February, 3.95 in March, 4.16 in April, 4.07 in May, 3.88 in June and 3.94 in July — peaking in April and otherwise moving within a 3.6-4.2 night range.
That coefficient is lower than a year ago. Across 2025 it was 179.92 million foreign guest nights divided by 42,683,301 arrivals, or 4.22 nights per visitor — a decline of 0.27 nights.
Reading that entire gap as a change in underlying behaviour would be premature, however. From the January 2026 survey onward the Japan Tourism Agency changed the stratification variable from “number of employees” to “number of rooms,” so a simple year-on-year comparison may carry some effect from that revision. On top of that, the mix shift works in the same direction: longer-staying group demand from China fell away while shorter-staying South Korea and Taiwan grew as a share. The market rotation described in section 2 most likely shows up directly in this coefficient.
For a full-year conversion, then, the sensible approach is a band centred on 3.95 nights (measured in 2026) with 4.22 nights (the 2025 actual) as the upper bound. Applying 3.95 nights to the flat scenario of 42.25 million gives 167 million guest nights; at 4.22 nights it gives 178 million.
Source: Japan National Tourism Organization (JNTO), “Foreign Visitor Arrivals Statistics”; Japan Tourism Agency, “Overnight Travel Statistics Survey.” Compiled by the HotelBank Editorial Team
4. Converting to room demand – what share of Japan’s 1.69 million rooms inbound takes
Turning guest nights into room demand takes one more conversion: how many guests occupy each room.
The July 2026 figures (first preliminary) from the Overnight Travel Statistics Survey let that coefficient be calculated directly. Guest nights that month were 54,671,130 against 31,930,050 occupied room-nights, giving 1.71 guests per room. June (second preliminary) was 45,815,140 guest nights over 28,826,670 occupied room-nights, or 1.59 — more guests per room in leisure-season July, as expected.
The same statistics also allow national room stock to be worked back. Dividing July’s 31,930,050 occupied room-nights by the 60.8% room occupancy rate (July 2026, published first preliminary value from the Japan Tourism Agency’s Overnight Travel Statistics Survey) and by 31 days gives a national total of roughly 1.69 million rooms. The same calculation on June (28,826,670 occupied room-nights, a 57.2% occupancy rate from the same survey’s second preliminary values, 30 days) gives roughly 1.68 million — near-identical across the two months.
For reference, of the roughly 168,000 domestic properties MetroEngines Research tracks, about 27,000 with roughly 1.26 million rooms have operation confirmed through OTA and similar listings. That is about 75% of the 1.69 million on the Japan Tourism Agency basis. The gap covers ryokan, minshuku and simple lodgings that do not list on OTAs, plus properties working mainly on group and corporate contracts.
Combining these gives the share of room demand attributable to inbound. July 2026’s 13,575,980 foreign guest nights divided by 1.71 guests per room comes to roughly 7.93 million room-nights — 24.8% of that month’s 31,930,050 occupied room-nights, and 15.1% of total supplied room-nights (1.69 million rooms x 31 days = 52.52 million). The same calculation for June gives 26.7% of occupied room-nights and 15.3% of total supply: a stable level.
| Full-year landing | 3.95 nights/visitor | 4.10 nights/visitor | 4.22 nights/visitor |
|---|---|---|---|
| Soft: 41.37 million | 99.0 million room-nights (16.1%) | 102.8 million room-nights (16.7%) | 105.8 million room-nights (17.2%) |
| Flat: 42.25 million | 101.2 million room-nights (16.4%) | 105.0 million room-nights (17.0%) | 108.1 million room-nights (17.5%) |
| Upside: 43.14 million | 103.3 million room-nights (16.7%) | 107.2 million room-nights (17.4%) | 110.3 million room-nights (17.9%) |
Figures in brackets are the share of total supplied room-nights nationwide (1.69 million rooms x 365 days = 616.85 million room-nights). At 1.60 guests per room the share rises by about 0.5pt; at 1.80 it falls by about 1.4pt. Source: Japan National Tourism Organization (JNTO); Japan Tourism Agency, “Overnight Travel Statistics Survey.” Compiled by the HotelBank Editorial Team
Source: Japan Tourism Agency, “Overnight Travel Statistics Survey” (June 2026 second preliminary, July 2026 first preliminary). Compiled by the HotelBank Editorial Team
To summarise: inbound consumes roughly one sixth of national room supply, or about a quarter if you count only occupied rooms. What makes that 16% figure useful is that whether the year lands at 41.37 million or 43.14 million, the national-average share of room demand moves only within 16.1-16.7%. At the national macro level, a 1.77 million difference in the landing point is worth less than 1pt of occupancy.
Put differently, for any individual property which areas and facility types the demand lands in matters more than where the full-year total settles. The next section looks at that distribution.
5. Where the demand lands – regional areas at 35.8%, and the gap to the 130 million target
Breaking the 83,241,920 foreign guest nights recorded in January-June 2026 down by prefecture shows sharp concentration at the top. Tokyo took 27,041,700 (32.5%), Osaka 11,158,570 (13.4%) and Kyoto 7,573,550 (9.1%) — 55.0% across those three alone. Hokkaido follows with 6,273,340 (7.5%), then Fukuoka with 4,136,630 (5.0%) and Okinawa with 3,945,380 (4.7%).
The three major metropolitan areas — the eight prefectures of Tokyo, Kanagawa, Chiba, Saitama, Aichi, Osaka, Kyoto and Hyogo — total 53,469,060 guest nights, or 64.2%. The remaining 39 prefectures, the “regional areas,” account for 29,772,860, or 35.8%. Across 2025 the regional figure was 60,562,510 guest nights at 33.7%, so the regional share has edged up.
This is where the distance to the government’s target becomes the issue. The 5th Basic Plan for Promoting a Tourism-Oriented Country sets a 2030 goal of 130 million foreign guest nights in regional areas, bringing them to a 1:1 ratio with the three major metropolitan areas. From the 60.56 million recorded in 2025, that requires a 2.15x expansion — around 21% annual growth over four years. Holding nights per visitor constant, regional areas and the three major metropolitan areas would together come to 260 million guest nights, which is close to 60 million visitors multiplied by 4.3 nights each. Read that way, the internal consistency of the government’s target assumes nights per visitor holds at around 4.3.
Which is why the drop to 3.95 nights described in section 3 means more than a rounding difference. Even if headcount reaches 60 million, nights per visitor stuck at 3.95 would produce 237 million guest nights — about 9% short of the 260 million target. The headcount target and the guest-night target will not necessarily be met together, and that is a point anyone planning supply should register. The mismatch between regional room stock and regional lodging share, and the growth rate the 130 million target implies, are analysed in detail in Regional Japan: 61.7% of Rooms, 33.7% of Inbound Nights, 16.5% Growth.
Source: Japan Tourism Agency, “Overnight Travel Statistics Survey” trend workbook (January-June 2026). Compiled by the HotelBank Editorial Team
It is worth sizing the room demand that 60 million visitors at 4.0 nights each in 2030 would create. Dividing 240 million guest nights by 1.65 guests per room gives roughly 145 million room-nights — 44 million room-nights more than the 2026 flat scenario of about 101.2 million. Absorbing that at a 60% room occupancy rate (an assumed full-year average) would take roughly 200,000 additional rooms; at 70%, roughly 170,000. Against the current national stock of about 1.69 million rooms, that is an increase of more than 10%.
6. Flat headcount, moving rates – summer 2026 from the property side
Everything so far has concerned demand volume as measured by public statistics. It is worth closing on how that shows up in prices at the property level, because headcount and rate do not necessarily move in the same direction.
MetroEngines Research data puts estimated settled ADR for July 2026 in Tokyo at approximately ¥12,600 (N=1,136 properties), down 4.8% from around ¥13,300 a year earlier. Kyoto came in at approximately ¥12,200 (N=604), down 12.8% year on year, and Osaka at approximately ¥8,800 (N=647), down 30.7%. Much of the Osaka gap reflects how far Expo 2025 Osaka, Kansai — held from April to October 2025 — lifted the prior-year base.
Even in a month that set a July record for arrivals, area-level rates can sit below the prior year. That is precisely why tracking headcount alone opens a gap against what properties actually feel in revenue. Macro headcount, guest nights and area-level rates each carry different information. As section 4 showed, the national-average demand share barely moves between landing scenarios, so differences between properties are driven far more by area and facility-type mix — and by what happened in the base year. How far growth in arrivals actually passes through into rates is a separate question, and one that resolves differently by facility type and area: in past periods the gains have concentrated in regional ryokan and resorts rather than in the large urban markets.
7. Updating it each month – just swap in three numbers
Every calculation in this article can be brought up to date each month by swapping in the three published figures below. No special data is required.
| What to update | Source | Release timing | How to use it |
|---|---|---|---|
| Single-month foreign visitor arrivals | JNTO, “Foreign Visitor Arrivals” | Mid to late the following month | Add to the cumulative total and compare against the “required monthly average” in Table 1 |
| Foreign guest nights | Japan Tourism Agency, “Overnight Travel Statistics Survey” | About two months in arrears (first preliminary) | Divide by arrivals to refresh nights per visitor |
| Occupied room-nights and room occupancy rate | Same source (Tables 3 and 5) | Same as above | Guest nights / occupied room-nights refreshes guests per room; occupied room-nights / occupancy rate / days refreshes total room count |
Source: Japan National Tourism Organization (JNTO); Japan Tourism Agency, “Overnight Travel Statistics Survey.” Compiled by the HotelBank Editorial Team
Two cautions. First, the Japan Tourism Agency’s statistics come as first preliminary, second preliminary and final values, and are revised after the fact — reading a several-month moving average is more stable than reacting to small single-month moves. Second, because the stratification variable changed with the January 2026 survey, comparisons against 2025 and earlier may carry some effect from that revision; it is worth footnoting whenever year-on-year figures are discussed.
Conclusion – how to read Japan’s 2026 inbound numbers
The facts as of end-July 2026 come down to these five points.
| Question | The answer as of end-July 2026 |
|---|---|
| Progress | 24.527 million cumulative January-July, -1.7% year on year; 57.5% of the full-year 2025 total. |
| Landing range | 41.37-43.14 million if August-December runs +/-5% year on year. Matching 2025’s 42.68 million would need +2.4% over August-December. |
| Structure | China is down 3.206 million. Gains of 2.687 million across the other 22 markets offset 83.8% of that. Excluding China, +14.4%. |
| Lodging conversion | 3.95 nights per visitor (4.22 across 2025). A flat landing gives 167 million guest nights for the year. |
| Room demand | Roughly 101 million room-nights, about 16% of the 617 million room-nights of national supply. A 1.77 million swing in the landing point moves the national-average share by less than 1pt. |
In aggregate, 2026 looks likely to land at roughly the same level as 2025. The composition, though, is moving on every axis: market mix, length of stay and geographic distribution. Being able to work out for yourself how many room-nights a given headcount becomes, and where those land, is more useful in day-to-day operations and supply planning than guessing the headline number. All three coefficients used here — nights per visitor, guests per room and total room count — can be refreshed every month from published Japan Tourism Agency figures.
⚠ On the scenario calculations in this article: the full-year landing range is a mechanical calculation that assumes August-December 2026 arrivals run at -5% / +/-0% / +5% year on year. It is not a forecast. Actual results may vary substantially with exchange rates, airline seat supply, travel conditions in each market, natural disasters and other factors. July arrivals and the Japan Tourism Agency’s preliminary values are both subject to later revision. Guests per room is an all-property average rather than a figure limited to foreign guests, so the conversion into room demand is an approximation.
Related reading
- Japan Inbound July 2026: 3.44M Arrivals, 41.7-42.8M Full-Year Range (the monthly news coverage of the July figures)
- Regional Japan: 61.7% of Rooms, 33.7% of Inbound Nights, 16.5% Growth
- Inbound Stay Length Varies 2.0x: Tokyo 2.32 vs Yamanashi 1.16 Nights
- City Hotels: 45.9% of Guest Nights Are Foreign – Ryokan +3.7%
- Only 6 of 47 Prefectures Peak in Autumn: Japan’s Inbound Share Map
References and sources
Data sources
Foreign visitor arrivals are monthly estimates from the Japan National Tourism Organization (JNTO), “Foreign Visitor Arrivals Statistics” (July 2026 is an estimate). Guest nights, occupied room-nights and room occupancy rates come from the Japan Tourism Agency’s “Overnight Travel Statistics Survey” (June 2026 second preliminary, July 2026 first preliminary; prefecture-level figures from the January-June 2026 trend workbook). The full-year outlook reference is JTB Corp., “2026 Inbound Travel Market Trend Forecast” (8 January 2026). Area-level estimated settled ADR is from MetroEngines Research (July 2026; Tokyo N=1,136 properties, Kyoto N=604, Osaka N=647).
Calculation assumptions
The full-year landing range is built up assuming August-December 2026 arrivals run at -5% / +/-0% / +5% year on year. The conversion coefficient into guest nights uses a band centred on 3.95 nights per visitor (measured January-July 2026) with 4.22 nights per visitor (the full-year 2025 actual) as the upper bound. The conversion into room-nights uses 1.65 guests per room (midway between 1.59 in June 2026 and 1.71 in July), with the 1.60 and 1.80 sensitivities shown alongside. Total national room count is roughly 1.69 million, worked back as occupied room-nights / room occupancy rate / days; total supplied room-nights is 1.69 million rooms x 365 days = 616.85 million. All annual growth rates are Editorial Team calculations.
Limitations and caveats
The landing range is a mechanical calculation resting on assumptions, not a forecast. Actual results may vary substantially with exchange rates, airline seat supply, travel conditions in each market and natural disasters. Both JNTO’s arrival estimates and the Japan Tourism Agency’s preliminary values are revised after the fact. From the January 2026 survey onward the Japan Tourism Agency changed the stratification variable from “number of employees” to “number of rooms,” so year-on-year figures may carry some effect from that revision. Because the survey body and population behind foreign visitor arrivals and foreign guest nights differ, “nights per visitor” is an approximation. Guests per room is an all-property average rather than a figure limited to foreign guests, so the conversion into room demand is likewise approximate. Estimated settled ADR is an estimate derived from published prices and differs from each property’s actual transacted prices and accounting figures.
Foreign visitor arrivals
- Japan National Tourism Organization (JNTO), “Foreign Visitor Arrivals (July 2026 estimate)” (19 August 2026)
- Japan National Tourism Organization (JNTO), “Foreign Visitor Arrivals Statistics” – monthly estimates and arrivals by nationality and month (2003-2026)
Lodging statistics
- Japan Tourism Agency, “Overnight Travel Statistics Survey” – July 2026 (first preliminary) results, June 2026 (second preliminary) results, and trend workbook
- Japan Tourism Agency, “On the Change to the Stratification Basis of the Overnight Travel Statistics Survey” (applied from the January 2026 survey)
Government plans and private-sector outlooks
- Japan Tourism Agency, “Basic Plan for Promoting a Tourism-Oriented Country” (5th; approved by the Cabinet on 27 March 2026)
- Japan Tourism Agency, “Basic Plan for Promoting a Tourism-Oriented Country – Summary” (5th)
- JTB Corp., “2026 (January-December) Inbound Travel Market Trend Forecast” (8 January 2026)
Price data
- MetroEngines Research – estimated settled ADR (Tokyo N=1,136 properties, Kyoto N=604, Osaka N=647; July 2026) and reference figures for domestic room stock