

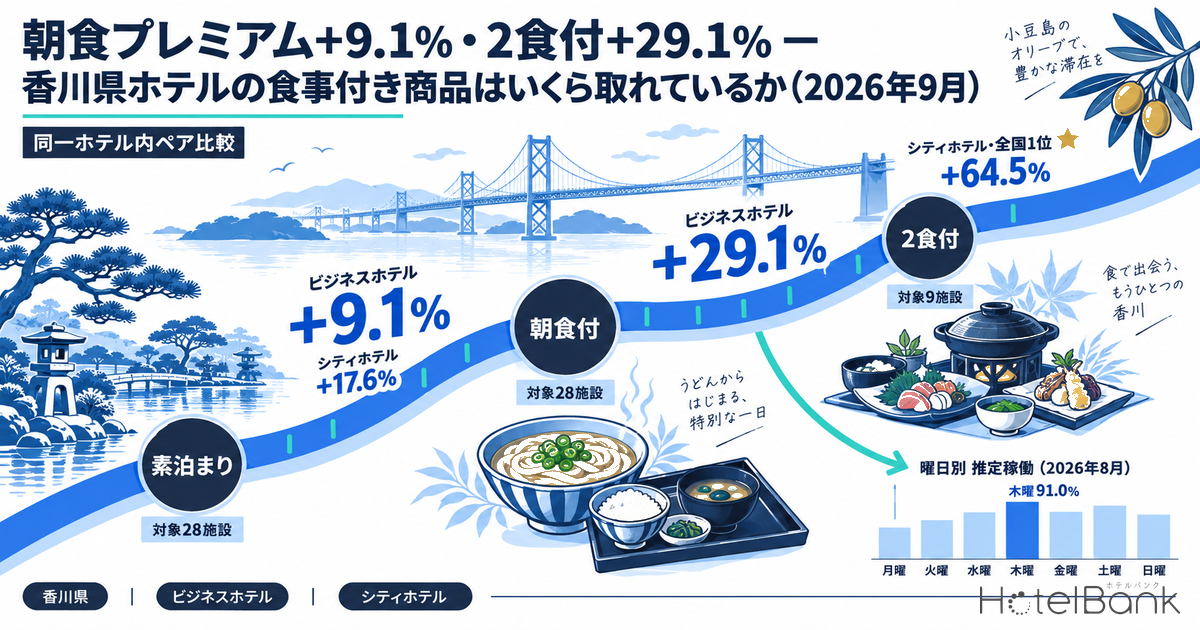
At business hotels in Kagawa Prefecture, the gap between breakfast-included plans and room-only plans was +9.1% (a difference of roughly ¥1,400, 28 properties), while the gap between half-board (two meals) and breakfast-only was +29.1% (9 properties) for September 2026 stays. At city hotels, the breakfast-versus-room-only gap reached +17.6% (9 properties), roughly double the business-hotel figure. Every one of these numbers is a within-hotel comparison — the same property, with only the meal condition differing — so price gaps between properties and differences in grade are excluded by construction. Pricing for meal-inclusive products tends to sit untouched at “cost plus a margin,” but leaving it there without knowing what premium the market is actually paying is a quiet form of leakage. This article breaks down Kagawa’s meal premium structure by segment and by month, then layers on the seasonal shape of settled ADR and day-of-week estimated occupancy, so the findings translate into product design decisions from September onward.
Scope: business hotels and city hotels in Kagawa Prefecture. Meal premiums are within-hotel pair comparisons, N=5–50 properties (noted alongside each figure); settled ADR estimates cover N=90 business hotels and N=10–11 city hotels; estimated occupancy covers N=42 business hotels. The price metric used throughout is settled ADR estimate (the transaction price level estimated from OTA and other sales data, tax-exclusive equivalent); occupancy is an estimate based on OTA-listed inventory. Full definitions appear at the end of the article. Data as of September 10, 2026.
- — +9.1% (28 properties) — the within-hotel gap between breakfast-included and room-only plans at Kagawa business hotels. That ranks 28th among Japan’s 47 prefectures, marginally below the national median of 10.0% — an average showing.
- — +29.1% (9 properties) — the gap between half-board and breakfast-only. Dinner commands roughly three times what breakfast does, yet few properties in the prefecture have productized it.
- — +64.5% (5 properties) — the city-hotel gap between half-board and breakfast-only ranks 1st among the 35 prefectures with sufficient sample. The small property count calls for a discount in how firmly this is read.
- — +1.7% year on year — settled ADR estimate at business hotels averaged ¥7,300 over January–August 2026 (N=90 properties). The price base has not moved; the upside sits on the product-mix side.
- — Thursday 91.0%, Sunday 76.0% — estimated occupancy for August 2026 (42 properties). Demand peaks midweek rather than at the weekend, which is worth checking against how breakfast service is staffed.
Within a single hotel, the meal gap shows up this clearly
The worst way to measure a meal premium is to line up “the average of properties selling breakfast-included plans” against “the average of properties selling room-only plans.” The former skews toward properties strong on food and the latter toward price-led properties, so the gap between them reflects the mix of properties rather than the value of the meal. The method used here is different: only properties that sell both room-only and breakfast-included (or half-board) plans are extracted, and the gap is computed within each property before being aggregated. Because the property is held fixed, location, building age and room grade are automatically controlled for. Ryokan are excluded from the aggregation, since meals are standard in their core product and no meaningful “versus room-only” contrast exists.
Results for September 2026 stays appear in the chart below, and the size of the gap splits clearly by segment. The breakfast premium is +9.1% at business hotels (28 properties) and +17.6% at city hotels (9 properties). In absolute yen rather than percentages, that is roughly ¥1,400 for business hotels against roughly ¥3,700 for city hotels — a 2.6x spread. What is in the product itself (buffet breadth, full restaurant service versus a simplified offering) is being reflected in the price difference.
Dinner is the larger lever. Even at business hotels, the gap between half-board and breakfast-only is +29.1% (9 properties, roughly ¥4,400), rising to +36.8% against room-only (9 properties). At city hotels the half-board-versus-breakfast gap jumps to +64.5% (5 properties), so across segments dinner commands roughly three times the uplift that breakfast does. Taking all segments together (excluding ryokan), half-board versus room-only came to +44.1% (27 properties) and dinner-only versus room-only to +50.5% (8 properties).
Source: MetroEngines Research; compiled by the HotelBank Editorial Team
* Each figure is the gap between products differing only in meal condition within the same hotel, and does not indicate a price level (ADR). For levels, see the settled ADR estimates later in this article. Combinations with fewer than 5 properties are not shown.
The breakfast premium has been flat for five months; city hotels are narrowing
Does the gap move with the season? Lining up the five months from May to September 2026 reveals different behavior by segment. The business-hotel breakfast premium has moved within a range of 8.1–10.5%, or a narrow band of ¥1,300–¥1,600 in absolute terms. That the breakfast gap barely moves in strong and weak demand months alike suggests that many properties set the breakfast charge as a fixed value and flex only the room-only price with demand.
City hotels, by contrast, narrowed from +24.2% in May to +17.6% in September. In yen the gap shrank from roughly ¥5,200 to roughly ¥3,700. When the room-only price moves while the absolute breakfast charge stays put, the percentage thins out automatically. The September level sits 6.6 points below May.
| Stay month | Business: breakfast premium | Difference | City: breakfast premium | Difference | All segments |
|---|---|---|---|---|---|
| May 2026 | +10.5% (N=27) | ¥1,590 | +24.2% (N=8) | ¥5,171 | +11.2% (N=46) |
| June 2026 | +9.2% (N=28) | ¥1,321 | +21.8% (N=9) | ¥4,168 | +7.1% (N=50) |
| July 2026 | +9.6% (N=28) | ¥1,458 | +19.2% (N=9) | ¥4,101 | +5.6% (N=50) |
| August 2026 | +8.1% (N=28) | ¥1,424 | +17.5% (N=9) | ¥4,273 | +7.2% (N=50) |
| September 2026 | +9.1% (N=28) | ¥1,395 | +17.6% (N=9) | ¥3,678 | +7.3% (N=50) |
Source: MetroEngines Research; compiled by the HotelBank Editorial Team (breakfast-included vs. room-only; within-hotel pair comparison; ryokan excluded)
Drilling down to the municipal level, the prefectural capital is somewhat stronger. The breakfast premium at business hotels in Takamatsu City is +12.7% (18 properties), 3.6 points above the prefecture as a whole (+9.1%); city hotels there came to +19.8% (5 properties) and all segments to +14.8% (23 properties). Where business demand is thick and more guests choose breakfast as a way of buying back time the next morning, the gap appears easier to capture.
Where Kagawa sits nationally — average on breakfast, top of the table on city-hotel dinner
Applying the same method across all of Japan’s prefectures pins down Kagawa’s position. The table below covers September 2026 stays for prefectures with at least 5 qualifying properties. The business-hotel breakfast gap of +9.1% ranks 28th of 47 prefectures, marginally below the national median of 10.0%. It is neither an outlier nor a clear case of money left on the table — it sits in the average band.
The city-hotel half-board gap tells a different story: +64.5% ranks 1st among the 35 prefectures with sufficient sample, 25.1 points above the national median of 39.4%. That said, only 5 properties in the prefecture qualified, a scale at which the product mix of a handful of hotels moves the whole figure, so it warrants a discount in the reading. Even so, the direction — that dinner-inclusive products sell at relatively high prices at Kagawa’s city hotels — is consistent with a separate cut of the prefecture’s data (half-board versus room-only, +83.6%).
| Segment | Comparison | Kagawa | Difference | Properties | National rank | National median | vs. median |
|---|---|---|---|---|---|---|---|
| Business hotel | Breakfast vs. room-only | +9.1% | ¥1,395 | 28 | 28th / 47 | 10.0% | −0.9pt |
| Business hotel | Half-board vs. breakfast | +29.1% | ¥4,395 | 9 | 20th / 47 | 27.3% | +1.8pt |
| City hotel | Breakfast vs. room-only | +17.6% | ¥3,678 | 9 | 14th / 44 | 15.5% | +2.1pt |
| City hotel | Half-board vs. breakfast | +64.5% | ¥14,991 | 5 | 1st / 35 | 39.4% | +25.1pt |
Source: MetroEngines Research; compiled by the HotelBank Editorial Team
* The denominator of the rank differs by comparison because prefectures with fewer than 5 qualifying properties are excluded. Fewer properties productize half-board than breakfast, so fewer prefectures can be aggregated for those cuts.
Setting the four Shikoku prefectures side by side makes the differences in product design more concrete. On the business-hotel breakfast gap, Kochi stands apart at +14.7% (35 properties), while Kagawa, Tokushima and Ehime cluster in the 7–9% range. On half-board, the order reverses: Tokushima at +45.7% and Kochi at +49.5% both exceed Kagawa’s +29.1%, putting Kagawa on the conservative side of the dinner uplift. That is one basis for reading room to productize dinner-inclusive plans within the prefecture.
| Prefecture | Business Breakfast vs. room-only | Business Half-board vs. breakfast |
City Breakfast vs. room-only | City Half-board vs. breakfast |
|---|---|---|---|---|
| Kagawa | +9.1% (28) | +29.1% (9) | +17.6% (9) | +64.5% (5) |
| Tokushima | +8.2% (25) | +45.7% (6) | +8.3% (8) | +24.2% (7) |
| Ehime | +7.6% (38) | +27.5% (13) | +14.9% (18) | +40.7% (9) |
| Kochi | +14.7% (35) | +49.5% (13) | +12.9% (6) | Fewer than 5 properties |
Source: MetroEngines Research; compiled by the HotelBank Editorial Team
* Combinations with fewer than 5 qualifying properties are not shown. Because the size and location mix of qualifying properties differs by prefecture, a difference in percentage does not directly translate into a difference in product strength.
The price level itself is flat year on year — the seasonal shape of settled ADR
Thinking about how to move the meal gap calls for a look at the underlying price level too. The settled ADR estimate for Kagawa’s business hotels (confirmed figures) averaged ¥7,300 over January–August 2026, up 1.7% year on year (N=90 properties). By month, January rose sharply at +25.2%, while summer came in below the prior year at −7.5% in July and −3.1% in August. City hotels averaged ¥8,500 over January–August, down 1.3% year on year (N=10 properties), with August well below the prior-year level (−23.3%; prior-year N=10 properties). For the tiers of pricing across the prefecture’s municipalities, see Kagawa’s 16 Municipalities: 9.4x ADR Gap and Four Autumn Price Tiers.
The annual shape worth holding onto is this: confirmed figures for business hotels peak in March, May and August, with a trough in June (¥6,500 in June 2026). June 2026 was down just 0.9% year on year — essentially flat — so the trough is a recurring seasonal feature rather than a single-year fluctuation. From September onward the figures are estimates based on current sales conditions, but they point to ¥9,500 in September, ¥9,600 in October and ¥9,600 in November (N=84–90 properties in each case), running above the confirmed levels. These numbers will shift with sales activity from here, and a direct comparison against confirmed figures has to wait for month-end confirmation.
Source: MetroEngines Research; compiled by the HotelBank Editorial Team
Breakfast operations carry a different load by day of week — estimated occupancy in August
Whether to push harder on meal-inclusive products is a question of service capacity as much as price. To that end, estimated occupancy for Kagawa’s business hotels in August 2026, the most recent completed month (OTA-listed-inventory basis; 42 properties / 2,995 rooms, as listed on major booking sites), was aggregated by day of week. The monthly average was 82.9%, with the high at 91.0% on Thursday and the low at 76.0% on Sunday — a spread of 15.0 points.
The midweek thickness of Tuesday 85.3%, Wednesday 86.5% and Thursday 91.0% is the shape of weekday business travel demand. Saturday came in at 84.8%, below midweek, so even in August — peak leisure season — the peak was midweek. Any property staffing its breakfast room and shift roster on a “heavier at weekends” assumption may be out of step with the actual distribution of room nights. The single highest day was August 13 at 97.7%, the day Obon homecoming demand bit hardest.
Source: MetroEngines Research; compiled by the HotelBank Editorial Team
Applying it to your own numbers — a room-only rate × premium quick-reference grid
The gaps so far are observed values for the prefecture as a whole, so translating them to a single property means multiplying them by that property’s room-only rate. The table below puts your own room-only rate on the vertical axis and the observed premium on the horizontal axis, with the resulting breakfast-included rate and the difference in each cell. The prefecture’s business-hotel room-only average is ¥15,414 (stays September 2026, 28 properties), so that row sits closest to the prefectural norm.
| Room-only rate | +5.0% Conservative |
+9.1% Kagawa business |
+12.7% Takamatsu City |
+17.6% Kagawa city hotels |
+22.9% National high |
|---|---|---|---|---|---|
| ¥12,000 | ¥12,600 +¥600 | ¥13,092 +¥1,092 | ¥13,524 +¥1,524 | ¥14,112 +¥2,112 | ¥14,748 +¥2,748 |
| ¥14,000 | ¥14,700 +¥700 | ¥15,274 +¥1,274 | ¥15,778 +¥1,778 | ¥16,464 +¥2,464 | ¥17,206 +¥3,206 |
| ¥15,414 Prefecture avg | ¥16,185 +¥771 | ¥16,817 +¥1,403 | ¥17,372 +¥1,958 | ¥18,127 +¥2,713 | ¥18,944 +¥3,530 |
| ¥17,000 | ¥17,850 +¥850 | ¥18,547 +¥1,547 | ¥19,159 +¥2,159 | ¥19,992 +¥2,992 | ¥20,893 +¥3,893 |
| ¥20,000 | ¥21,000 +¥1,000 | ¥21,820 +¥1,820 | ¥22,540 +¥2,540 | ¥23,520 +¥3,520 | ¥24,580 +¥4,580 |
Source: MetroEngines Research; compiled by the HotelBank Editorial Team
* The percentages on the horizontal axis are values observed in within-hotel pair comparisons (+22.9% was the highest business-hotel figure for September 2026 stays, recorded in Nara Prefecture, 14 properties). They do not indicate an appropriate level for any individual property; the table is a reference for checking where a given setting sits within the observed market range.
Reading it is straightforward: check which column your own “breakfast-included rate minus room-only rate” falls into. A property with a room-only rate of ¥15,414 charging +¥1,403 (+9.1%) for breakfast sits at the prefectural midpoint; at +¥771 (+5.0%) it is capturing roughly ¥630 per night less than the prefectural average. At 82.9% occupancy (August 2026, 42 properties) over 30 days, that difference works out to the high single-digit millions of yen per month for a 100-room property.
For properties considering half-board, the observed range within the prefecture adds a further +29.1% (business hotels, 9 properties) on top of the breakfast-included rate. A property at ¥15,414 room-only and ¥16,817 breakfast-included would land around ¥21,700 for half-board, a gap of roughly ¥4,900 over breakfast-only. Whether that gap exceeds the incremental food cost and service labor for one dinner is the axis on which productization turns.
For revenue managers running business and city hotels in Kagawa — implications and an action plan
(1) Is your breakfast charge inside or outside the gap the market is actually paying? The observed breakfast gap at Kagawa business hotels is +9.1%, roughly ¥1,400 (28 properties), rising to +12.7% within Takamatsu City (18 properties). If your own room-only-to-breakfast spread sits well below that, you may not be reaching the level the market accepts. If it sits well above, it is worth checking take-up rates to confirm that the content of the breakfast justifies the gap.
(2) Is “fixed-charge” breakfast pricing thinning your percentage? The business-hotel gap has held in a narrow ¥1,300–¥1,600 band over five months, while city hotels narrowed from +24.2% in May to +17.6% in September. Move only the room-only price and leave the breakfast charge fixed, and the relative value of breakfast thins out most in peak periods. Whether to hold breakfast as a flat add-on or link it to the rate band is a design decision worth making deliberately.
(3) The larger upside is dinner, not breakfast. Even at business hotels, the gap between half-board and breakfast-only is +29.1%, roughly ¥4,400 (9 properties); at city hotels it is +64.5% (5 properties). But only 9 and 5 properties respectively qualified, so few properties in the prefecture have productized dinner. For properties that can staff the service, this is worth weighing as rate upside in a thinly contested area.
(4) The price base is flat year on year; occupancy is midweek-heavy. Settled ADR estimates for business hotels were up 1.7% year on year over January–August — flat territory — and estimated occupancy in August 2026 ran 91.0% on Thursday against 76.0% on Sunday. Rather than chasing a year-on-year gain through room-only rates alone, this is a period in which raising the share of meal-inclusive products on thick midweek dates is the easier way to take more from the same inventory.
| Horizon | Action | Trigger | Intent |
|---|---|---|---|
| Today–this week | List out your room-only-to-breakfast spread across every sales channel | If the spread still sits below the prefecture’s business-hotel level (+9.1%, roughly ¥1,400) | Quantify the gap being left uncaptured |
| Today–this week | Audit breakfast take-up by day of week against seating and shift assumptions | If shifts are weighted to weekends while the market shape for August 2026 was Thursday 91.0% against Sunday 76.0% | Align service capacity with the shape of demand |
| Within two weeks | Decide whether to keep breakfast as a flat charge or link it to the rate band | If your own breakfast premium varies widely between peak and off-peak months | Prevent relative value thinning in peak demand |
| Within two weeks | At properties in Takamatsu City, revisit breakfast copy and photography in a business-travel context | If your gap falls short of the Takamatsu City level (+12.7%) | Capture the gap in line with local demand |
| Toward next month | Assess whether dinner-inclusive and half-board plans can be productized, based on service capacity and food cost | If the half-board-over-breakfast gap (business hotels, +29.1%) looks likely to exceed your incremental cost | Rate upside in a thinly contested area |
| Toward next month | Rebuild the October–November rate calendar around the seasonal shape of a June trough and an August peak | If your October–November settings diverge from the current market estimate (October ¥9,640 / November ¥9,570) | Secure revision timing in line with the seasonal shape |
Source: MetroEngines Research; compiled by the HotelBank Editorial Team
* No outcome is guaranteed; these are presented as material for consideration in light of each property’s own product mix and service capacity.
In summary — three yardsticks for Kagawa’s meal premiums
The first yardstick is “+9.1% and +17.6%.” Within-hotel breakfast gaps in Kagawa run +9.1% at business hotels (28 properties) and +17.6% at city hotels (9 properties). Holding your own spread against those two numbers, and judging whether it sits inside or outside them, is the starting point.
The second is “dinner is worth about three times breakfast.” Half-board at business hotels runs +29.1% over breakfast-only (9 properties) and +64.5% at city hotels (5 properties). Few properties qualify, which makes this thinly contested ground for any property able to staff the service.
The third is “price flat, occupancy midweek.” Settled ADR estimates at business hotels were up 1.7% year on year over January–August — flat territory — and estimated occupancy in August 2026 ran 91.0% on Thursday against 76.0% on Sunday. Rather than a single-track push on room-only rates, shifting the mix toward meal-inclusive products on the days demand is thickest is the realistic next move.
Methodology and sources
■ Data source
Sales plans and listed inventory published on major accommodation booking sites, collected daily and aggregated by MetroEngines. Meal premiums are within-hotel pair comparisons covering only properties that sell both room-only and meal-inclusive plans (based on quoted prices for two adults in one room); settled ADR is the transaction price level estimated from the same sales data; estimated occupancy is derived from the depletion of OTA-listed inventory. Periods covered: meal premiums, stays May–September 2026; settled ADR estimates, January 2025–December 2026; estimated occupancy, stays August 2026. Data retrieved September 10, 2026. The national comparisons (Tables 2 and 3) apply the same method to all 47 prefectures for September 2026 stays.
■ Calculation assumptions
The meal premium is a difference metric with the property held fixed; it is not a price level (ADR). Ryokan are excluded because meals are standard in their core product. Combinations with fewer than 5 qualifying properties (N) are not shown, and the denominator of each national rank therefore differs by combination. Year-on-year comparisons use confirmed figures on both sides only; no direct comparison is made between a current estimate and a prior-year confirmed figure. The quick-reference grid in Table 4 mechanically applies observed premiums to arbitrary room-only rates as a reference and does not indicate an appropriate level for any individual property. The monthly conversion in the text accompanying Table 4 (100 rooms, 82.9% estimated occupancy for August 2026, 30 days) is a simple calculation intended to convey scale.
■ Limitations and caveats
Estimated occupancy is an OTA-listed-inventory-based estimate and is defined differently from actual room occupancy (it runs high because rooms not listed are counted on the sold side). Settled ADR estimates show a median error of 6.6% against published operating results. City-hotel samples run to 9–11 properties and half-board cuts to 5–9 properties, small enough that a product revision at a few properties can move the percentage materially. Settled ADR estimates from September 2026 onward are based on current sales conditions and are not confirmed figures. National ranks are relative ranks among prefectures with 5 or more qualifying properties, not ranks including the excluded prefectures.
• Definition of estimated occupancy: OTA-listed-inventory-based occupancy = 100 − 100 × rooms still listed on OTAs ÷ total rooms. The scope is a fixed cohort of properties listing at least 30% of their total rooms on OTAs (the same property set for every stay date). It is an estimate based on the depletion of inventory sold on OTAs and is defined differently from actual room occupancy (it runs high because rooms not listed are counted on the sold side). The month covered in this article is August 2026, and the scope is 42 business hotels / 2,995 rooms in Kagawa Prefecture (as listed on major booking sites).
• Observation window: estimated occupancy and booking curves are based on observations from 45 days before the stay date up to the most recent reading. This article uses the observation closest to the stay date.
• Definition of settled ADR estimate: the transaction price level (tax-exclusive equivalent) estimated from OTA and other sales data (lowest-plan level × segment coefficient, an ensemble across multiple channels). Past months are confirmed figures; the current and future months are estimates based on current sales conditions. Median error against published operating results is 6.6%. The scope is N=90 business hotels in Kagawa Prefecture (as of September 2026) and N=10 city hotels (January–August 2026 confirmed figures) to 11 (as of September 2026). Year-on-year comparisons use confirmed figures on both sides only; no direct comparison is made between a current estimate and a prior-year confirmed figure.
• Definition of the meal premium: a difference metric aggregated from per-property gaps, covering only properties that sell both room-only plans and meal-inclusive plans (breakfast / dinner / half-board) within the same hotel. Because the property is held fixed, differences in location and grade do not affect it — but neither is it a metric of price level (ADR). Ryokan are excluded because meals are standard in their core product. The property count (N) differs by combination and runs N=5–50 in this article (noted alongside each figure). Combinations with N below 5 are not shown.
• Breakdown of N: meal premiums (stays September 2026) = 50 properties all segments, 28 business hotels, 9 city hotels (breakfast vs. room-only); half-board cuts run 5–27 properties. Takamatsu City = 23 properties all segments, 18 business hotels, 5 city hotels.
• Data as of: September 10, 2026. Sales conditions and inventory change daily, so the figures in this article are a snapshot as of the retrieval date.