

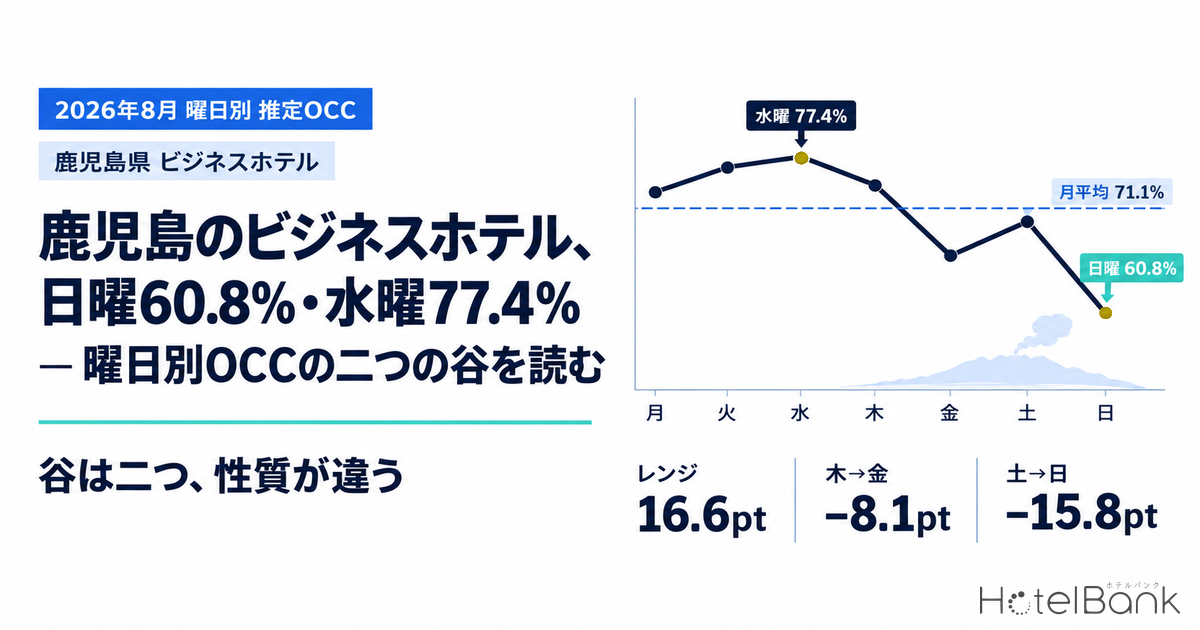
Aggregating the August 2026 results of 140–142 business hotels in Kagoshima (12,761 rooms) by day of week, estimated OCC (based on OTA-listed inventory) was 77.4% on Wednesday against 60.8% on Sunday. The range between the highest and lowest days was 16.6pt, and the monthly average was 71.1%. City hotels in the same prefecture (N=24) had a range of 9.6pt and resort hotels (N=43) 6.3pt — both with shallower troughs than business hotels. Moreover, the 8.1pt drop from 74.9% on Thursday to 66.8% on Friday is more than twice that of business hotels in the five comparison prefectures (2.5–3.8pt). Kagoshima’s business hotels have two troughs of different character — Sunday and Friday — and each needs its own approach to fill it.
Coverage: Kagoshima business hotels, N=140–142 properties (for comparison: city hotels N=24 and resort hotels N=43 in the same prefecture, plus business hotels in five other prefectures). The price metric in this article is estimated settled ADR (the settled price level estimated from OTA and other sales data, pre-tax equivalent); occupancy is an estimate based on OTA-listed inventory. Both are defined at the end of the article. Data as of: September 8, 2026.
- — Sunday 60.8%, Wednesday 77.4% / a range of 16.6pt. Estimated OCC by day of week for 140–142 business hotels in Kagoshima, August 2026 (completed-month actuals). Monthly average: 71.1%.
- — Two troughs, of different character. Thursday→Friday is −8.1pt (−2.5 to −3.8pt in the five comparison prefectures); Saturday→Sunday is −15.8pt (the same shape as Miyazaki’s −14.8pt). The former is a selling problem; the latter is a product-design problem.
- — Within the same prefecture, trough depth differs nearly threefold by type. Ranges: business 16.6pt, city 9.6pt, resort 6.3pt. Benchmark your property against the day-of-week shape of its own type, not the prefecture average.
- — The Sunday trough forms in the final two weeks. At 45 days out, Sunday was 42.0% and Wednesday 41.5% — virtually level — yet at the latest observation they stood at 55.9% vs 70.6%. Pickup was 13.9pt vs 29.1pt; the window that matters is 45 to 30 days out.
- — Day of week is about occupancy; price is a monthly question. Estimated settled ADR for August 2026 was ¥6,327 (final, N=161 properties), −2.8% YoY. Price levels by day of week are not covered.
Sunday 60.8%, Wednesday 77.4% — How Much Trough Depth Differs by Type
First, we line up estimated OCC by day of week for August 2026 (completed month, actuals) across three property types in Kagoshima. Business hotels peak on Tuesday and Wednesday (76.8% / 77.4%) and recover to nearly the same height on Saturday (76.6%), but sink sharply on Friday (66.8%) in between and on Sunday (60.8%), which leads into the next week. Against the monthly average of 71.1%, Sunday sits 10.3pt below and Wednesday 6.3pt above.
Meanwhile, the prefecture’s 24 city hotels (2,568 rooms) averaged 81.8% for the month with a range of 9.6pt, and its 43 resort hotels (2,209 rooms) averaged 86.8% with a range of 6.3pt. Sunday came in at 78.8% and 87.2% respectively — only −3.0pt and +0.4pt from the monthly average (for resorts, Sunday slightly exceeds the monthly average). Even in the same area and the same month, the day-of-week shape changes this much when the source of demand differs. Elsewhere in Kyushu, business hotels in Kumamoto run high on Thursday and Saturday with a shallow Sunday trough — the day-of-week shape swaps around by type and prefecture (Kumamoto Day-of-Week Occupancy Inverts by Type).
Source: MetroEngines Research; compiled by the HotelBank Editorial Team
| Day | Business N=140–142 |
City N=24 |
Resort N=43 |
|---|---|---|---|
| Mon | 66.4% | 78.2% | 84.5% |
| Tue | 76.8% | 81.3% | 84.0% |
| Wed | 77.4% | 81.9% | 84.8% |
| Thu | 74.9% | 80.6% | 87.2% |
| Fri | 66.8% | 84.2% | 89.1% |
| Sat | 76.6% | 87.8% | 90.3% |
| Sun | 60.8% | 78.8% | 87.2% |
| Monthly avg | 71.1% | 81.8% | 86.8% |
| Range | 16.6pt | 9.6pt | 6.3pt |
Kagoshima, August 2026 (completed-month actuals): estimated OCC by day of week (based on OTA-listed inventory) / Source: MetroEngines Research; compiled by the HotelBank Editorial Team
Note that business hotels were also low on Monday in August, at 66.4%. This is not a year-round structure, however, but a pattern specific to the summer holiday period. Extending the same aggregation to May, June and July, Monday stood at 83.8% in May (the highest day of that month), 70.6% in June and 78.1% in July — above Friday and Sunday in every case. Across the four months, only Friday and Sunday are consistently troughs.
| Month | Mon | Tue | Wed | Thu | Fri | Sat | Sun | Monthly avg |
|---|---|---|---|---|---|---|---|---|
| May 2026 N=140 | 83.8% | 82.5% | 80.0% | 82.3% | 72.8% | 76.8% | 65.0% | 77.0% |
| June 2026 N=140 | 70.6% | 79.9% | 78.4% | 82.1% | 63.1% | 70.0% | 57.1% | 71.9% |
| July 2026 N=141 | 78.1% | 85.4% | 84.8% | 85.6% | 77.6% | 88.9% | 69.6% | 81.5% |
| August 2026 N=140–142 | 66.4% | 76.8% | 77.4% | 74.9% | 66.8% | 76.6% | 60.8% | 71.1% |
Kagoshima business hotels: estimated OCC by day of week (completed-month actuals for each month) / Source: MetroEngines Research; compiled by the HotelBank Editorial Team
Thu→Fri −8.1pt, Sat→Sun −15.8pt — The Two Troughs Fall Differently
Breaking the troughs down by where the drop starts makes their different character clear. In August 2026, Kagoshima business hotels fell 8.1pt from 74.9% on Thursday to 66.8% on Friday, and 15.8pt from 76.6% on Saturday to 60.8% on Sunday. The former is a drop at the end of the weekday block; the latter is a drop at the end of the weekend block.
Set against business hotels in other prefectures, Kagoshima’s distinguishing feature is the size of the Friday-side drop. Aichi (N=298) went from 90.8% on Thursday to 87.0% on Friday, a 3.8pt fall; Hyogo (N=149) from 95.6% to 92.1%, 3.5pt; Fukuoka (N=317) from 94.9% to 92.4%, 2.5pt; Kumamoto (N=110) from 98.5% to 95.4%, 3.1pt; and Miyazaki (N=79) from 90.0% to 87.2%, 2.8pt. All are 3.8pt or less, so Kagoshima’s 8.1pt is more than double.
The Saturday→Sunday drop, by contrast, stands out in Kagoshima (15.8pt) and Miyazaki (14.8pt), on a different level from Kumamoto (3.6pt), Fukuoka (5.7pt), Hyogo (6.4pt) and Aichi (7.2pt). The Sunday trough reads as a shape shared by business hotels in southern Kyushu, while the Friday trough is especially deep in Kagoshima.
| Prefecture (business hotels) | N | Monthly avg | Peak day | Sunday | Thu→Fri | Sat→Sun | Range |
|---|---|---|---|---|---|---|---|
| Kagoshima | 140–142 | 71.1% | Wed 77.4% | 60.8% | −8.1pt | −15.8pt | 16.6pt |
| Miyazaki | 79 | 85.0% | Thu 90.0% | 74.0% | −2.8pt | −14.8pt | 16.0pt |
| Kumamoto | 110 | 96.2% | Tue 98.7% | 91.4% | −3.1pt | −3.6pt | 7.3pt |
| Fukuoka | 317 | 92.6% | Thu 94.9% | 88.4% | −2.5pt | −5.7pt | 6.5pt |
| Aichi | 298 | 86.9% | Thu 90.8% | 80.5% | −3.8pt | −7.2pt | 10.3pt |
| Hyogo | 149 | 92.4% | Thu 95.6% | 87.0% | −3.5pt | −6.4pt | 8.6pt |
Estimated OCC by day of week, August 2026 (completed-month actuals). Levels depend on the composition of listed inventory in each prefecture, so the comparison focuses on the size of the drops / Source: MetroEngines Research; compiled by the HotelBank Editorial Team
August Day by Day — A Low of 51.9%, a Peak of 96.0%
It is also worth looking at the daily series before it is smoothed into day-of-week averages. Estimated OCC for Kagoshima business hotels in August 2026 hit its monthly low of 51.9% on Sunday, August 16, and its high of 96.0% on Saturday, August 22 — a spread of 44.1pt. The same month and the same population swing this far.
The low came on the Obon weekend. The Obon week (August 10–16), which includes Thursday, August 13 through Sunday, August 16, averaged 64.4%, 8.6pt below the 73.0% average of the other 24 days. What sets this week apart is that even Saturday, normally high, sank — 55.1% on Saturday, August 15 and 51.9% on Sunday, August 16 — a pattern in which leisure demand failed to fully replace the corporate demand that dropped away. Recomputing the day-of-week averages without Obon week lifts Saturday from 76.6% to 82.0% and Wednesday from 77.4% to 80.9%, while Sunday barely moves (60.8% → 63.0%) and Friday stays flat (66.8% → 66.9%). In other words, Obon did not create the two troughs. The depth of the Obon-period dip varies widely by prefecture even within Kyushu, and Kagoshima sits on the side where inventory is slow to absorb (Obon T-7: Kyushu’s 31.7pt Gap — Fukuoka 73.0%, Kagoshima 41.3%).
At the other end, the peak on Saturday, August 22 reached 96.0%, and the share of properties with no listed inventory available (estimated sell-out rate) was 51.1%, well above the August Saturday average of 31.1%. The following Saturday, August 29, was also high, at 86.5% and 39.3% respectively. August 29 was the date of the 24th Kagoshima Kinko Bay Summer Night Fireworks Festival (Kagoshima Port Honko district, approx. 15,000 shells). That prefecture-wide business hotel occupancy spiked on a Saturday twice in the month shows the need to overlay an event calendar on the day-of-week calendar.
Source: MetroEngines Research; compiled by the HotelBank Editorial Team
No Gap Yet at 45 Days Out — The Sunday Trough Forms in the Final Two Weeks
So when does the Sunday trough form? We compare booking curves from 45 days before the stay date to the latest observation, again for Kagoshima business hotels. At 45 days out, estimated OCC for Sunday, September 13 and Wednesday, September 16 was 42.0% and 41.5% — a gap of just 0.5pt, with the two essentially at the same starting point. At 30 days out they were 43.4% and 44.4%, still only 1.0pt apart.
The gap opens close in. Wednesday, September 16 built up to 70.6% at the latest observation (9 days out), a pickup of 29.1pt from 45 days out. Sunday, September 13, by contrast, reached 55.9% at the latest observation (6 days out), a pickup of just 13.9pt. From the same starting point, close-in pickup over the final two weeks alone opened a 14.7pt gap. The natural reading is that the Sunday trough arises not because rooms are left unsold early, but because the close-in build that should arrive does not. Looking at booking curves for the same prefecture by type also confirms that when bookings firm up itself differs by type (Kagoshima Summer Booking Curves: 23.2pt Gap by Type at 45 Days Out).
Another important point is that Sunday is not always a trough. Sunday, September 20 was already at 60.5% at 45 days out — starting 18.5pt higher than a normal Sunday — and progressed to 64.3% at 30 days out and 70.6% at the latest observation (13 days out). This date falls in the middle of the five-day holiday from Saturday, September 19 to Wednesday, September 23, 2026 (September 21 is Respect for the Aged Day and September 23 is Autumnal Equinox Day, which makes September 22, sandwiched between them, a national holiday — producing the first “Silver Week” in 11 years). A Sunday that is not followed by a workday is an entirely different product from other Sundays.
Conversely, Wednesday, September 23, the last day of the holiday, was 41.1% at 45 days out, 43.0% at 30 days out and 44.8% at the latest observation (16 days out) — the close-in build seen on a normal Wednesday has not occurred. Lining up the surrounding dates makes it clear that demand is determined not by the day-of-week label but by whether the following day is a day off.
Source: MetroEngines Research; compiled by the HotelBank Editorial Team
Read Price Monthly, Not by Day of Week — August’s Estimated Settled ADR Finalized at ¥6,327
What this article has examined along the day-of-week axis so far is occupancy only. For price, estimated settled ADR uses monthly as its canonical granularity, so price levels by day of week are not covered in this article. On a monthly basis, the estimated settled ADR (final value) for Kagoshima business hotels in August 2026 was ¥6,327 (N=161 properties), 2.8% lower than ¥6,512 (N=156 properties) in August 2025. July was ¥5,898 (N=160) vs ¥5,865 (N=155), up 0.6%, and June was ¥5,753 (N=161) vs ¥5,805 (N=154), down 0.9% — through the summer, levels have tracked flat to slightly below the prior year.
Lining up 2026’s finalized months: January ¥6,453, February ¥6,408, March ¥6,096, April ¥5,917, May ¥6,240, June ¥5,753, July ¥5,898 and August ¥6,327 (all N=159–161 properties). June is the lowest of the year so far, with August the summer peak. Note that from September 2026 onward the values are estimates based on current sales status (September: ¥8,274, N=154 properties), on a different estimation basis from finalized values. Any simple comparison with finalized values should wait for month-end finalization, and this article does not compare their levels.
For Revenue Managers of Business Hotels in Kagoshima — Implications and Action Plan
1. There are two troughs, and they call for different handling. The 8.1pt drop from 74.9% on Thursday to 66.8% on Friday is more than double that of the five comparison prefectures (2.5–3.8pt). This drop signals that the weekday block does not extend through Friday; the demand to fill it is either corporate guests extending their stay or leisure guests arriving the night before Saturday. The 15.8pt drop from 76.6% on Saturday to 60.8% on Sunday, on the other hand, is a shape commonly seen in southern Kyushu (Miyazaki 14.8pt), and here the demand-side constraint of the next day being a workday is at play. Though both are “troughs”, Friday offers relatively more room to move through how your property sells, while Sunday tends to become a question of changing the product itself.
2. Design Sunday recovery so it does not depend on close-in pickup. At 45 days out, Sunday, September 13 (42.0%) and Wednesday, September 16 (41.5%) were nearly level, yet close in they diverged to 55.9% and 70.6%. Pickup was 13.9pt vs 29.1pt — Sunday’s close-in pickup is roughly half of Wednesday’s. If your property’s Sundays follow the same shape, placing a Sunday-specific offering in the 45-to-30-days-out window, while there is still no gap, is more likely to pay off than scrambling after 30 days out.
3. Redefine the trough as “a Sunday followed by a workday”, not simply “Sunday”. Sunday, September 20 started at 60.5% at 45 days out, 18.5pt higher than a normal Sunday. A Sunday followed by a day off, as in the five-day holiday of September 19–23, should be treated as a separate category from the outset; applying the same rules as a normal Sunday leaves demand on the table. Conversely, Wednesday, September 23, the last day of the holiday, was only 44.8% even at the latest observation — judging by the Wednesday label alone leads to misreading.
4. Reflect in your choice of comparison set the fact that trough depth differs by type even within the same area. Within Kagoshima, the range differs widely: business 16.6pt, city 9.6pt, resort 6.3pt. When assessing the peaks and troughs of your property’s day-of-week pattern, the benchmark should be not the prefecture-wide average but the day-of-week shape of the same property type.
| Timeframe | Action | Decision trigger (figures from this article) | Aim |
|---|---|---|---|
| Today to this week | For Sundays over the next 3–4 weeks, take stock of remaining inventory and current offerings (plans, channels, inventory allocation) on a single sheet | If your property’s Sunday occupancy sinks as far as or further than the market’s Sunday 60.8% or its 15.8pt gap to Saturday | Rather than dismissing the trough as “seasonal”, identify the gaps in your actions first |
| Today to this week | Articulate a Sunday check-in / Monday check-out stay as a single product (early-departure flow, uses that start on-site Monday morning) | If your property’s Monday (market 66.4% in August) sits around 10pt below Tuesday/Wednesday (76.8% / 77.4%) | Pull start-of-week business travel demand forward into Sunday, lifting Sunday and Monday together |
| Within 2 weeks | Reposition Friday from “last day of the weekday block” to “first night of weekend leisure”, and prepare how to present Friday–Saturday two-night stays | If your property’s Thursday→Friday drop is larger than the market’s −8.1pt (−2.5 to −3.8pt in the other five prefectures) | Pull part of Saturday’s 76.6% demand forward into Friday and narrow the 16.6pt range |
| Within 2 weeks | Switch to placing Sunday inventory and conditions early, in the 45-to-30-days-out window (reducing reliance on close-in responses) | If your property’s Sunday pickup from 45 days out to the latest observation falls short of the market’s 13.9pt (29.1pt for Wednesday) | Build up bookings without depending on close-in pickup |
| Toward next month | Overlay event and holiday calendars on the day-of-week calendar, and manage “Sundays followed by a day off” and “last days of holidays” as separate buckets | Sunday, September 20 at 60.5% at 45 days out and Wednesday, September 23 (last day of the holiday) at 44.8% at the latest observation — opposite movements under the same day-of-week label | Reduce missed demand and excess inventory caused by applying day-of-week rules uniformly |
| Toward next month | Review price monthly rather than by day of week, checking your property’s monthly level against the market’s estimated settled ADR | If your property’s August 2026 level remains below the market’s estimated settled ADR of ¥6,327 (final, N=161 properties, −2.8% YoY) | Confirm your monthly positioning before trying to fill occupancy troughs with price |
Source: MetroEngines Research; compiled by the HotelBank Editorial Team
None of these actions guarantees results; each should be tested against your own property’s demand mix. Sunday product development in particular should proceed while checking consistency with existing weekday rates and channel mix.
Summary — Measure Troughs by Position, Depth and Formation
When working with day-of-week occupancy, looking at the following three points as a set makes it easier to put your property’s situation into words.
1. Position of the troughs. For Kagoshima business hotels there are two: Sunday at 60.8% and Friday at 66.8%. Across the four months of May–August 2026, only these two are consistently troughs (August’s Monday at 66.4% is a pattern specific to the summer holiday period; Monday was not a trough in May–July).
2. Depth of the troughs. The range is 16.6pt — deeper than city hotels (9.6pt) and resorts (6.3pt) in the same prefecture — and the Thursday→Friday drop of −8.1pt is more than double that of the five comparison prefectures (−2.5 to −3.8pt). The Saturday→Sunday drop of −15.8pt is a shape shared across southern Kyushu.
3. How the troughs form. At 45 days out, Sunday, September 13 (42.0%) and Wednesday, September 16 (41.5%) were virtually level, diverging to 55.9% vs 70.6% close in. The Sunday trough arises from the difference in pickup over the final two weeks, which suggests that groundwork 45 to 30 days out is more effective than close-in measures. And as Sunday, September 20 showed at 60.5% at 45 days out, a Sunday followed by a holiday should be treated as a separate product.
Day of week is about occupancy; price is a monthly question. Holding to that line, start by overlaying your property’s day-of-week shape on the market’s.
Frequently Asked Questions
Q. Which day of the week has the lowest occupancy for business hotels in Kagoshima?
A. In the August 2026 aggregation (completed-month actuals), Sunday was lowest, with estimated OCC of 60.8%. The highest was Wednesday at 77.4%; the range between the highest and lowest days was 16.6pt, and the monthly average was 71.1%. Coverage is 140–142 business hotels in Kagoshima (12,761 rooms).
Q. Why can you say there are “two troughs”?
A. Because the drops start from different points. The −8.1pt fall from 74.9% on Thursday to 66.8% on Friday occurs at the end of the weekday block, while the −15.8pt fall from 76.6% on Saturday to 60.8% on Sunday occurs at the end of the weekend block. Across the four months of May–August 2026, only Friday and Sunday are consistently troughs; the low Monday in August (66.4%) is a pattern specific to the summer holiday period.
Q. Is Kagoshima’s Friday drop large compared with other prefectures?
A. Yes. In August 2026, the Thursday→Friday drop was −3.8pt in Aichi, −3.5pt in Hyogo, −3.1pt in Kumamoto, −2.8pt in Miyazaki and −2.5pt in Fukuoka, against −8.1pt in Kagoshima — more than double. The Saturday→Sunday drop of −15.8pt, on the other hand, is close to Miyazaki’s −14.8pt and reads as a shape shared by business hotels in southern Kyushu.
Q. Can Sunday occupancy be filled with close-in measures?
A. Based on the observations in this article, relying on close-in measures alone puts you at a disadvantage. Estimated OCC for Sunday, September 13 and Wednesday, September 16, 2026 was nearly level at 45 days out (42.0% and 41.5%), but diverged to 55.9% and 70.6% at the latest observation. Pickup from 45 days out was 13.9pt for Sunday and 29.1pt for Wednesday, so Sunday’s close-in pickup is roughly half of Wednesday’s. Having an offering in place 45 to 30 days out is likely to work better.
Q. Are there cases where a Sunday should be treated differently?
A. It is reasonable to treat a Sunday followed by a holiday as a separate product. Sunday, September 20, in the middle of the five-day holiday (September 19–23, 2026), started from 60.5% at 45 days out, already 18.5pt higher than a normal Sunday. Conversely, Wednesday, September 23, the last day of the holiday, was only 44.8% even at the latest observation; judging by the Wednesday label alone leads to misreading.
Q. How should price (ADR) by day of week be viewed?
A. This article does not cover price levels by day of week, because estimated settled ADR uses monthly as its canonical granularity. On a monthly basis, estimated settled ADR for Kagoshima business hotels in August 2026 was ¥6,327 (final value, N=161 properties), 2.8% below the ¥6,512 of the same month a year earlier.
Related reading
- Kagoshima Summer Booking Curves: 23.2pt Gap by Type at 45 Days Out
- Kumamoto Day-of-Week Occupancy Inverts by Type: Thu 88.3% vs Sat 89.9%
- Hokkaido Business Hotels Aren’t Weekend-Led: Thu 95.4% Ties Sat 95.4%
- Ibaraki Silver Week: Ryokan-Business Gap Hits 21.9pt, Back Half Flat
- Obon T-7: Kyushu’s 31.7pt Gap — Fukuoka 73.0%, Kagoshima 41.3%
About the Data
■ Data Sources
• Definition of estimated OCC (based on OTA-listed inventory): “OTA-listed-inventory occupancy = 100 − 100 × OTA-listed remaining rooms ÷ total rooms. An estimate based on how far inventory sold on OTAs has been absorbed; its definition differs from actual room occupancy (it tends to read higher).” Coverage is at the prefecture level for Kagoshima, Miyazaki, Kumamoto, Fukuoka, Aichi and Hyogo; target months are May, June, July and August 2026 (all completed-month actuals).
• Booking curves: based on observations from 45 days before the stay date to the latest observation. Coverage: Kagoshima business hotels; target stay dates: September 13, 16, 20 and 23, 2026.
■ Estimation Assumptions
• Definition of estimated settled ADR: the settled price level (pre-tax equivalent) estimated from OTA and other sales data (lowest-plan level × type-specific coefficient, as an ensemble across multiple channels). Past months are final values; current and future months are estimates based on current sales status. Median error of 6.6% when reconciled against published operating results. Values for current and future months may change with sales status.
■ Limitations and Caveats
• Estimated OCC in this article is based on the absorption of OTA-listed inventory and does not match actual room occupancy (it tends to read higher). Day-of-week values are averages of the relevant days (4–5 days) within the same month and include special days such as events and Obon. No year-on-year comparison is made because less than two years of data from the same source has accumulated.
• Breakdown of N: day-of-week estimated OCC = Kagoshima business hotels N=140–142 properties (12,761 rooms) / Kagoshima city hotels N=24 properties (2,568 rooms) / Kagoshima resort hotels N=43 properties (2,209 rooms) / Miyazaki business hotels N=79 properties / Kumamoto business hotels N=110 properties / Fukuoka business hotels N=317 properties / Aichi business hotels N=298 properties / Hyogo business hotels N=149 properties. Estimated settled ADR = Kagoshima business hotels N=154–161 properties (varies by month). Booking-curve observations cover 130–141 properties at each point.
• Data as of: September 8, 2026. Sales status and inventory change daily, so the figures in this article are a snapshot as of the retrieval date.
References and Sources
• 24th Kagoshima Kinko Bay Summer Night Fireworks Festival (Kagoshima City): dates and event information — Walkerplus Fireworks 2026 (Japanese)
• Kagoshima Kinko Bay Summer Night Fireworks Festival — official website (Japanese)
• Kagoshima Kinko Bay Summer Night Fireworks Festival — Kagoshima City Tourism Navi (Japanese)
• Silver Week: September 2026 brings the first long holiday of its kind in 11 years — Impress Watch (Japanese)