

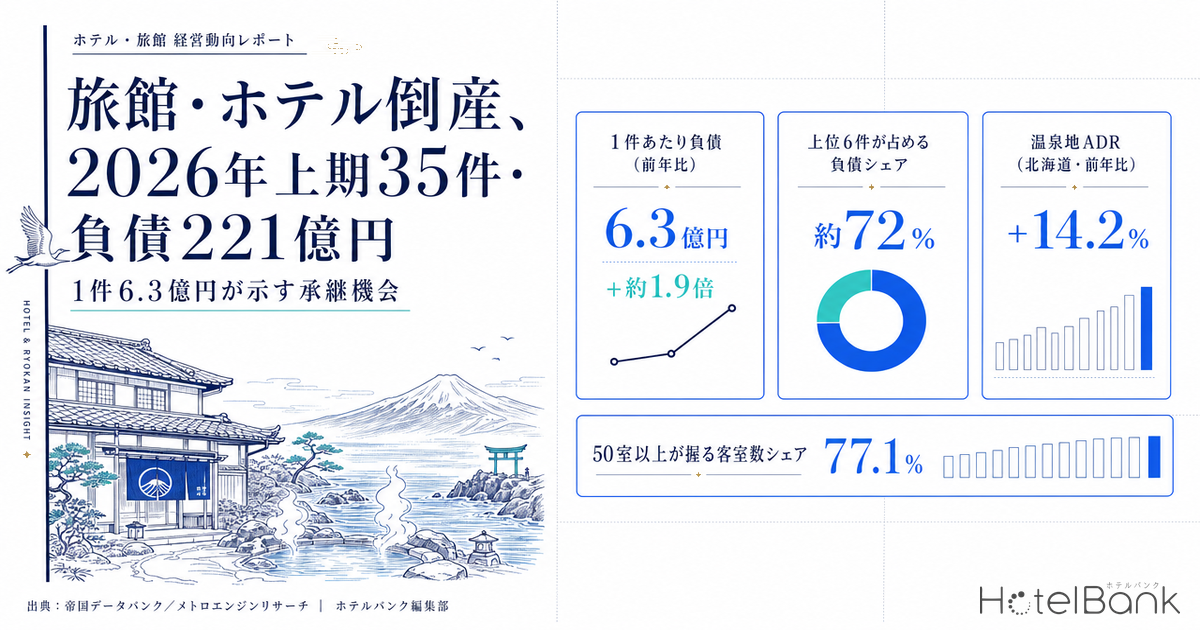
In the first half of 2026 (January–June), 35 hotel and ryokan operators in Japan went bankrupt, with total liabilities of ¥22.113 billion. The number of cases fell by 3 from the same period a year earlier, a 7.9% decline, while total liabilities rose 72.3%. When the case count falls but the total amount grows, the size of each case must be getting larger. Indeed, liabilities per case roughly doubled in a single year — about 1.9x — from approximately ¥338 million in H1 2025 to approximately ¥632 million.
What these figures indicate is that the center of gravity of market exits is shifting from small inns with a few dozen rooms toward mid-sized and large properties. And proceedings for mid-sized and large properties usually do not end with the property simply disappearing — in most cases they conclude with “someone taking it over.” Starting from published bankruptcy statistics and court-proceeding facts, this article overlays Japan’s nationwide lodging stock by room-count band and estimated settled ADR in onsen (hot spring) destinations to estimate in which size bands a succession and turnaround pipeline is emerging.
- — Hotel and ryokan bankruptcies in H1 2026 totaled 35 cases, down 7.9% YoY. The case count has held flat in the 30s for three straight years, but total liabilities rose 72.3% to ¥22.113 billion.
- — Liabilities per case rose from about ¥338 million a year earlier to about ¥632 million — 1.9x. The center of gravity of exits is shifting from small inns to mid-sized and large properties.
- — The 6 cases confirmed through public disclosures account for about 72% of total liabilities. The total was pushed up by larger top cases, so it must be read separately from changes in the case count.
- — Across a nationwide stock of 27,162 properties, properties with 50+ rooms make up 25.6% of properties but 77.1% of rooms. Working back from earning power, a ¥632 million debt load corresponds to a 60–100 room property.
- — Estimated settled ADR for ryokan in 11 onsen prefectures exceeded the prior year in 10 prefectures over the latest 12 months (up to +14.2%). The economics of succession — carving out debt and restarting operations — have clearly improved over the past two years.
Metric Definitions Used in This Article
- ADR (Average Daily Rate): An estimated settled rate (tax-exclusive equivalent), calculated by applying a property-type correction factor to the lowest-plan price level each property publishes on OTAs and similar channels (per-room rate for 2 guests per room, tax included). Cross-checked against property-level results disclosed by listed hotel REITs (91 properties, latest 3 months), the median error is about 7%. These are estimates and differ from each property’s actual transacted prices and accounting figures. Area-level ADR is the median of the properties covered (the level of a typical property in the area).
- OCC (Occupancy Rate): The ratio of rooms sold to total rooms in the area (an estimate based on OTA sales inventory).
- Bankruptcy: Legal liquidation or restructuring with liabilities of ¥10 million or more. Case counts and total liabilities are from Teikoku Databank research (as reported by Kanko Keizai Shimbun).
- Data source: MetroEngines Research
Case Counts Flat for Three Years, While Liabilities per Case Jumped 1.9x
First, let us pin down the numbers. On a first-half basis, hotel and ryokan bankruptcies peaked at 73 cases in H1 2020, when the COVID-19 pandemic became severe, and have consistently stayed in the 30s since. There were 36 cases in H1 2024, 38 in H1 2025, and 35 in H1 2026. Over these three years, the case count itself has been effectively flat.
What has moved is the liabilities side: ¥18.314 billion in H1 2024, ¥12.832 billion in H1 2025, and ¥22.113 billion in H1 2026. After dipping in 2025, liabilities in 2026 rebounded to the highest level in three years. Dividing by the number of cases sharpens the picture. Liabilities per case were about ¥508 million in 2024, about ¥338 million in 2025, and about ¥632 million in 2026 — an increase of roughly 87% year on year.
Source: Compiled by HotelBank Editorial Team from Teikoku Databank research (as reported by Kanko Keizai Shimbun)
In other words, over these three years the “number” of operators exiting the market has not changed, while the amount each case carries has grown. A flat case count shows that the pace of exits itself is not accelerating. Rising liabilities per case, on the other hand, show that the businesses involved have become larger. The question of how many and the question of how big need to be read separately.
| First half (Jan–Jun) | Cases | Total liabilities | Liabilities per case | Cases YoY |
|---|---|---|---|---|
| 2024 | 36 | ¥18.314 billion | approx. ¥508 million | −5.3% |
| 2025 | 38 | ¥12.832 billion | approx. ¥338 million | +5.6% |
| 2026 | 35 | ¥22.113 billion | approx. ¥632 million | −7.9% |
Source: Compiled by HotelBank Editorial Team from Teikoku Databank research (as reported by Kanko Keizai Shimbun). Liabilities per case are calculated by the editorial team as total liabilities divided by the number of cases
Top 6 Cases Account for About 70% of Total Liabilities — The Scale Shown by Published Proceedings
What is driving the rise in liabilities per case becomes clear when the actually published proceedings are lined up. Of the lodging-industry cases that Tokyo Shoko Research published in its “How They Went Bankrupt” (こうして倒産した) series for H1 2026, the editorial team was able to individually confirm the following 6. Each entry is limited to facts where a court’s decision to commence proceedings, or a filing, has been made public.
| Company | Location | Main properties operated | Total liabilities | Proceedings |
|---|---|---|---|---|
| Renaissance Co., Ltd. ((株)ルネッサンス) | Shibuya-ku, Tokyo | “Arietta Hotel” (アリエッタホテル) and others (long dormant) | ¥3.565 billion | Bankruptcy proceedings commenced (Feb 25, Tokyo District Court) |
| Terao Onsen Ltd. ((有)寺尾温泉) | Toyama City, Toyama | Onsen ryokan and 3 other properties | ¥3.459 billion | Bankruptcy proceedings commenced (Mar 5, Toyama District Court) |
| KGH Seiri Kaisha Co., Ltd. ((株)KGH整理会社) | Yonago City, Tottori | Former legal entity of Kaike Grand Hotel / Kasuitei (皆生グランドホテル/華水亭) | ¥2.820 billion | Special liquidation filed (Apr 23) / commenced (Jun 23, Yonago Branch of Tottori District Court) |
| K&K Co., Ltd. ((株)K&K) | Hachinohe City, Aomori | 58 guest rooms, with banquet halls and a wedding chapel | ¥2.490 billion | Special liquidation filed (Mar 30, Aomori District Court) |
| Seimachi Co., Ltd. ((株)セイマチ) | Awara City, Fukui | “Minoya Taiheikaku” (みのや泰平閣) (Awara Onsen) | ¥1.857 billion | Bankruptcy proceedings commenced (Jan 23, Fukui District Court) |
| Sakaguchi Shoji Ltd. ((有)坂口商事) | Wajima City, Ishikawa | “Wajima Station Hotel” (輪島ステーションホテル) (34 rooms) | ¥1.800 billion | Bankruptcy proceedings commenced (Dec 25, 2025, Wajima Branch of Kanazawa District Court) |
| Total of 6 cases | ¥15.991 billion | About 72% of H1 total liabilities | ||
Source: Compiled by HotelBank Editorial Team from Tokyo Shoko Research “How They Went Bankrupt” (January–June 2026) and company disclosures. Room counts are from company disclosures and MetroEngines Research
The 6 cases the editorial team could identify out of 35 — just 17% of the total — account for about ¥15.991 billion of the ¥22.113 billion in total liabilities, or roughly 72%. The reason liabilities per case jumped is not a broadening of cases but concentration in these few top cases. Conversely, the remaining 29 cases average about ¥211 million, close to the traditional level for small inns. The first-half statistics are most accurately read as two groups of very different character combined into a single number.
Location is also skewed. Of the 6 cases, all except the one in Shibuya-ku, Tokyo are located in regional onsen or tourist destinations. Moreover, they are concentrated along the Sea of Japan coast, in Tohoku and in San’in: Ishikawa, Fukui, Toyama, Aomori and Tottori. The trend does not change even when adding media-reported cases such as a lodging operator in Sado City, Niigata (liabilities of ¥1.5 billion; bankruptcy proceedings commenced April 30, 2026) and a ryokan in Kinugawa Onsen, Nikko City, Tochigi (68 rooms, liabilities of ¥600 million; bankruptcy filed in March). While urban lodging demand remains firm, large-scale proceedings are concentrated in regional onsen destinations.
The Tokyo case, however, is different in nature. The company recorded net sales of ¥1.345 billion in the fiscal year ended August 2019, then suspended operations and remained dormant for a long period. This is not a case of an operating property exiting the market; it is better understood as liabilities accumulated in the past being recorded in this period’s statistics. The size of the amount cannot be read as a signal of “urban demand trends.”
Which Room-Count Band Does ¥632 Million Correspond To?
How large a business does ¥632 million in liabilities per case represent? From here we test this with internal data. Among domestic lodging properties tracked by MetroEngines Research, 27,162 properties with 1,266,919 rooms have confirmed operations and known room counts (as of September 2026). Stratifying these by room-count band clearly reveals the skew in Japan’s lodging stock.
| Room-count band | Properties | Share of properties | Rooms | Share of rooms |
|---|---|---|---|---|
| 1–19 rooms | 14,791 | 54.5% | 122,052 | 9.6% |
| 20–49 rooms | 5,404 | 19.9% | 168,102 | 13.3% |
| 50–99 rooms | 3,032 | 11.2% | 216,058 | 17.1% |
| 100–199 rooms | 2,673 | 9.8% | 374,168 | 29.5% |
| 200–299 rooms | 859 | 3.2% | 202,092 | 16.0% |
| 300+ rooms | 403 | 1.5% | 184,447 | 14.6% |
| Subtotal, 50+ rooms | 6,967 | 25.6% | 976,765 | 77.1% |
Source: Compiled by MetroEngines Research and HotelBank Editorial Team (N=27,162 properties / 1,266,919 rooms, confirmed-operation basis, as of September 2026)
Source: Compiled by MetroEngines Research and HotelBank Editorial Team (N=27,162 properties)
Properties with 19 rooms or fewer make up a majority — 54.5% — of properties, but only 9.6% of rooms. Conversely, properties with 50+ rooms are just a quarter (25.6%) of properties yet hold 77.1% of rooms. Japan’s lodging supply is a two-tier structure: by property count it is a collection of small inns, but by rooms — the actual supply volume — mid-sized and large properties carry overwhelming weight.
Breaking this down by property type makes the two-tier structure even clearer. Of 7,741 ryokan, only 766 (9.9%) have 50+ rooms, and narrowing to 100+ rooms leaves just 185 (2.4%). By contrast, 4,184 of 6,385 business hotels (65.5%) have 50+ rooms, as do 918 of 1,102 city hotels (83.3%) and 559 of 1,224 resort hotels (45.7%). A shift in the center of gravity of bankruptcies toward mid-sized and large properties also means that opportunities for succession or operator change are emerging in the top 10% of ryokan and in the core bands of business, city and resort hotels.
Onsen Ryokan ADR Up 4–14% over the Past Year — The Economics of Turnarounds Are Changing
What is decisive when considering succession or turnaround is what rate level can be sustained after taking a property over. Here we compared, for the ryokan category in major prefectures with onsen destinations, the average estimated settled ADR over the latest 12 months (July 2025–June 2026) with the 12 months before that (July 2024–June 2025).
Source: Compiled by MetroEngines Research and HotelBank Editorial Team (ryokan category; monthly sample per prefecture ranges from a minimum of 97 to 485 properties)
ADR exceeded the prior year in 10 of the 11 prefectures. The largest gains were in Hokkaido at +14.2% (minimum monthly sample: 241 properties), Tochigi at +10.1% (193 properties) and Nagano at +9.9% (485 properties). In absolute level, Shizuoka (¥18,961), Ishikawa (¥18,730) and Oita (¥18,520) are highest. Only Ishikawa was roughly flat at −0.8%, which is likely because supply is still being restored following the 2024 Noto Peninsula Earthquake.
The point to note here is that the period in which rates rose by close to double digits largely overlaps with the period in which liabilities per case grew 1.9x. Even as the rate environment improves, proceedings go ahead for businesses whose legacy debt exceeds their current earning power. Conversely, if the debt is carved out and the same property is restarted, it can begin operating in a higher rate environment than before. The economics of succession have clearly improved over the past two years.
| Prefecture (ryokan category) | Latest 12-month ADR | Prior 12-month ADR | YoY | Min. monthly sample |
|---|---|---|---|---|
| Shizuoka | ¥19,000 | ¥17,900 | +5.8% | 419 |
| Ishikawa | ¥18,700 | ¥18,900 | −0.8% | 106 |
| Oita | ¥18,500 | ¥17,800 | +4.2% | 296 |
| Tochigi | ¥17,200 | ¥15,600 | +10.1% | 193 |
| Gunma | ¥15,900 | ¥14,900 | +6.6% | 265 |
| Niigata | ¥13,900 | ¥13,400 | +4.1% | 231 |
| Wakayama | ¥13,800 | ¥13,100 | +5.2% | 97 |
| Yamagata | ¥13,500 | ¥12,700 | +6.0% | 171 |
| Nagano | ¥13,500 | ¥12,300 | +9.9% | 485 |
| Fukushima | ¥11,000 | ¥10,100 | +8.4% | 225 |
| Hokkaido | ¥9,700 | ¥8,500 | +14.2% | 241 |
Source: Compiled by MetroEngines Research and HotelBank Editorial Team. Estimated settled ADR (tax-exclusive equivalent). Figures are rounded to the nearest ¥100; YoY changes are calculated from unrounded values
¥632 Million Corresponds to a 60–100 Room Property — Working Back from Earning Power
So what size of business does ¥632 million in liabilities per case correspond to in today’s onsen earnings environment? Let us work backward using the ADR levels above. The conservative case assumes ADR of ¥15,000, OCC of 60% and a GOP margin of 15%; the upside case assumes ADR of ¥18,000, OCC of 65% and a GOP margin of 20%. In both cases, we calculated the investment capacity the business can support at an assumed yield on cost of 8%. GOP margins are set at ryokan/resort-type levels, based on typical benchmarks by property type: 50–60% for limited-service (rooms-focused) hotels, 10–30% for city hotels and 5–15% for ryokan.
Source: Estimates by HotelBank Editorial Team based on MetroEngines Research ADR levels
| Rooms | Annual room revenue (conservative) | Supportable investment (conservative) | Supportable investment (upside) |
|---|---|---|---|
| 30 rooms | approx. ¥99 million | approx. ¥180 million | approx. ¥320 million |
| 60 rooms | approx. ¥197 million | approx. ¥370 million | approx. ¥640 million |
| 100 rooms | approx. ¥329 million | approx. ¥620 million | approx. ¥1.07 billion |
| 150 rooms | approx. ¥493 million | approx. ¥920 million | approx. ¥1.60 billion |
| 200 rooms | approx. ¥657 million | approx. ¥1.23 billion | approx. ¥2.14 billion |
Source: Estimates by HotelBank Editorial Team based on MetroEngines Research ADR levels. Conservative = ADR ¥15,000, OCC 60%, GOP margin 15%; upside = ADR ¥18,000, OCC 65%, GOP margin 20%; both at an assumed yield of 8%. These are simplified estimates; actual investment decisions require a detailed feasibility study
The results show that ¥632 million can be supported by current earning power at about 100 rooms in the conservative case and about 60 rooms in the upside case. In other words, the per-case liability level recorded in the H1 2026 statistics corresponds roughly to a 60–100 room business. In the stock table above, this band sits at the boundary between “50–99 rooms” (3,032 properties) and “100–199 rooms” (2,673 properties) — right at the core of Japan’s lodging supply.
What also becomes visible is a structure in which, for ryokan, the size of debt tends to exceed current earning power. Only 185 of 7,741 ryokan have 100+ rooms. The fact that liabilities per case still reach the ¥600 million range means that in many cases the debt exceeds the property’s current ability to generate earnings. That is precisely why turnarounds in this size band work not by “taking over the business as-is,” but in combination with a structure that carves out the debt and transfers only the business to a new company.
What the ¥2.82 Billion Breakdown Reveals — The “Second Company” Scheme at Kaike Onsen
The Yonago City, Tottori case in the table above is the clearest illustration of how a structure that carves out debt while preserving the business actually works. Tracing the public disclosures, the sequence was as follows.
On March 28, 2025, the Regional Economy Vitalization Corporation of Japan (REVIC), a public-private fund, decided to provide turnaround support to the operator of “Kaike Grand Hotel Tensui” (皆生グランドホテル 天水) and “Kasuitei” (華水亭) in Kaike Onsen. It was REVIC’s first turnaround support case in Tottori Prefecture. On the same day, the company’s lender, The Bank of Tottori (鳥取銀行), disclosed that its ¥2.161 billion in receivables from the company were at risk of becoming uncollectible or delayed. Then, on May 13, 2025, REVIC decided to purchase receivables and invest in the company, extending ¥552 million in loans and ¥99 million in equity, while The Bank of Tottori also set up a credit facility. The support period is up to five years.
On July 1, 2025, through a corporate split, the ryokan business, about 200 employees and the portion of financial debt that could be serviced were transferred to a new company, Kaike Grand Hotel Co., Ltd. The former entity changed its name to KGH Seiri Kaisha Co., Ltd. (KGH整理会社), resolved to dissolve at a shareholders’ meeting on January 31, 2026, filed for special liquidation on April 23 of the same year, and on June 23 the Yonago Branch of the Tottori District Court decided to commence special liquidation. The liabilities recorded at that point were ¥2.82 billion.
The ¥2.82 billion in the statistics is not “the value of a business that disappeared”
Of the ¥22.113 billion in total liabilities for H1 2026, ¥2.82 billion came from this special liquidation. Yet the business itself had moved to the new company a year earlier, and about 200 jobs were carried over. Tensui (100 rooms) and Kasuitei (79 rooms), 179 rooms in total, reopened after renovation in July 2026. Bankruptcy statistics are a metric that counts exits, but in this case they recorded “the amount left behind in the former entity,” while the properties and jobs remain in the market. Larger liabilities per case also mean more opportunities for succession-type outcomes like this to show up in the statistics.
Source: Regional Economy Vitalization Corporation of Japan, “Decision on Purchase of Receivables and Investment in Kaike Grand Hotel Co., Ltd.” (May 13, 2025); The Bank of Tottori, “Turnaround Support for Kaike Grand Hotel Co., Ltd.” (March 28, 2025); Tokyo Shoko Research; official websites of each property. Room counts are from MetroEngines Research
Who Takes Them Over? Three Tiers: Regional Finance, Public-Private Funds and Listed REITs
As the average case size increases, so does the lineup of players able to take them over. At the ¥100 million debt level, succession by local operators or individuals can work, but at the ¥600 million level, a party that can bring in both capital and operations is needed. The takeover routes that can be identified at present fall roughly into three tiers.
The first tier is the combination of regional financial institutions and public-private funds. The Kaike Onsen case is a typical example: a regional bank deals with the legacy receivables, and a public-private fund injects capital and management talent into the new company. This form tends to be chosen when a property serves as a tourism anchor for its region and employs a large workforce. The second tier is acquisition and rebranding by private equity funds and real estate developers. The third tier is listed hotel REITs, which function as an exit once operations have stabilized.
As a benchmark for that exit price, consider the acquisition prices of domestic properties held by Japan’s seven listed hotel REITs. Aggregating the 300 domestic properties for which both room count and acquisition price are available in our ownership master (as of August 31, 2026), the median acquisition price per room is ¥20.51 million, with a first quartile of ¥10.92 million and a third quartile of ¥38.94 million. Limited to the 184 properties located outside Japan’s three major metropolitan areas, the median is ¥17.84 million. Applied to a 60–100 room property, this implies an asset value range of roughly ¥1.1 billion to ¥1.8 billion.
Overlaying ¥632 million in liabilities per case makes the room for succession clear. A mid-sized regional property brought to stable operations after a turnaround can reach the per-room acquisition price range set by the listed market. A path in which a new company, freed of the carved-out debt, launches with a few hundred million yen in capital, improves occupancy and rates over about five years, and then has an exit to institutional investors works on paper in today’s ADR environment.
Source: Ownership master compiled by MetroEngines Research from disclosures by Ichigo Hotel REIT Investment Corporation (3463), Invincible Investment Corporation (8963), Nippon Hotel & Residential Investment Corporation (3472), Japan Hotel REIT Investment Corporation (8985), Hoshino Resorts REIT, Inc. (3287), Mori Trust REIT, Inc. (8961) and Kasumigaseki Hotel REIT Investment Corporation (401A) (N=300 domestic properties, as of August 31, 2026)
Conclusion — From a Metric That Counts to a Metric That Searches
Reorganizing the H1 2026 figures gives the following picture. The 35 cases fall within the same 30s range as the past five years, and the pace of exits itself is stable. What moved was liabilities per case, which rose 1.9x from about ¥338 million to about ¥632 million. The 6 published cases alone account for about 72% of total liabilities, and 5 of them are located in regional onsen or tourist destinations. Working back from earning power, this amount corresponds roughly to a 60–100 room property. The core “50+ rooms” band, which holds 77.1% of rooms in Japan’s lodging supply, is beginning to come into play as a target for succession.
Meanwhile, the rate environment continues to improve. In the ryokan category across 11 major onsen prefectures, estimated settled ADR over the latest 12 months exceeded the prior year in 10 prefectures, with gains of up to +14.2%. If the debt is carved out and the same property restarted, it can begin operating at a higher rate level than two years ago. The Kaike Onsen case shows that such a structure can actually work through a combination of regional financial institutions and a public-private fund.
Bankruptcy statistics have traditionally been read as a metric that counts exits. But when the size of each case increases, the same figures also become a metric for searching out “in which size bands succession opportunities are emerging.” Tracking liabilities per case and the geographic distribution of cases, rather than the rise or fall in case counts, makes it easier to see the outline of the next deals to move. From H2 2026 onward, these two figures are worth watching side by side.
Note on estimates: The “supportable investment capacity” in this article is a simplified estimate using published ADR levels together with typical GOP margins and assumed yields. In actual deals, the viable level varies widely depending on location, building age, capital expenditure burden, F&B ratio and borrowing terms. Individual investment decisions require a detailed feasibility study.
Related Articles
- Forecasting a Renewed Rise in Hotel and Ryokan Bankruptcies in H2 2026, Seen from the Exit Side
- Succession at Long-Established Ryokan — Structure and Survival Conditions Seen Through Data on 89 Bankruptcies
- Who Owns the Hot Spring Source? Ryokan Acquisition Valuation Across Private Sources, Piped Supply and Centralized Management
- Which Hotels Closed in 2026? Hotel Tateyama and 3 Other Properties (316 Rooms), Plus 1,149 Rooms Postponed
References and Sources
■ Bankruptcy statistics
- H1 hotel and ryokan bankruptcies at 35 cases, ¥22.1 billion in liabilities — fewer cases but sharply higher amounts (Kanko Keizai Shimbun, July 26, 2026 / Teikoku Databank research) [Japanese]
- Hotel and ryokan H1 bankruptcies at 38 cases, ¥12.8 billion in liabilities (Kanko Keizai Shimbun, July 27, 2025 / Teikoku Databank research) [Japanese]
- Hotel and ryokan H1 bankruptcies at 36 cases, ¥18.3 billion in liabilities (Kanko Keizai Shimbun, July 15, 2024 / Teikoku Databank research) [Japanese]
- Teikoku Databank, “Bankruptcy Tally: H1 2026 Report (January–June)” [Japanese]
■ Individual proceedings (courts and public disclosures)
- Tokyo Shoko Research, “How They Went Bankrupt,” January 2026 [Japanese]
- Tokyo Shoko Research, “How They Went Bankrupt,” February 2026 [Japanese]
- Tokyo Shoko Research, “How They Went Bankrupt,” March 2026 [Japanese]
- Tokyo Shoko Research, “How They Went Bankrupt,” April 2026 [Japanese]
- Regional Economy Vitalization Corporation of Japan, “Decision on Purchase of Receivables and Investment in Kaike Grand Hotel Co., Ltd.” (May 13, 2025) [Japanese]
- The Bank of Tottori, “Turnaround Support for Kaike Grand Hotel Co., Ltd.” (March 28, 2025) [Japanese]
- Kaike Onsen Kasuitei official website (reopened after renovation in July 2026)
- Kaike Grand Hotel Tensui official website (reopened after renovation in July 2026)
■ Market data
- MetroEngines Research — lodging stock by room-count band (N=27,162 properties / 1,266,919 rooms, confirmed-operation basis), estimated settled ADR (prefecture × property type, monthly), listed hotel REIT ownership master (N=300 domestic properties, as of August 31, 2026)
- Disclosure materials of each listed hotel REIT (portfolio lists and acquisition prices)