

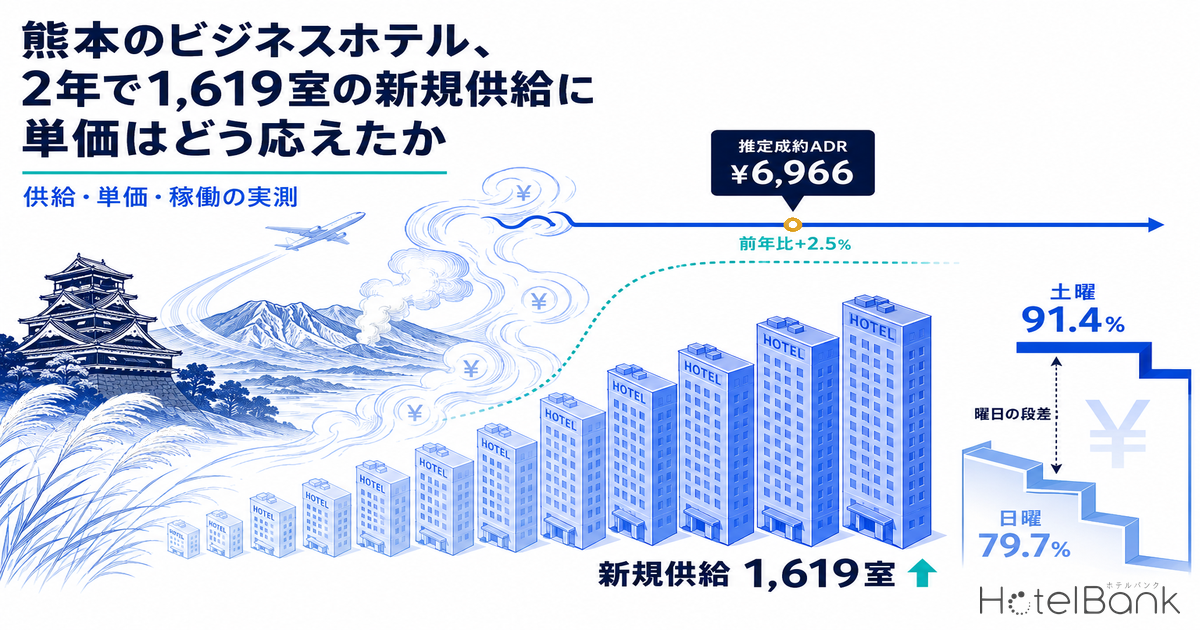
Over the two years of 2025 and 2026, Kumamoto’s business hotel segment added 14 properties and 1,619 rooms. That is equivalent to roughly 12.7% of the listed-inventory room base (an August 2026 average of 12,742 rooms across 109.1 properties). Yet as this supply piled up, the estimated settled ADR did not collapse. On a finalized basis, July 2026 came in at ¥6,574 (N=119 properties), −0.9% against ¥6,634 (N=115 properties) in the same month a year earlier. Taking the average of finalized months for January–August, 2026 stands at ¥6,966 versus ¥6,800 in 2025 — a modest +2.5% increase, if anything. Over the same period, estimated OCC (based on OTA-listed inventory) held at a monthly average of 85.6% in July 2026. “Occupancy is holding, yet rates are not rising as far as they could” — this, not a price collapse, is the pattern revenue management in Kumamoto is facing. This article lays out measured data on four points — supply, rate, occupancy and booking pace — and sets out the order in which to act under supply pressure.
Scope: Kumamoto business hotels, N=119 properties (July 2026 finalized figures), with city hotels (N=19 properties) as a reference line. The price metric in this article is estimated settled ADR (the settled-price level estimated from OTA and other sales data, tax-exclusive equivalent); occupancy is an estimate based on OTA-listed inventory. Definitions for both are at the end of the article. Data as of September 7, 2026.
- — 14 properties and 1,619 rooms were added to Kumamoto’s business hotel segment in two years — supply equivalent to about 12.7% of the listed-inventory room base.
- — Even so, estimated settled ADR has not collapsed. The January–August 2026 average of finalized months is ¥6,966 (+2.5% YoY).
- — However, compared with Fukuoka at +8.9% and Oita at +7.2%, Kumamoto has not kept pace. The cost of the new supply shows up not as a price collapse but as missed rate-growth opportunity.
- — Estimated OCC was high at 81.9–96.2% over April–August 2026. By day of week, however, there is an 11.7-point gap between Saturday (91.4%) and Sunday (79.7%) — the RevPAR upside lies outside the averages.
- — Bookings build by 15–21 points in the 15 days from 45 to 30 days before the stay date. The key is to lock in pricing before entering this window.
1,619 Rooms in Two Years — Supply Arrived in Blocks, Not Just Numbers
First, the supply-side facts. Across Kumamoto Prefecture as a whole, 38 properties with 827 rooms opened in 2025 and 49 properties with 1,448 rooms in 2026 (2026 includes openings scheduled for later in the year) — a two-year total of 87 properties and 2,275 rooms. However, this figure covers all accommodation types, including vacation rentals, guesthouses and resorts, and only part of it directly affects business hotel pricing. Narrowing to business hotels gives 7 properties and 725 rooms in 2025, 7 properties and 894 rooms in 2026 — 14 properties and 1,619 rooms over two years.
The breakdown is what matters. Of the 14 properties, the 5 with 200 or more rooms account for 1,058 rooms on their own — about 65% of new supply. There are 5 small projects of under 50 rooms, but they total just 72 rooms and their price impact is negligible. Supply did not “creep up”; rather, a handful of large projects arrived in blocks. Moreover, projects with “airport” in their names alone account for 3 properties and 624 rooms — roughly 40% of new supply concentrated around the airport. The fact that supply split between two areas with different demand sources — the city center (around Kumamoto Station and the downtown entertainment district) and the airport area — is a premise for the segment strategy discussed later.
The new-opening counts in this table are based on confirmed OTA listings. Pre-opening OTA listings account for only about 19% of the total, and more than half of properties are listed after opening, so recent and future months and years (in this table, the second half of 2026) may see property and room counts increase as more listings appear. We recommend reading this alongside the construction pipeline based on building confirmation applications and construction starts (Ministry of Land, Infrastructure, Transport and Tourism, “Building Construction Activity Statistics” — the Statistics on Building Construction Starts and Statistics on Building Demolition).
| Size band | Properties | Rooms | Share (by rooms) |
|---|---|---|---|
| 200+ rooms | 5 | 1,058 rooms | 65.3% |
| 100–199 rooms | 2 | 367 rooms | 22.7% |
| 50–99 rooms | 2 | 122 rooms | 7.5% |
| Under 50 rooms | 5 | 72 rooms | 4.4% |
| Total (2025+2026) | 14 | 1,619 rooms | 100% |
Estimated Settled ADR Held Up — But It Did Not Grow Either
The intuition that rates fall when supply equivalent to 12.7% is added is contradicted by the measured data. Estimated settled ADR (finalized) for Kumamoto business hotels ranged from ¥6,623 to ¥7,246 in 2024, ¥6,476 to ¥7,305 in 2025, and ¥6,574 to ¥7,346 in 2026 (January–August). The range itself has barely moved from year to year. The chart below overlays three years on the same January–December axis, and the three lines move up and down within roughly the same band.
Kumamoto business hotels: estimated settled ADR (finalized, tax-exclusive equivalent) / N=104–122 properties / Source: Compiled by HotelBank Editorial Team from MetroEngines Research
Comparing finalized months year over year reveals seasonal variation. January 2026 rose sharply at +9.9%, while June (−0.3%) and July (−0.9%) fell below the prior year. August recovered to +4.0%. City hotels (N=19 properties) swung more widely: the start of the year was strong at +25.6% in January and +6.6% in February, but spring through summer came in below the prior year at −3.8% in April, −6.6% in June, −2.6% in July and −7.5% in August. Rather than a year-round erosion, wins and losses split month by month — that is the real picture in Kumamoto.
| Finalized month | Business 2026 | Business 2025 | YoY | City 2026 | City 2025 | YoY |
|---|---|---|---|---|---|---|
| Jan | ¥7,120 | ¥6,476 | +9.9% | ¥11,781 | ¥9,382 | +25.6% |
| Feb | ¥7,132 | ¥6,958 | +2.5% | ¥9,635 | ¥9,037 | +6.6% |
| Mar | ¥6,814 | ¥6,712 | +1.5% | ¥9,058 | ¥9,168 | −1.2% |
| Apr | ¥6,868 | ¥6,740 | +1.9% | ¥8,952 | ¥9,309 | −3.8% |
| May | ¥7,264 | ¥7,176 | +1.2% | ¥10,216 | ¥10,088 | +1.3% |
| Jun | ¥6,612 | ¥6,635 | −0.3% | ¥8,332 | ¥8,921 | −6.6% |
| Jul | ¥6,574 | ¥6,634 | −0.9% | ¥8,842 | ¥9,078 | −2.6% |
| Aug | ¥7,346 | ¥7,066 | +4.0% | ¥10,022 | ¥10,835 | −7.5% |
| Jan–Aug average | ¥6,966 | ¥6,800 | +2.5% | ¥9,605 | ¥9,477 | +1.4% |
On its own, the +2.5% figure (business hotels, January–August average of finalized months) is hard to judge. Lining it up against finalized figures for the same category and period in neighboring prefectures clarifies its position. Fukuoka rose from ¥9,976 in 2025 to ¥10,859 in 2026, +8.9% (N=341 properties); Oita from ¥6,075 to ¥6,510, +7.2% (N=91 properties); and Kagoshima from ¥6,016 to ¥6,136, +2.0% (N=161 properties). Kumamoto’s +2.5% puts it in the lower-growth group within Kyushu. In other words, Kumamoto’s business hotels succeeded in avoiding a price collapse but did not fully ride the rate increases enjoyed by surrounding markets. The reading most consistent with the measured data is that the cost of 1,619 rooms of supply was paid not as “falling prices” but as “missed rate-growth opportunity.” Looking only at central Kumamoto City, room supply has risen +26.0% versus 2019. Our analysis testing the conditions under which new supply affects ADR across all 47 prefectures, Does New Hotel Supply Cut ADR?, is also useful for placing Kumamoto in context.
Occupancy Is Holding — But There Is a 7–12 Point Gap by Day of Week
While rates are not rising as far as they could, inventory is being absorbed well. Estimated OCC (based on OTA-listed inventory) for Kumamoto business hotels was 81.9% in April 2026, 85.9% in May, 82.6% in June, 85.6% in July and 96.2% in August. City hotels posted 86.8% / 89.5% / 86.7% / 88.4% / 95.6% over the same period — all holding in the high 80s to 90s. Despite supply growing by the equivalent of 12.7%, demand across the market as a whole has absorbed it.
| Month (2026) | Business: est. OCC | City: est. OCC |
|---|---|---|
| April | 81.9% | 86.8% |
| May | 85.9% | 89.5% |
| June | 82.6% | 86.7% |
| July | 85.6% | 88.4% |
| August | 96.2% | 95.6% |
Monthly averages, however, smooth over reality. Aggregating daily data for May–August 2026 by day of week reveals a clear step pattern for Kumamoto business hotels. The highest is Saturday at 91.4%, followed by Thursday (90.6%), Tuesday (89.6%) and Wednesday (89.3%). By contrast, Sunday is conspicuously low at 79.7%, with Monday and Friday level at 86.5%. The Saturday–Sunday gap reaches 11.7 points, and the Thursday–Sunday gap 10.9 points.
Kumamoto business hotels: estimated OCC by day of week (based on OTA-listed inventory; daily results for May–August 2026 averaged by weekday, 17–18 days per weekday) / Source: Compiled by HotelBank Editorial Team from MetroEngines Research
This shape is telling. Friday being lower than Tuesday through Thursday means business hotel demand in Kumamoto has a two-peak structure — “weekday business travel plus Saturday leisure and events” — with Friday and Sunday as the troughs. The spread between the highest and lowest days within a month is also large: in July 2026, the peak was July 18 (Sat) at 98.2% and the low was July 5 (Sun) at 68.6%, a difference of 29.6 points. Behind the 85.6% monthly average, nearly sold-out days coexist with days where over 30% of rooms sit empty. In a market where supply has grown, the first place to find additional RevPAR is within this gap. This day-of-week shape is also known to invert depending on property type; a comparison including Kumamoto’s ryokan and resorts is analyzed in detail in Kumamoto Day-of-Week Occupancy Inverts by Type.
When Do Bookings Build? — Booking Curves from 45 Days Out to the Latest Observation
Deciding when to move prices requires knowing the pace at which inventory is absorbed. For Kumamoto business hotels, we plotted estimated OCC from 45 days before the stay date to the latest observation, using Fridays and Saturdays in September and October as stay dates.
Kumamoto business hotels: booking curves by stay date (estimated OCC based on OTA-listed inventory, observed from 45 days before the stay date to the latest point) / Source: Compiled by HotelBank Editorial Team from MetroEngines Research
September 11 (Fri) stood at 63.6% at 45 days out, 84.7% at 30 days out, and 91.8% at the latest point (5 days out). September 12 (Sat) was 69.9% at 45 days, 85.0% at 30 days, and 92.7% at the latest point (6 days out). What the two dates share is that 15–21 points build up in a burst during the 15 days from 45 to 30 days out, followed by a gradual 6–8 point increase through to the latest point. In other words, business demand in Kumamoto is decided in the “T-45 to T-30 window,” after which the market enters a fine-tuning phase.
October 2 (Fri) and 3 (Sat) are still mid-observation as of this article’s data date, but matching them at the same lead time (days remaining) reveals a difference in momentum. October 2 was 67.6% at 45 days out, 76.5% at 30 days out, and 77.9% at the latest point (26 days out). October 3 was 73.9% at 45 days, 81.3% at 30 days, and 82.5% at the latest point (27 days out). Although they started higher than the same weekdays in September, at 30 days out they were 8.2 points lower on Friday and 3.7 points lower on Saturday. The “sharp rise from T-45 to T-30” seen in September has not yet taken off at the same angle for these two early-October dates.
This gap should be read with caution. Observation of early October is still in progress, and there is ample possibility of catching up over the remaining days. At a minimum, however, these dates are not on the same “over 80% by T-30” pace seen in September. A shallower curve also means, conversely, that room to move prices and draw in demand remains somewhat earlier, not at the last minute.
Autumn Rate Levels Based on Current Sales Status
For reference, the table below shows estimates for current and future stay months based on current sales status. These are snapshots taken before sales for the month are complete, and are calculated on a different basis from finalized figures. They cannot be directly compared with the finalized figures above; comparison must wait until the month is finalized. Their use is limited to “seeing the relative strength of future months against each other.”
| Stay month | Business (current estimate) | City (current estimate) |
|---|---|---|
| September 2026 | ¥10,918 (N=119) | ¥14,757 (N=19) |
| October 2026 | ¥10,590 (N=116) | ¥13,166 (N=19) |
| November 2026 | ¥10,414 (N=113) | ¥14,200 (N=19) |
| December 2026 | ¥9,586 (N=106) | ¥13,098 (N=17) |
Comparing future months with one another, October and November sit just below September, easing toward December. This ordering also makes clear that the immediate design challenge is to build a solid rate core during the autumn demand season and to work out how to fill the trough heading into December. The inventory absorption pace for November and December after the Kyushu travel support campaign (Kyushu Ouen-wari) begins on October 1 is another key input for reading this trough.
For Revenue Managers Running Business and City Hotels in Kumamoto — Implications and Action Plan
Operational Insights
(1) “High occupancy but flat rates” is likely a problem of how inventory is allocated, not of prices being too low. Market-wide estimated OCC stayed high at 81.9–96.2% over April–August 2026, while the January–August average of finalized-month ADR rose only +2.5% YoY. Compared with neighboring growth of +8.9% in Fukuoka and +7.2% in Oita, it is worth suspecting that rather than buying occupancy through discounts, low-rate segments are being left in place on high-occupancy days. When reviewing your own monthly figures, don’t look at occupancy and ADR separately — check instead “whether ADR on days above 90% occupancy exceeds the monthly average.”
(2) Fix segment mix before pricing. In a market where supply has grown by 1,619 rooms in two years — equivalent to 12.7% of the existing listed-inventory base — simple rate increases tend to push guests to competitors. The first step is to reduce the share of low-rate wholesale, fixed corporate rates and long-stay discounts remaining on high-occupancy weekdays (Saturday 91.4% and Thursday 90.6% in the May–August 2026 day-of-week averages), and shift that allocation to direct sales and dynamic rates. Realized ADR can move without touching the rate sheet.
(3) Don’t “flatten” the day-of-week gap — design it as a staircase. The 11.7-point gap between Saturday (91.4%) and Sunday (79.7%) and the 4.1-point gap between Thursday (90.6%) and Friday (86.5%) (both May–August 2026 day-of-week averages) are the shape of demand the market creates naturally. Selling every day of the week at the same price means losing revenue on high days and leaving rooms unsold on low days. Maintain step-shaped pricing by weekday, and shift to filling the troughs (Sunday and Friday) through length-of-stay conditions and multi-night stay packages.
(4) Treat Kumamoto demand in the “city center” and “airport area” as separate markets. Of the 1,619 rooms of new supply over two years, 3 properties and 624 rooms went into the airport area. Airport-area demand is heavily weighted toward transit, early-morning flights and corporate travel, with different peak days and booking lead times from city-center event and leisure demand. After confirming which demand source your property serves, there is room to rebuild the competitive set you benchmark against.
(5) The window to prepare is T-45 to T-30. September 11 (Fri) went from 63.6% at 45 days out to 84.7% at 30 days out, and September 12 (Sat) from 69.9% to 85.0%. The outcome is largely decided in these 15 days. Price moves after this window are only fine-tuning in a phase where the additional build is around 6–8 points.
How Much Each Lever Moves — RevPAR Sensitivity by ADR × OCC
Before deciding the order, it is worth understanding how much range each lever has in RevPAR terms. The table below is arithmetic multiplying the range of estimated settled ADR measured in this article (¥6,574–¥7,346) by the range of estimated OCC (79.7%–96.2%). The shaded cell is the baseline: the January–August 2026 average ADR of ¥6,966 × July 2026 estimated OCC (based on OTA-listed inventory) of 85.6% = ¥5,963.
| Est. settled ADR \ Est. OCC | 79.7% Sunday | 82.6% June | 85.6% July (baseline) | 91.4% Saturday | 96.2% August |
|---|---|---|---|---|---|
| ¥6,574 (July 2026, finalized low) | ¥5,239 | ¥5,430 | ¥5,627 | ¥6,009 | ¥6,324 |
| ¥6,800 (Jan–Aug 2025 average) | ¥5,420 | ¥5,617 | ¥5,821 | ¥6,215 | ¥6,542 |
| ¥6,966 (Jan–Aug 2026 average, baseline) | ¥5,552 | ¥5,754 | ¥5,963 | ¥6,367 | ¥6,701 |
| ¥7,150 | ¥5,699 | ¥5,906 | ¥6,120 | ¥6,535 | ¥6,878 |
| ¥7,346 (August 2026, finalized high) | ¥5,855 | ¥6,068 | ¥6,288 | ¥6,714 | ¥7,067 |
There are two ways to read this. First, the value of narrowing the day-of-week gap. If Sunday’s 79.7% can be brought toward Saturday’s 91.4%, you move from the left end of the same row to the right without changing ADR at all — a difference of ¥815 at the baseline ADR (¥5,552 → ¥6,367). Second, the exchange rate between rate and occupancy. Even if you give up 2.9 points of occupancy from the baseline (85.6% → 82.6%) to raise ADR by ¥184 (¥6,966 → ¥7,150), RevPAR slips slightly from ¥5,963 to ¥5,906. The slope of this table shows that readily sacrificing occupancy is hard to justify in a market where supply has grown.
This table is arithmetic combining the measured ranges in this article and is not a forecast. Estimated OCC is based on OTA-listed inventory and runs higher than actual room occupancy. When applying it to your own property, reinterpret the columns as your actual occupancy before checking the levels.
Placed on a timeline, the above translates into the following sequence.
| Timeframe | Action | Decision trigger (checked against figures in this article) | Objective |
|---|---|---|---|
| Today to this week | Audit inventory on high-occupancy weekdays. Identify the share of low-rate allocations (wholesale, fixed rates, long-stay discounts) remaining on Saturdays and Thursdays | If market day-of-week estimated OCC (May–August 2026 average) reaches 91.4% on Saturday and 90.6% on Thursday, but your property’s realized ADR on those days does not exceed its monthly average | Identify room to lift realized ADR without touching prices |
| Today to this week | For Fridays and Saturdays in early October, compare your property’s booking pace with the market curve at the same days remaining | At 30 days out, the market was at 76.5% for October 2 (Fri) and 81.3% for October 3 (Sat). If your property is well below this, review how inventory is released | Correct course before being forced into last-minute discounting |
| Within 2 weeks | Design multi-night conditions for trough days (Sunday 79.7% and Friday 86.5% in May–August 2026 averages). Prepare stay packages spanning Sat–Sun or Sun–Mon | If your Sunday occupancy is below the market average of 79.7% and there are multiple Saturdays closing near sell-out | Extend high-demand-day demand into trough days and earn through average length of stay |
| Within 2 weeks | Rebuild step-shaped pricing by weekday. Instead of uniform rates, place Tue–Thu and Sat one step up, and Sun and Fri one step down | If the market’s weekday spread is up to 11.7 points (May–August 2026 average, Saturday 91.4% vs Sunday 79.7%) yet your property’s rates are nearly identical across weekdays | Reduce lost revenue by matching the shape of demand |
| Toward next month (T-45 window) | Lock in settings at 45 days out for November and December stay dates first. Put a recurring “T-45 review” on the calendar | The market curve builds 15–21 points in the 15 days from 45 to 30 days out. If settings are not decided before entering this window | Put the right price in place during the period when it matters most |
| Toward next month | Review in-house spend design (breakfast, parking, late check-out, etc.) to build per-night revenue beyond the room rate | If finalized-month ADR growth in the market stays at +2.5% (January–August average) and room-rate-only upside remains smaller than in neighboring prefectures | Secure revenue sources one step removed from room-rate competition |
Order matters. Swap segment mix → minimum stay and multi-night conditions → day-of-week staircase → in-house spend. Working in this order uses up the room to move realized ADR without cutting prices first. Conversely, touching the rate sheet first tends to drag a property into a matching war with competitors in a market where supply has grown. The effect cannot be guaranteed, but it is a rational order for the pattern Kumamoto’s measured data shows.
Summary — Three Yardsticks for Reading Kumamoto
Yardstick 1: Supply growth shows up not as a “price collapse” but as “missed rate-growth opportunity.” Kumamoto’s business hotels absorbed 1,619 rooms in two years (equivalent to 12.7% of the listed-inventory base) while keeping the January–August average of finalized-month ADR at +2.5% YoY. Rates did not fall. But compared with Fukuoka at +8.9% and Oita at +7.2%, the growth left on the table is the cost. The evaluation axis during a supply cycle should not be “did rates fall versus last year” but “did rates grow as much as neighboring markets.”
Yardstick 2: Monthly averages hide the gaps. Within the July 2026 estimated OCC monthly average of 85.6%, a 98.2% day (July 18, Sat) coexists with a 68.6% day (July 5, Sun). By day of week (May–August 2026 average), there is also an 11.7-point spread between Saturday (91.4%) and Sunday (79.7%). The room to build RevPAR lies outside the averages, within these gaps.
Yardstick 3: The decision window is T-45 to T-30. September Fridays and Saturdays both built 15–21 points in these 15 days, then closed with a further 6–8 points. The two early-October dates, at 30 days out, stood at 76.5% (Friday) and 81.3% (Saturday), not showing the same rise as the same weekdays in September (84.7% and 85.0%). Move while the curve is still shallow, or be left holding inventory at the last minute — the fork in the road is always at 45 days out.
About the Data
■ Data Sources
Estimated settled ADR, estimated OCC, booking curves and new-opening counts are all based on MetroEngines Research & Consulting’s proprietary aggregation (daily observation of OTA-listed prices and listed inventory). The Ministry of Land, Infrastructure, Transport and Tourism’s “Building Construction Activity Statistics” is cited as a companion source for the construction pipeline. The neighboring-prefecture comparison (Fukuoka, Oita, Kagoshima) was obtained using the same category definitions and the same period as Kumamoto.
■ Calculation Assumptions
YoY figures are calculated only between finalized figures (past months against past months) and are not mixed with estimates for current or future months. The January–August average is a simple average of each month’s finalized figure. The RevPAR sensitivity table is the product of estimated settled ADR × estimated OCC, with both rows and columns kept within the ranges measured in this article (ADR ¥6,574–¥7,346, OCC 79.7–96.2%). The 12.7% supply figure was calculated as 1,619 newly opened rooms ÷ 12,742 rooms of listed inventory (August 2026 average).
■ Limitations and Caveats
Estimated OCC reflects the absorption of OTA-listed inventory and is defined differently from actual room occupancy (it runs higher). New-opening counts are based on confirmed OTA listings; pre-opening listings account for only about 19% of the total, so recent and future months must be treated as lower bounds. The early-October booking curves are mid-observation and do not represent a finalized outcome. The RevPAR sensitivity table is arithmetic, not a forecast, and does not guarantee any effect. Figures are a snapshot as of September 7, 2026.
- Definition of estimated OCC (based on OTA-listed inventory): OTA-listed-inventory occupancy = 100 − 100 × OTA-listed rooms remaining ÷ total rooms. It is an estimate based on the absorption of inventory sold on OTAs and is defined differently from actual room occupancy (it runs higher). Scope of this article: Kumamoto Prefecture; target months April–August 2026 (monthly averages) and May–August 2026 (day-of-week aggregation).
- Booking curves: Based on observation from 45 days before the stay date to the latest point. Target stay dates are September 11, September 12, October 2 and October 3, 2026.
- Definition of estimated settled ADR: The settled-price level (tax-exclusive equivalent) estimated from OTA and other sales data (lowest-plan level × property-type coefficient, ensembled across multiple channels). Past months are finalized figures; current and future months are estimates based on current sales status. Median error of 6.6% when reconciled against published operating results.
- Breakdown of N: Estimated settled ADR for Kumamoto business hotels covers N=104–122 properties (varies by month; N=119 properties in July 2026), and city hotels N=18–19 properties (N=19 properties in July 2026). Daily estimated OCC observation covers 104–110 business hotels with roughly 12,237–12,900 total rooms, and 17–18 city hotels. The neighboring-prefecture comparison covers Fukuoka N=341 properties, Oita N=91 properties and Kagoshima N=161 properties (all business hotels as of August 2026). New-opening counts are based on confirmed OTA listings and cover all accommodation types in Kumamoto Prefecture, with 2026 including openings scheduled later in the year. OTA listings often appear a few months before opening, and recent and future periods may increase with future listings, so they should be treated as lower bounds at this time.
- YoY for estimated settled ADR is calculated only between finalized figures (past months against past months). Estimates for current or future months are not directly compared with finalized figures.
- Data as of: September 7, 2026. Sales status and inventory change daily, so the figures in this article are a snapshot at the time of retrieval.