

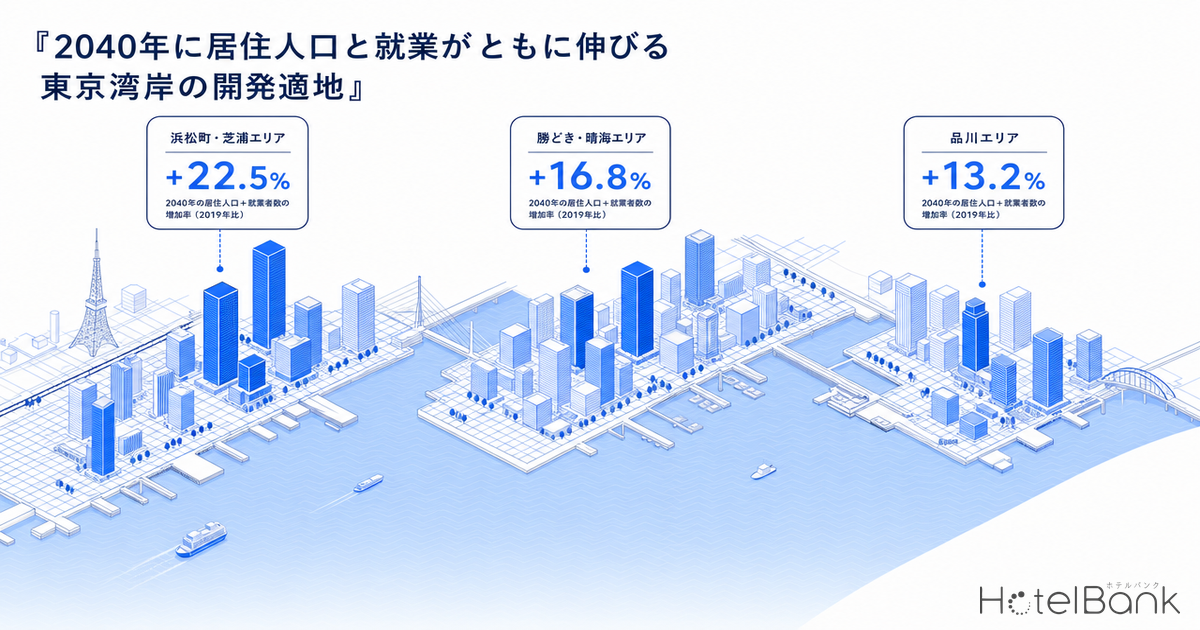
Debate over accommodation demand on the Tokyo Bay waterfront has long been framed around “concentration of inbound tourism” and “office supply from mega-developments.” This article takes a different angle: using 250m-mesh residential population data and surrounding employment data within a 1.5km radius, we extract “areas where both residential population and employment will grow toward 2040” and test whether headroom exists for new hotel investment there. The three target areas are Hamamatsucho–Shibaura, Kachidoki–Harumi, and Shinagawa.
Metric Definitions Used in This Article
- Residential population (mesh): nighttime (residence-based) population aggregated within a 1.5km radius from MLIT National Land Numerical Information “Future Population Estimates by 250m Mesh (R6 National Spatial Planning Bureau estimate).” Not daytime/staying or through-traffic population.
- 2040 rate of change: the rate of increase/decrease of the 2040 estimate versus the 2020 actual value.
- Number of establishments / number of employees: Economic Census — Activity Survey (2021). Boundaries follow the 2020 Population Census small areas (e-Stat Statistical GIS).
- ADR (average daily rate): the average of publicly listed OTA selling prices. Per-room rate (tax included) for double occupancy, averaged across all plans.
- Data sources: MLIT National Land Numerical Information; Ministry of Internal Affairs and Communications / Ministry of Economy, Trade and Industry Economic Census; MetroEngines Research & Consulting.
- — Kachidoki–Harumi: residential population +23.8% as HARUMI FLAG move-ins progress; land acquisition cost is relatively low among the three areas, giving it the top investment-priority ranking.
- — Hamamatsucho–Shibaura: outstanding office-demand depth with about 247,000 employees within a 1km radius; the shortage of mid-tier volume is the investment headroom.
- — Shinagawa: a premium as the departure station of the Linear Chuo Shinkansen (maglev), with stable residential-population growth of +13.2%; however, competition for land is intense.
- — A new mid-scale, mid-tier development of 150 rooms, ADR ¥34,000, OCC 78% (full-year assumption) yields an initial NOI yield of around 2.5%, with even the conservative scenario estimated above 2.0%.
- — The main risks are threefold: rising construction costs (around +5% p.a.), a breakdown of the residential-population estimate’s premises, and competing new supply in the waterfront area.
The Question of This Article — Why Look for “Residential Population × Employment” Dual-Growth Areas
Traditional location theory for hotel investment has converged on one of “tourist destination,” “terminal-station frontage,” or “business district.” On the Tokyo Bay waterfront, however, these three are losing their boundaries. Tower-type housing and high-rise offices rise within the same block, and weekday business demand, weekend leisure demand, and MICE / international-conference demand overlap in the same area — forming a “hybrid demand” structure.
In such areas, the sources of accommodation demand also become multi-layered. Specifically, there are three layers: (1) business-trip and corporate-contract demand for surrounding offices; (2) ceremonial-occasion, homecoming, and relative-visit demand from residential blocks; and (3) leisure demand tied to surrounding commercial and MICE facilities. Hotel investment is generally said to face medium- to long-term headwinds during a population-decline phase, but in dual-growth areas demand support can be expected from both the residential and employment sides.
This article extracts areas where both “residential population (2020→2040)” within a 1.5km radius and “number of employees within a 1km radius” are at high levels, and examines hotel-investment headroom from both quantitative and qualitative angles. Note that the residential population used here is the nighttime population on a Population Census basis and differs from staying or through-traffic population.
Tokyo-Wide ADR Backdrop — The Precondition for Waterfront Investment
Tokyo’s publicly listed OTA ADR (MetroEngines Research) moved from ¥29,594 in January 2025 to ¥36,397 by March 2026; on a monthly-average basis, a mid-¥30,000s backdrop has taken hold. The peak was ¥40,858 in January 2026 and the trough was ¥29,594 in January 2025; even accounting for seasonality, the volume band sits in the ¥30,000–¥40,000 range.
Because the waterfront area sits within Tokyo’s three central wards (Minato, Chuo, and Shinagawa), it shares this backdrop while taking a higher or lower range depending on location characteristics. This article assesses investment headroom on the premise that new waterfront hotels achieve at least Tokyo’s median ADR of ¥33,000–¥36,000, and, depending on location and facilities, aim for the upper-mid band of ¥45,000–¥60,000 and the premium band of ¥80,000 or more.
Area Demand and Location — Reading the Structure of the Three Areas Through Residential Mesh Data
The residential population of all three areas is positive in the 2020→2040 estimate. Kachidoki–Harumi shows the largest gain at +23.8% (110,000→136,000), followed by Hamamatsucho–Shibaura at +17.9% (55,000→65,000) and Shinagawa at +13.2% (110,000→125,000). While Tokyo as a whole enters a population-decline phase from the late 2030s, these three areas are expected to see continued net population gains. Below, mesh maps visualize the distribution of residential population and aging.
Hamamatsucho–Shibaura Area (Minato Ward) — A 247,000-Employee Office Zone × Residential Population +17.9%
The 1.5km radius centered on JR Hamamatsucho Station and the Yurikamome / Monorail terminus contains office clusters such as the World Trade Center Building, Tokyo Gas headquarters, and Tamachi Station Tower, alongside tower housing in the Shibaura Island and Konan areas. Nomura Real Estate and JR East’s “BLUE FRONT SHIBAURA” (formerly the Shibaura Project) completed its S Tower in February 2025, and “Fairmont Tokyo” opened on floors 35–43 in July of the same year. The N Tower is scheduled to start construction in FY2027 and complete in FY2030; this roughly 550,000㎡ mixed-use development is entering its full-fledged construction stage.
Within a 1km radius there are 7,859 establishments and 246,941 employees, with an office-worker ratio of 43.1% (Economic Census 2021). This is an extremely high level for a central-Tokyo office district, with strong connectivity for corporate travel, MICE, and international conferences. Meanwhile, the aging rate within a 1.5km radius is 14.9%, far below the Tokyo 23-ward average (about 22%), reflecting the characteristics of a tower-housing district populated by younger, working-age residents. On the premise that residential population grows +17.9% toward 2040, there is headroom for both business-travel demand and leisure demand originating from residential blocks to expand.
Kachidoki–Harumi Area (Chuo Ward) — Residential Population +23.8% as HARUMI FLAG Move-ins Progress
Kachidoki–Harumi shows the highest growth among the three areas, with residential population within a 1.5km radius rising from 110,000 in 2020 to 136,000 in 2040. At its center, “HARUMI FLAG” (the former Tokyo 2020 Athletes’ Village site) saw its twin towers “SKY DUO” (50 stories, about 2,690 units) complete in 2025, with move-ins continuing. Furthermore, in the Toyomi district, “The Toyomi Tower Marine & Sky” (54 stories, 2,046 units total) is scheduled to complete in November 2026, and the Kachidoki East District Block B is scheduled for October 2028 — a housing-supply pipeline that continues into the early 2030s.
Within a 1km radius there are 1,825 establishments and 61,752 employees — a lower employment density than Hamamatsucho–Shibaura. That said, the office-worker ratio is surprisingly high at 43.6%, reflecting corporate siting along the Harumi Pier and the business district in front of Kachidoki Station. The aging rate is low at 14.8%, reflecting HARUMI FLAG’s resident composition (centered on households in their 30s–40s). The former Tsukiji Market site (about 190,000㎡) will begin infrastructure development in FY2026, with main-building construction starting in FY2028 and phased openings in the early 2030s, planned around entertainment, MICE, and international-conference functions. Both the residential-block population increase and the phased supply from the site redevelopment point to demand support for accommodation. On the phased redevelopment of the Tsukiji site and its impact on the Ginza-east area, a scenario of two hotel allocations and demand absorption has been examined elsewhere in our analysis of the Mitsui Fudosan 11-company consortium’s ¥900 billion Tsukiji redevelopment, which serves as a useful reference line for reading the demand linkage between this Kachidoki–Harumi area and its adjacent zones.
Shinagawa Area (Southern Minato Ward / Northern Shinagawa Ward) — Maglev Departure Station × Residential Population +13.2%
The area around Shinagawa Station is increasingly established as the Tokyo-side departure station of the Linear Chuo Shinkansen (maglev), and surrounding development is progressing toward opening from 2027 onward. To the north, JR East’s “TAKANAWA GATEWAY CITY,” composed of four blocks (Mixed-Use Buildings I and II, a Cultural Creation Building, and a Residential Building), is opening in phases from 2025; a new building by Keikyu and Toyota Motor scheduled for completion in 2029, among others, continues the station-centered redevelopment.
Within a 1km radius there are 3,140 establishments and 145,380 employees, with an office-worker ratio of 33.8%. Among the three areas, its employment density is second after Hamamatsucho–Shibaura, while its residential population rivals Kachidoki–Harumi in scale. On the other hand, the aging rate is higher than the other two areas at 18.6%. This is because the Konan and Higashi-Shinagawa areas include relatively mature residential blocks, so the main driver of housing supply is renewal of existing-block housing rather than redevelopment towers. The 2040 population gain of +13.2% is the most modest among the three, but with the addition of a transport-node function as the maglev departure station, the “depth of layers” in accommodation demand is likely to take on a structure different from the other two areas. On the “tripolarization” of central Tokyo including Shinagawa, we have organized luxury-band supply trends separately in our analysis of ultra-high-rise luxury development around Tokyo Station and central-Tokyo tripolarization, which is helpful for reading the demand overlap and segmentation between the luxury band and the waterfront mid-tier.
Structural Comparison of the Three Areas — How Many Demand Layers Each Holds
| Item | Hamamatsucho–Shibaura | Kachidoki–Harumi | Shinagawa |
|---|---|---|---|
| Residential population 2020 | 55,029 | 110,089 | 110,031 |
| Residential population 2025 | 58,716 | 116,711 | 111,414 |
| Residential population 2040 | 64,901 | 136,312 | 124,533 |
| 2040 rate of change | +17.9% | +23.8% | +13.2% |
| Aging rate (2025) | 14.9% | 14.8% | 18.6% |
| Establishments (1km radius) | 7,859 | 1,825 | 3,140 |
| Employees (1km radius) | 246,941 | 61,752 | 145,380 |
| Office-worker ratio | 43.1% | 43.6% | 33.8% |
| Primary demand layer | Business + MICE | Residential + MICE | Business + Maglev |
What this comparison reveals is that the three areas grow in “non-homogeneous” ways. Hamamatsucho–Shibaura leads in employment density (246,941 within the 1km zone), with an outstanding locational advantage for business-travel and MICE demand. Kachidoki–Harumi has a structure in which residential-population growth (+23.8%) is joined in the future by the MICE function of the Tsukiji site; weekday business demand is relatively thin, but weekend and evening leisure demand deepens. Shinagawa may capture “westward travel demand out of Tokyo” through its maglev-departure-station function, with mid-range growth in both employment and housing.
Existing Hotel Supply — Density and Gaps in Each Area
Extracting operating hotels within a 1.5km radius of each area from aggregated data, there are clear differences in supply density: the Hamamatsucho–Shibaura area has 154 properties and about 19,000 rooms, the Shinagawa area has 75 properties and about 13,000 rooms, and the Kachidoki–Harumi area has 21 properties and about 3,100 rooms.
Hamamatsucho–Shibaura already has one of Tokyo’s highest supply densities, but the top ranks are occupied by large-scale city and luxury hotels such as The Prince Park Tower Tokyo (603 rooms), Villa Fontaine Grand Tokyo Shiodome (497 rooms), and Royal Park Hotel Iconic Tokyo Shiodome (490 rooms), while the mid- to upper-mid tier (ADR ¥30,000–¥50,000, 100–250 rooms) mid-scale cluster is relatively thin. The Shinagawa area is dominated by mammoth large-scale hotels centered on Shinagawa Prince Hotel (2,384 rooms), leaving the 100–200-room boutique / lifestyle band somewhat vacant.
Kachidoki–Harumi has the fewest properties and rooms of all, with accommodation supply lagging behind population growth. It relies on large-scale facilities such as La Vista Tokyo Bay (582 rooms) and Hotel JAL City Tokyo Toyosu (330 rooms), revealing a shortage of mid-scale hotels to absorb residential-block leisure and ceremonial-occasion demand. From 2026 onward, as HARUMI FLAG move-ins progress, nearby accommodation demand is structurally set to strengthen in phases. On the same question — whether demand can absorb new supply in the waterfront area — a theme-park-adjacent case of 750 new rooms in the Maihama–Urayasu Bay Area has been examined separately, providing a reference line for evaluating the waterfront supply gap.
White-Space Analysis — Three Directions for Investment Headroom
1) Hamamatsucho–Shibaura: Shortage of Mid-Tier Volume
Against dual growth of 247,000 employees and population +17.9%, supply skews toward luxury and large-scale city hotels. Headroom lies in the mid-scale cluster of ADR ¥30,000–¥50,000, 100–250 rooms. Secondary spillover of business and MICE demand is expected around the completion of BLUE FRONT SHIBAURA’s N Tower (2030).
2) Kachidoki–Harumi: Residential-Block-Linked
Against population growth of +23.8%, there are only 21 properties. Headroom lies in mid-scale (80–150 rooms) hotels absorbing residential-block ceremonial-occasion, relative-visit, and large-event demand. Plans targeting openings in 2028–2030, aligned with the launch of the Tsukiji site’s MICE function, are promising.
3) Shinagawa: Maglev Departure-Station Premium
Amid dominance by mammoth hotels, the 100–200-room lifestyle / boutique band is somewhat vacant. On the premise that the Linear Chuo Shinkansen adds Tokyo–Nagoya travel demand, opportunities also arise in the premium band of ADR ¥60,000–¥100,000.
Investment-Scenario Estimate — New Mid-Scale, Mid-Tier Hotel Development (Common Framework for the Three Areas)
As a hypothetical case, we estimate a new mid-tier hotel development in each area of “150 rooms, total floor area 7,000 tsubo, room area 25㎡, construction unit cost ¥2.2 million/tsubo.” For construction cost, we adopt a mid-tier guideline of ¥2.4 million/tsubo, based on the structure-by-structure average unit cost from MLIT’s Building Construction Starts Statistics (2024) plus a premium reflecting the concentration of hotel-specific MEP and wet-area works.For the GOP margin, the 38.9% GOP actual (fiscal period ending December 2024) of the 91 MHM-operated properties disclosed by Invincible Investment Corporation (8963) is a reference value for the stabilized-operation phase, but we adopt 32% as a conservative value for the first year after a new opening.
| Item | Hamamatsucho–Shibaura | Kachidoki–Harumi Recommended | Shinagawa |
|---|---|---|---|
| Number of rooms | 150 | 150 | 150 |
| Assumed ADR (conservative) | ¥38,000 | ¥34,000 | ¥36,000 |
| Assumed OCC (conservative) | 82% | 78% | 80% |
| RevPAR | ¥31,160 | ¥26,520 | ¥28,800 |
| Annual room revenue | ¥1.71B | ¥1.45B | ¥1.58B |
| F&B and other combined revenue | ¥0.34B | ¥0.29B | ¥0.32B |
| Total revenue | ¥2.05B | ¥1.74B | ¥1.90B |
| GOP (32%) | ¥0.66B | ¥0.56B | ¥0.61B |
| Construction cost (¥2.4M/tsubo × 7,000 tsubo) | ¥16.8B | ¥16.8B | ¥16.8B |
| Land acquisition cost (assumed) | ¥10.0B | ¥6.0B | ¥9.0B |
| Total investment | ¥26.8B | ¥22.8B | ¥25.8B |
| NOI yield (simplified) | 2.5% | 2.5% | 2.4% |
*This is a simplified estimate; an actual investment decision requires a detailed feasibility study. Construction cost is on a 2025-actual basis. Factoring in Turner & Townsend’s construction-cost forecast (+5.6% in 2025, +5.3% in 2026, +5.0% in 2027, +4.5% from 2028 onward), construction cost is projected to rise to 1.25–1.30× by completion in 2030. The impact on total investment is about +30–35%, and it becomes a downward factor on yield of roughly 0.5–0.7 pt.
Kachidoki–Harumi is positioned as the recommended candidate because: (1) land acquisition cost is relatively low among the three areas; (2) it has structural demand from residential-population growth of +23.8% that continues into the 2030s; and (3) the launch of the Tsukiji site’s MICE function provides upside. On the other hand, Hamamatsucho–Shibaura has high land acquisition cost but wins on the stability of business demand due to its outstanding employment density. Shinagawa has large option value from the maglev opening, but competition for land is also intense.
Sensitivity Analysis and Risks
| Scenario | Base | ADR −10% | OCC −5pt | Construction +30% |
|---|---|---|---|---|
| Kachidoki–Harumi total revenue | ¥1.74B | ¥1.57B | ¥1.64B | ¥1.74B |
| GOP (32%) | ¥0.56B | ¥0.50B | ¥0.52B | ¥0.56B |
| Total investment | ¥22.8B | ¥22.8B | ¥22.8B | ¥27.8B |
| NOI yield | 2.5% | 2.2% | 2.3% | 2.0% |
The main risks are fourfold: (1) continued rises in construction cost; (2) a conservative case if the premise of inbound ADR upside breaks down; (3) competing new supply in the waterfront area; and (4) a breakdown of the residential-population estimate’s premises. The residential-population estimate uses the National Spatial Planning Bureau estimate, but if the housing-supply schedules of HARUMI FLAG or the Toyomi district slip, there is a risk that Kachidoki–Harumi’s population-growth curve flattens. Conversely, if the Tsukiji site redevelopment is brought forward from the original plan, it becomes demand upside.
| Risk factor | Impact | Notes |
|---|---|---|
| Rising construction cost | High | Expected around +5% p.a. in 2025–2028; also has a supply-suppressing effect |
| Breakdown of demand premise | Mid | Tokyo ADR moving in the ¥30,000–¥40,000 range, relatively firm |
| Competing supply | Mid | Ample pipeline: BLUE FRONT N Tower, Tsukiji site, TAKANAWA GATEWAY, etc. |
| Deviation in residential-population estimate | Low | HARUMI FLAG move-ins already underway; limited downside room in the estimate |
| Rising interest rates | Mid | Risk can be mitigated by a design that limits leverage dependence |
Conclusion — An Investment Perspective Toward 2040
All three Tokyo Bay waterfront areas show growth in both residential population and employment toward 2040, but they grow in non-homogeneous ways. Hamamatsucho–Shibaura is strong in business and MICE demand with an employment density of 247,000; Kachidoki–Harumi anticipates medium- to long-term growth from residential population +23.8% and the Tsukiji site’s MICE function; and Shinagawa has the potential to capture new demand on the Tokyo–Nagoya axis through its maglev-departure-station function. The “residential × employment” dual-growth mesh method that this article applied by focusing on the three waterfront areas has, at a national scale, been organized as 17 candidate sites in our nationwide dual-growth mesh screening for 2040, which is useful for comparing the waterfront’s positioning on a national map.
Investment headroom exists in all three areas, but Kachidoki–Harumi is relatively advantageous on three points: land acquisition cost, demand structure, and public development pipeline. A new mid-scale, mid-tier development (150 rooms, ADR ¥34,000, OCC 78% (estimate premise, full-year assumption)) yields an initial NOI yield of around 2.5%, estimated to exceed 2.0% even factoring in both rising construction cost and a conservative demand scenario.
This article’s estimate is merely a simplified model; an actual investment decision requires a detailed feasibility study, land valuation, and competitive analysis. Nevertheless, the point that simply reading two public statistics — residential mesh and employment data — in combination clearly visualizes the “gradations of investment headroom” in the waterfront area offers a new perspective for hotel-investment decision-making.
References & Sources
■ Data sources
Combining the Future Population Estimates by 250m Mesh from National Land Numerical Information (Reiwa 6 National Spatial Planning Bureau estimate), the small-area aggregation of the Economic Census — Activity Survey (2021), and MetroEngines Research & Consulting’s aggregated data on publicly listed OTA ADR and hotel distribution within a 1.5km radius (a total of 250 properties / about 35,000 rooms across the three waterfront areas), we integratively analyzed residential population, employment density, and hotel supply for the three Tokyo Bay waterfront areas (Hamamatsucho–Shibaura / Kachidoki–Harumi / Shinagawa).
■ Estimate premises
As the mid-scale mid-tier model, we applied 150 rooms, ADR ¥34,000, OCC 78% (full-year assumption), a GOP margin of 32%, and a three-axis sensitivity of ADR −10% / OCC −5pt / construction +30%. Construction cost is assumed to rise to 1.25–1.30× at completion in 2030, based on the annual forecasts in Turner & Townsend’s “International Construction Market Survey 2025” (+5.6% in 2025, +5.3% in 2026, +5.0% in 2027, +4.5% from 2028 onward). Total investment, NOI yield, and cash flow reflect area-specific land acquisition costs.
■ Limitations & caveats
This article’s estimate is a simplified model; an actual investment decision requires a detailed feasibility study, careful scrutiny of land acquisition cost, and precise simulation of competing-demand absorption. The residential-population estimate depends on the supply schedules of HARUMI FLAG and the Toyomi district; in the event of plan slippage, Kachidoki–Harumi’s population-growth curve flattens. The construction-cost premise is based on the 2025 global inflation environment and may move up or down with abrupt changes in exchange rates and materials markets. OCC and ADR are benchmarked to publicly listed OTA data as of March 2026, and future values follow the demand premise.
■ Market data
- MetroEngines Research & Consulting — publicly listed OTA ADR and hotel distribution (N=1,500–1,900 properties/month; 250 properties / 35,000 rooms within a 1.5km radius across the three waterfront areas)
■ Government statistics & public data
- MLIT National Land Numerical Information — Future Population Estimates by 250m Mesh (R6 National Spatial Planning Bureau estimate)
- MIC / METI Economic Census — Activity Survey (2021) / boundaries = 2020 Population Census small areas (e-Stat Statistical GIS)
- MLIT Building Construction Starts Statistics — base data for construction cost per tsubo
■ REIT & industry reports
- Invincible Investment Corporation (8963) monthly operating results — reference for GOP actuals of 91 MHM-operated properties
- Turner & Townsend “International Construction Market Survey 2025” — construction-cost inflation forecast
■ News & press releases
- Nomura Real Estate Holdings “Shibaura 1-chome Project” press release
- BLUE FRONT SHIBAURA / Fairmont Tokyo opening information (Fashion Press)
- Kachidoki East District redevelopment to start construction in April 2026 (Kenbiya)
- Chuo Ward Toyomi district twin towers targeting completion in 2027 (Kenbiya)
- Shinagawa mega-redevelopment: new stations for both maglev and metro (Nikkei)
- Chuo Ward waterfront redevelopment summary, 2026 edition (Tower Mansion Life Design)